GDXM Killzones

4.5

KillZones Pro: Smart Institutional Levels

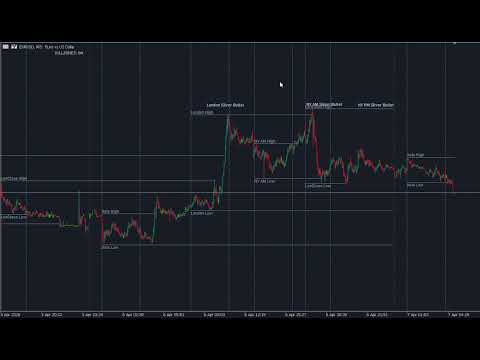
KillZones Pro is a professional-grade trading tool designed for traders who rely on institutional timing and key liquidity levels. Unlike standard session indicators that merely shade the background, KillZones Pro identifies the precise High and Low of the Asia, London, and New York sessions and projects them as "Smart Lines" that react to price action.

The indicator is optimized for the ICT (Inner Circle Trader) and SMC (Smart Money Concepts) methodologies, where session extremes act as magnets for liquidity.

Key Features

  • Smart Liquidity Lines: High and Low lines are drawn from the exact candle that formed the peak/trough.

  • Automatic Breakout Detection: Lines automatically stop extending once they are "mitigated" (hit by price), providing a clean, clutter-free chart.

  • Three Visual Modes: Choose between solid Rectangles, infinite Vertical Separators, or a clean Lines-only view.

  • Early Label Positioning: Session labels (e.g., "London High") are placed at the start of the session for immediate identification.

  • Historical Analysis: Display levels for multiple previous days to study historical liquidity sweeps and institutional footprints.

  • High-Performance Engine: Optimized code that ensures smooth scrolling and zero lag, even on lower timeframes like 1-minute or 3-minute charts.

Customization Options

KillZones Pro gives you total control over the aesthetic and functional aspects of your chart:

  • Individual Session Controls: Enable or disable Asia, London, or NY sessions independently.

  • Custom Time Windows: Fully adjustable start and end times to match your specific broker’s server time.

  • Advanced Color Coding:

    • Set independent colors for High Lines, Low Lines, and Vertical Separators.

    • Adjust Rectangle transparency and styles.

  • Visual Fidelity: Customize font names, sizes, and line styles (Solid, Dashed, Dotted) to fit your personal template.

How to Use It

  1. Liquidity Sweeps: Watch for price to "take out" a previous session High or Low (Liquidity Grab) before looking for a reversal.

  2. Support & Resistance: Use unmitigated (untouched) session levels as high-probability targets for Take Profit or entries.

  3. Institutional Timing: Trade only during the vertical separators to ensure you are active during peak market volatility.

Technical Specifications

  • Platform: MetaTrader 5 (MT5)

  • Asset Class: Forex, Indices, Commodities, and Crypto.

  • Timeframe: Works on all timeframes (optimized for M1 to H1).


Отзывы 2
9069106mc Segrid Herrera
35
9069106mc Segrid Herrera 2026.05.13 15:50 
 

Buen indicador, excelente para novatos que quieran ver las zonas relevantes del mercado

EB83Br72
1125
EB83Br72 2026.03.31 02:25 
 

bom indicador, obrigado.

Рекомендуем также
The   Swing High Low   Indicator   is an essential tool for traders who rely on price action. It automatically marks key reversal points (swing highs in red, swing lows in green), helping you visualize trends, spot breakouts, and draw precise trendlines. By highlighting these critical levels, the indicator reveals market structure shifts—whether the trend is strengthening, reversing, or entering consolidation. Perfect for all timeframes and strategies, it turns raw price data into actionable tra
FREE
This indicator marks the 50% mark of each candle. It will help you make profitable scalping trades. If the next candle opens above the 50% mark of the previous candle, you should open a BUY position, and if the next candle opens below the 50% mark of the previous candle, you should open a SELL position. This strategy is very profitable. To make the most of it, keep an eye on the candle contexts on the left. Good luck!
FREE
Candle Zones
Flavio Javier Jarabeck
You probably heard about Candlesticks behaviors, which in most of the times could denote and trace Volume behaviors even if you are not watching Volume itself... Well, this indicator will do this. Naked traders love to rely solely on candlesticks patterns and with Candle Zones you can trap special patterns and DRAW THEM on your chart. As simple as that. There are several filters you can tweak in order to achieve the analysis you want. Just give it a try. After several months of testing, we think
FREE
A professional swing point detection indicator that identifies key highs and lows with precision. Features include: Smart Detection : Identifies swing highs/lows based on customizable left/right bar analysis Visual Alerts : Clear arrows and labels (optional) mark swing points Dynamic Lines : Draws support/resistance lines that disappear when price touches them (toggle on/off) Real-Time Alerts : Sound and popup notifications for new swings Non-Intrusive : Preserves all manual chart drawings Perfe
FREE
Основное назначение:   "Pin Bars"   предназначен для автоматического обнаружения пин-баров на графиках финансовых рынках. Пин-бар – это свеча с характерным телом и длинным хвостом, которая может сигнализировать о развороте тренда или коррекции. Принцип работы:   Индикатор анализирует каждую свечу на графике, определяя размер тела, хвоста и носа свечи. При обнаружении пин-бара, соответствующего заранее определенным параметрам, индикатор отмечает его на графике стрелкой вверх или вниз, в зависимос
FREE
Norion Candle Range Levels is a professional indicator designed to highlight the maximum and minimum price range of a user-defined number of candles. By selecting a specific candle count, the indicator automatically calculates and plots the highest high and lowest low of that range, providing a clear visual reference of recent market structure, consolidation zones, and potential breakout areas. This tool is especially useful for traders who operate using price action, range expansion, and liquid
FREE
Little useful tool - you manually select range on chart by dragging vertical blue lines and indicator shows support and resistance zones for this range and extends them outside of selected range.  Useful for: * Range trading * Range breakout * Range breakout & retest * Good entry during pullback in trend phase when previous high is retested * Good for scalping on short timeframes * Good for trades on longer timeframes around selected important zones like daily high or low
FREE
WaPreviousCandleLevelsMT5
Wachinou Lionnel Pyrrhus Sovi Guidi
!!!This Free Version just works on EURUSD!!! Wa Previous Candle Levels MT5 shows the previous candle levels, it shows the previous candle Open High Low Close levels (OHLC Levels) in different time frame. It's designed to help the trader to analyse the market and pay attention to the previous candle levels in different time frame.  We all know that the OHLC Levels in Monthly, Weekly and Daily are really strong and must of the time, the price strongly reacts at those levels. In the technical anal
FREE
Индикатор Торговых Сессий Индикатор Торговых Сессий отображает максимумы и минимумы, а также время начала и окончания азиатских, лондонских и нью-йоркских торговых сессий прямо на вашем графике. Функции: Визуализация основных торговых сессий Подсветка максимумов и минимумов Отображение времени начала и окончания каждой сессии Настраиваемое время сессий Удобство использования и эффективность Настраиваемость: Каждая торговая сессия (Азиатская, Лондонская, Нью-Йоркская) может быть индивидуально нас
FREE
VWAP FanMaster
Thalles Nascimento De Carvalho
3.5 (2)
VWAP FanMaster: Освойте стратегию откатов с точностью! VWAP FanMaster — это идеальный индикатор для трейдеров, которые ищут точные точки входа и эффективные откаты . Он объединяет мощь VWAP (средневзвешенной цены по объему) и линий Фибоначчи Фан , предоставляя четкую карту зон интереса на рынке. Основные особенности Просто и мощно : Просто перемещайте вертикальные линии, и индикатор автоматически строит как VWAP , так и линии Фибоначчи Фан . Эффективная стратегия : Ждите, пока цена
FREE
Этот мощный инструмент предназначен для того, чтобы помочь трейдерам идентифицировать на своих графиках ключевые модели разворота, в том числе фигуры «молот» и «звезда». С помощью этого индикатора вы можете быстро и легко обнаруживать эти модели по мере их формирования, что позволяет вам совершать хорошо информированные сделки и потенциально увеличивать свою прибыль. Индикатор Hammer Start настраивается, что позволяет вам устанавливать собственные параметры для выявления паттернов и предупреж
FREE
TimeTake v2.03 TimeTake is a clean and useful technical indicator for MetaTrader 5 that combines a precise candlestick countdown timer with visual marking of the previous daily candle levels . Main Features: Real-time Candle Countdown Timer Displays the exact time remaining until the current candle closes in an easy-to-read format (e.g. TimeTake 23:41 or TimeTake 1D 03:12:45 ). The timer automatically switches between seconds, minutes, hours, and days. Previous Day Candle Levels (Horizontal Lin
FREE
Free for now, price is going to be 30 USD at Jan 1. 2025. Features: Pin Bar Detection : The indicator is designed to identify bullish and bearish pin bars based on specific criteria, including the relative size of the candle’s body and shadow, as well as the position of the candle's body in relation to the 38.2% Fibonacci level. Customizable Labels : Custom text is displayed above each identified bullish or bearish pin bar, such as "[38.2]" for bullish and "[-38.2]" for bearish, helping traders
FREE
Swing BOS Structure is a market structure indicator for MetaTrader 5. The indicator automatically detects: • Swing High (SH) • Swing Low (SL) • Break of Structure (BOS) • Change of Character (CHoCH) Swings are confirmed only after a defined number of candles, ensuring no repainting. BOS signals indicate trend continuation. CHoCH signals indicate a potential change in market structure and may appear less frequently depending on market conditions and timeframe. The indicator is lightweight, fa
FREE
Stackable VWAP
Flavio Javier Jarabeck
3.5 (4)
Volume Weighted Average Price (VWAP) is a trading benchmark commonly used by Big Players that gives the average price a Symbol has traded throughout the day. It is based on both Volume and price. Additionally we put in this indicator the MVWAP (Moving Volume Weighted Average Price). For those who do not know the usage and the importance od this indicator I recommend a great article about this subject at Investopedia ( https://www.investopedia.com/articles/trading/11/trading-with-vwap-mvwap.asp
FREE
Girassol Sunflower MT5 Indicator
Saullo De Oliveira Pacheco
3.86 (7)
This is the famous Sunflower indicator for Metatrader5. This indicator marks possible tops and bottoms on price charts. The indicator identifies tops and bottoms in the asset's price history, keep in mind that the current sunflower of the last candle repaints, as it is not possible to identify a top until the market reverses and it is also not possible to identify a bottom without the market stop falling and start rising. If you are looking for a professional programmer for Metatrader5, please
FREE
================================================================================               VL LEVELS INDICATOR - USER GUIDE               VolumeLeaders Institutional Trade Levels for MetaTrader 5 ================================================================================ WHAT IS THIS INDICATOR? ----------------------- This indicator displays VolumeLeaders institutional  dark pools trade levels on your MT5 charts. These levels represent price points where significant institutional trad
FREE
MYTabogFX Supply & Demand is a powerful price action indicator designed to automatically identify high-probability supply and demand zones in the market. This tool helps traders visualize institutional zones where price is likely to react, reverse, or continue. Built for precision and simplicity, it highlights clean zones based on market structure and price behavior. Key Features: • Automatic Supply and Demand Zone Detection   • Clean and Easy-to-Read Zones   • Multi-Timeframe Support   • Zone
FREE
Wave Box Market Frenquency
Jean Jacques Huve Ribeiro
4.75 (4)
Totally linked to the result of a movement and the duration he had. Its height records how many ticks the asset walked during a given movement, its width shows us the duration that movement had. Its configuration must be in line with the Weis Wave Indicator configuration to observe the movement force and can indicate a possible accumulation or distribution of the movement;
FREE
Santa Donchian
Marco Aurelio Cestari
4.5 (2)
Santa Donchian Indicator  is an efficient way to detect support, resistence and break outs in any market. The Donchian channel measures the high and the low of a previously defined range.  Typically, a trader would look for a well-defined range and then wait for the price to break out to either one side for a trade entry trigger. Advantages Never repaints, never backpaints, never recalculates. Works in all symbols and all timeframes. Perfect trend filter for any strategy or expert advisor. Full
FREE
Force Numbers
Flavio Javier Jarabeck
5 (1)
Several assets in several markets have the behavior of using specific numbers as Force Numbers, where support, resistance and price thrust is created. Let this indicator draw those levels of support and resistance for you. You can also stack it to show different level of Prices! This technique is being used by Tape Readers and Order Flow traders all over the world for a long time. Give it a try. Challenge yourself to study new ways of Price Action! SETTINGS What Price reference to use in the c
FREE
Cybertrade Keltner Channels - MT5 Created by Chester Keltner, this is a volatility indicator used by technical analysis. It is possible to follow the trend of financial asset prices and generate support and resistance patterns. In addition, envelopes are a way of tracking volatility in order to identify opportunities to buy and sell these assets. It works on periods longer than the period visible on the chart. All values ​​are available in the form of buffers to simplify possible automations.
FREE
Automatic Vwap Midas
Ricardo Almeida Branco
5 (1)
The 3 Automatic Vwap (Midas) Indicator can be used for Price and Volume studyers to map the movement of market drivers. It automatically plots 3 Vwaps, two of which are dynamic and will be updated throughout the day if new highs or new lows emerge. The third Vwap is daily and can help if the trend is up or down. Also, an auxiliary indicator that plots (also dynamic) points of interest with OHLC prices (Open, High and Low of the current day and Close of the previous day) was inserted. Success and
Value Chart Candlesticks
Flavio Javier Jarabeck
4.57 (14)
The idea of a Value Chart indicator was presented in the very good book I read back in 2020 , " Dynamic Trading Indicators: Winning with Value Charts and Price Action Profile ", from the authors Mark Helweg and David Stendahl. The idea is simple and the result is pure genius: Present candlestick Price analysis in a detrended way! HOW TO READ THIS INDICATOR Look for Overbought and Oversold levels. Of course, you will need to test the settings a lot to find the "correct" one for your approach. It
FREE
Japanese candlestick analysis has been in existence for hundreds of years and is a valid form of technical analysis. Candlestick charting has its roots in the militaristic culture that was prevalent in Japan in the 1700s. One sees many terms throughout the Japanese literature on this topic that reference military analogies, such as the Three White Soldiers pattern Unlike more conventional charting methods, candlestick charting gives a deeper look into the mind-set of investors, helping to establ
FREE
Weis Waves — это технический индикатор, разработанный Дэвидом Вайсом и основанный на принципах Ричарда Вайкоффа. В отличие от традиционного объема, который отображается бар за баром, Weis Waves накапливает объем в «волнах» роста или падения, начиная новый отсчёт при изменении направления цены. Этот метод позволяет трейдеру ясно увидеть реальную силу движения рынка , поскольку каждая волна отражает интенсивность объема, стоящего за серией свечей. Основные особенности: Группировка объема в волн
FREE
Rule Plotter Scanner
Francisco Gomes Da Silva
5 (1)
Вы когда-нибудь задумывались о наличии сканера, который анализирует все стратегии и показывает точки покупки и продажи для всех таймфреймов этого актива одновременно? Вот что именно делает этот сканер. Он предназначен для отображения сигналов покупки и продажи, которые вы создали в Rule Plotter: создатель стратегий без программирования , и их запуска внутри этого сканера на различных активах и различных таймфреймах. Стратегия Rule Plotter по умолчанию представляет собой только восходящие и нисхо
FREE
RSI abcd
Francisco Gomes Da Silva
4.33 (3)
RSI ABCD Pattern Finder: Technical Strategy 1. How the Indicator Works Combines the classic RSI with automatic detection of ABCD harmonic patterns . Key Components Standard RSI (adjustable period) Peak and Trough Markers (arrows) ABCD Patterns (green/red lines) Overbought (70) and Oversold (30) Filters 2. MT5 Setup period = 14 ; // RSI period size = 4 ; // Maximum pattern size OverBought = 70 ; // Overbought level OverSold = 30 ; // Oversold level Filter = USE_FILTER_ YES ; // Confirmation filte
FREE
Данный индикатор находит 3 довольно сильных паттерна: Свеча "волчок" Молот или повешенный Перевернутый молот или Падающая звезда Данные паттерны могут сигнализировать о продолжении тренда или о его смене, в зависимости от нахождения паттернов. Входные параметры Support - ссылка на помощь проекту Distance - расстояние от свечи до сформировавшегося сигнала Важно: Чем больше таймфрейм, тем больше должно быть значение Distance для корректного отображения сигнала Особенности индикатора Подходит для
FREE
The Weis Waves RSJ Indicator sums up volumes in each wave. This is how we receive a bar chart of cumulative volumes of alternating waves. Namely the cumulative volume makes the Weis wave charts unique. It allows comparing the relation of the wave sequence characteristics, such as correspondence of the applied force (expressed in the volume) and received result (the price progress). If you still have questions, please contact me by direct message:  https://www.mql5.com/en/users/robsjunqueira/
FREE
С этим продуктом покупают
ARIPoint
Temirlan Kdyrkhan
1 (1)
ARIBot is a powerful trading companion designed to generate high-probability entry signals with dynamic TP/SL/DP levels based on volatility. Built-in performance tracking shows win/loss stats, PP1/PP2 hits, and success rates — all updated live. Key Features: Buy/Sell signals with adaptive volatility bands Real-time TP/SL/DP levels based on ATR Built-in MA Filter with optional ATR/StdDev volatility Performance stats panel (Success, Profit/Loss, PP1/PP2) Alerts via popup, sound, push, or email Cus
SuperScalp Pro
Van Minh Nguyen
4.63 (24)
SuperScalp Pro – Продвинутая скальпинговая индикаторная система с множественными фильтрами SuperScalp Pro — это продвинутый скальпинговый индикатор, который сочетает классический Supertrend с несколькими интеллектуальными фильтрами подтверждения для поиска торговых возможностей. Он эффективно работает на различных таймфреймах от M1 до H4, с оптимизированной производительностью на XAUUSD, BTCUSD и основных валютных парах Forex. Индикатор предоставляет четкие сигналы Buy и Sell, а также автоматиче
Каждый покупатель этого индикатора получает дополнительно Бесплатно: Авторскую утилиту "Bomber Utility", которая автоматически сопровождает каждю торговую операцию, устанавливает уровни Стоп Лосс и Тейк профит и закрывает сделки согласно правилам этой стратегии, Сет-файлы для настройки этого индикатора на различных активах, Сет-файлы для настройки Bomber Utility в режимы: "Минимум Риска", "Взвешенный Риск" и "Стратегия Выжидания", Пошаговый видео-мануал, который поможет вам быстро установить, на
Entry In The Zone and SMC Multi Timeframe is a real-time 2-in-1 market analysis tool that combines market structure analysis and a No Repaint BUY / SELL signal system into a single indicator, built on Smart Money Concepts (SMC) — a widely adopted framework used by professional traders to understand market structure. This indicator helps you see the market more clearly, make decisions based on structure rather than guesswork, and focus on high-probability zones where price is more likely to react
Gold Entry Sniper – Профессиональная Мульти-Таймфрейм ATR Панель для Скальпинга и Свинг-Трейдинга на Золоте Gold Entry Sniper — это передовой индикатор для MetaTrader 5, разработанный для точных сигналов на покупку/продажу по XAUUSD и другим инструментам. Основан на логике ATR Trailing Stop и мульти-таймфрейм анализе , этот инструмент идеально подходит как для скальперов, так и для среднесрочных трейдеров, обеспечивая чёткие точки входа с высокой вероятностью . Основные возможности и преимуществ
Power Candles V3 — самооптимизирующийся индикатор силы Power Candles V3 преобразует силу валюты и инструмента в готовый к использованию торговый план на каждом графике, к которому он прикреплен. Вместо того, чтобы просто раскрашивать свечи, он выполняет автоматическую оптимизацию в режиме реального времени в фоновом режиме и предоставляет вам оптимальные значения Stop Loss, Take Profit и порог сигнала для выбранного вами символа. Один клик — и все готово для реальной торговли: на графике появляю
SignalTech MT5 is a fully rule based trading system for EURUSD, USDCHF, USDJPY, AUDUSD, NZDUSD, EURJPY, AUDJPY, NZDJPY, CADJPY.  All the winning trades with chart setups are published on the comments page. 2025-12 1174 Pips 2026-01 2624 Pips 2026-02 2937 Pips 2026-03 2165 Pips 2026-04 2243 Pips It can generate signals with Buy/Sell Arrows and Pop-Up/Sound Alerts. Each signal has clear Entry and Stop Loss levels, which should be automatically flagged on the chart, as well as potential Targets 1,
Представляем       Quantum Breakout PRO   , новаторский индикатор MQL5, который меняет ваш способ торговли в зонах прорыва! Разработан командой опытных трейдеров со стажем торговли более 13 лет,       Квантовый прорыв PRO       разработан, чтобы поднять ваше торговое путешествие к новым высотам с его инновационной и динамичной стратегией зоны прорыва. Quantum Breakout Indicator покажет вам сигнальные стрелки на зонах прорыва с 5 целевыми зонами прибыли и предложением стоп-лосса на основе поля
Gann Made Easy   - это профессиональная, но при этом очень простая в применении Форекс система, основанная на лучших принципах торговли по методам господина У.Д. Ганна. Индикатор дает точные BUY/SELL сигналы, включающие в себя уровни Stop Loss и Take Profit. ПОЖАЛУЙСТА, СВЯЖИТЕСЬ СО МНОЙ ПОСЛЕ ПОКУПКИ, ЧТОБЫ ПОЛУЧИТЬ ТОРГОВЫЕ ИНСТРУКЦИИ И ОТЛИЧНЫЕ ДОПОЛНИТЕЛЬНЫЕ ИНДИКАТОРЫ БЕСПЛАТНО! Вероятно вы уже не раз слышали о торговли по методам Ганна. Как правило теория Ганна отпугивает от себя не только
RelicusRoad Pro: Квантовая Рыночная Операционная Система СКИДКА 70% ПОЖИЗНЕННЫЙ ДОСТУП (ОГРАНИЧЕНО) - ПРИСОЕДИНЯЙТЕСЬ К 2000+ ТРЕЙДЕРАМ Почему большинство трейдеров теряют деньги даже с «идеальными» индикаторами? Потому что они торгуют Единичными Концепциями в вакууме. Сигнал без контекста — это лотерея. Чтобы выигрывать стабильно, вам нужна КОНФЛЮЭНЦИЯ . RelicusRoad Pro — это не простой стрелочный индикатор. Это полная Количественная Рыночная Экосистема . Она отображает «Дорогу Справедливой Сто
Умный многослойный детектор пробоя и отката для MetaTrader 5 «Умно. Просто. Быстро!» Устали упускать точки входа с высокой вероятностью пробоя? Тратите часы на просмотр нескольких графиков, пытаясь совместить пробои с направлением тренда и динамикой валют — и всё равно упускаете движение? Break Pullback решает всё это с помощью одного индикатора. Что такое Break Pullback? Break Pullback — это профессиональный индикатор MetaTrader 5, созданный специально для трейдеров, торгующих по структуре ры
Если вы покупаете этот индикатор, вы получите мой профессиональный Trade Manager + EA БЕСПЛАТНО. Прежде всего стоит подчеркнуть, что эта торговая система является индикатором без перерисовки, без повторной отрисовки и без задержки, что делает ее идеальной как для ручной, так и для роботизированной торговли. Онлайн курс, руководство и загрузка пресетов. «Smart Trend Trading System MT5» - это комплексное торговое решение, созданное для новичков и опытных трейдеров. Он объединяет более 10 премиаль
Azimuth Pro
Ottaviano De Cicco
5 (7)
Azimuth Pro V2: Синтетический фрактальный структурный анализ и подтверждённые входы для MT5 Обзор Azimuth Pro — многоуровневый индикатор свинговой структуры от Merkava Labs . Четыре вложенных уровня свингов, привязанный к свингам VWAP, определение ABC-паттернов, трёхтаймфреймная структурная фильтрация и подтверждённые входы на закрытой свече — один график, один рабочий процесс от микро-свингов до макро-циклов. Это не слепой сигнальный продукт. Это рабочий процесс, основанный на структуре, для т
FX Trend NG: Следующее поколение интеллектуального анализа трендов на разных рынках Обзор FX Trend NG — это профессиональный инструмент анализа трендов и мониторинга рынка с поддержкой нескольких таймфреймов. Он позволяет за секунды получить полное структурное понимание текущего состояния рынка. Вместо переключения между десятками графиков вы мгновенно видите, какие инструменты находятся в тренде, где импульс ослабевает и где наблюдается сильная синхронизация между таймфреймами. Специальное пр
Quantum TrendPulse
Bogdan Ion Puscasu
5 (25)
Представляем   Quantum TrendPulse   , совершенный торговый инструмент, который объединяет мощь   SuperTrend   ,   RSI   и   Stochastic   в один комплексный индикатор, чтобы максимизировать ваш торговый потенциал. Разработанный для трейдеров, которые ищут точность и эффективность, этот индикатор помогает вам уверенно определять рыночные тренды, сдвиги импульса и оптимальные точки входа и выхода. Основные характеристики: Интеграция SuperTrend:   легко следуйте преобладающим рыночным тенденциям и п
Прежде всего стоит подчеркнуть, что этот торговый индикатор не перерисовывается, не перерисовывает и не отставает, что делает его идеальным как для ручной, так и для роботизированной торговли. Руководство пользователя: настройки, вводы и стратегия. Атомный аналитик - это индикатор ценового действия PA, который использует силу и импульс цены, чтобы найти лучший край на рынке. Оборудованный расширенными фильтрами, которые помогают убирать шумы и ложные сигналы, и повышают торговый потенциал. Испо
Прежде всего стоит подчеркнуть, что этот Торговый Инструмент является Неперерисовывающимся Нерепейнтинговым Индикатором, что делает его идеальным для профессиональной торговли. Онлайн-курс, руководство пользователя и демонстрация. Индикатор Концепций Умного Действия Цены - очень мощный инструмент как для новичков, так и для опытных трейдеров. Он объединяет более 20 полезных индикаторов в одном, комбинируя передовые торговые идеи, такие как анализ Inner Circle Trader и стратегии торговли концеп
Btmm state engine pro
Garry James Goodchild
5 (4)
BTMM State Engine Pro is a MetaTrader 5 indicator for traders who use the Beat The Market Maker approach: Asian session context, kill zone timing, level progression, peak formation detection, and a multi-pair scanner from a single chart. It combines cycle state logic with a built-in scanner dashboard so you do not need the same tool on many charts at once. What it does Draws the Asian session range; session times can follow broker server offset or be set in inputs. Tracks level progression (L
Давайте сначала будем честны. Ни один индикатор сам по себе не сделает вас прибыльным. Если кто-то говорит вам обратное — он продаёт вам мечту. Любой индикатор, который показывает идеальные стрелки покупки/продажи, можно сделать безупречным — просто увеличьте нужный участок истории и сделайте скриншот успешных сделок. Мы так делать не будем. SMC Intraday Formula — это инструмент. Он считывает структуру рынка за вас, определяет зоны с наивысшей вероятностью движения цены и точно показывает, как
Market Structure Order Block Dashboard MT5 — это индикатор MT5, разработанный для трейдеров, которые хотят читать рыночную структуру и основные зоны реакции цены прямо на графике. Он объединяет BOS, ChoCH, Order Blocks, Fair Value Gaps (FVG), Ликвидность, Kill Zones, Volume Profile и компактную панель для быстрого анализа. Индикатор предназначен для трейдеров, использующих рыночную структуру, концепции ICT и Smart Money как основу для принятия решений. Он помогает выявлять продолжения тренда, во
Большинство стрелочных индикаторов дают сигнал и оставляют вас самостоятельно разбираться со всем остальным. KT Alpha Hunter Arrows дает вам полный торговый план. Каждая сигнальная стрелка появляется вместе с уже готовым планом: линия входа, стоп-лосс, четыре уровня тейк-профита и живой вердикт по преимуществу, который показывает, стоит ли сейчас торговать данный символ и таймфрейм. В комплект входит Trade Manager EA, который берет на себя сопровождение сделки после вашего входа, помогая сохраня
Представляю Вам отличный технический индикатор GRABBER, который работает, как готовая торговая стратегия "Все включено"! В одном программном коде интегрированы мощные инструменты для технического анализа рынка, торговые сигналы (стрелки), функции алертов и Push уведомлений.  Каждый покупатель этого индикатора получает дополнительно БЕСПЛАТНО:  Grabber Утилиту для автоматического управления открытыми ордерами, Пошаговый видео-мануал : как установить, настроить и торговать, Авторские сет-файлы дл
Топовый индикатор МТ5, дающий сигналы для входа в сделки без перерисовки! Идеальные точки входа в сделки для  валют, крипты, металлов, акций, индексов !  Смотрите  видео  (6:22) с примером отработки всего одного сигнала, окупившего индикатор. Версия индикатора для MT4 Преимущества индикатора Сигналы на вход без перерисовки Если сигнал появился, он никуда НЕ исчезает! В отличие от индикаторов с перерисовкой, которые ведут к потере депозита, потому что могут показать сигнал, а потом убрать его. Б
Meridian Pro
Ottaviano De Cicco
5 (2)
Meridian Pro 2.00: профессиональная multi-timeframe матрица тренда для MT5 Meridian Pro 2.00 - профессиональная адаптивная матрица тренда для MetaTrader 5. Она объединяет оригинальный трендовый движок Meridian, чистый chart ribbon, сигнальные стрелки по закрытому бару, dashboard на 8 таймфреймов, Fuel momentum, weighted consensus, synthetic HTF processing и chart-native линии контекста старших таймфреймов. Цель простая: читать текущий тренд, multi-timeframe структуру, силу, momentum и EA-ready с
Эта панель показывает последние доступные   гармонические паттерны   для выбранных символов, так что вы сэкономите время и будете более эффективны /   MT4 версия . Бесплатный индикатор:   Basic Harmonic Pattern Колонки индикатора Symbol:   отображаются выбранные символы Trend   :   бычий или медвежий Pattern   :   тип паттерна (Гартли, бабочка, летучая мышь, краб, акула, шифр или ABCD) Entry   :   цена входа SL:   цена стоп-лосса TP1:   цена первого тейк-профита TP2:   цена второго тейк-профи
FX Power: Анализируйте силу валют для более эффективной торговли Обзор FX Power — это ваш незаменимый инструмент для понимания реальной силы валют и золота в любых рыночных условиях. Определяя сильные валюты для покупки и слабые для продажи, FX Power упрощает принятие торговых решений и выявляет высоковероятные возможности. Независимо от того, хотите ли вы следовать за трендами или предсказывать развороты с использованием экстремальных значений дельты, этот инструмент идеально адаптируется под
OrderFlux | Футпринт и Orderflow для MetaTrader 5 Версия 2.0 – Визуализация Bid/Ask в реальном времени для активных трейдеров OrderFlux — это индикатор футпринта и потока ордеров (orderflow) для MT5. Он показывает не только, куда пошла цена, но и что происходит внутри движения: объем Bid/Ask на каждом ценовом уровне, дельту, дисбаланс (imbalance) и распределение объема. Многие графики показывают вам только конечный результат свечи. OrderFlux показывает вам путь к нему. Именно это помогает, когда
OmniSync Projection
Antonio-alin Teculescu
5 (1)
Chronos Fractal Engine is an innovative price projection indicator for MetaTrader 5, designed to transform your technical analysis by intelligently identifying and projecting historical price patterns. Built upon an advanced correlation algorithm and the fractal principles of the market, this powerful tool visualizes potential future price movements, giving you a unique edge in your trading decisions. What is Chronos Fractal Engine? At its core, the Chronos Fractal Engine employs a sophisticat
TREND LINES PRO   помогает понять, где рынок действительно меняет направление. Индикатор показывает реальные развороты тренда и места, где крупные участники входят повторно. Вы видите   BOS-линии   смены тренда и ключевые уровни старших таймфреймов — без сложных настроек и лишнего шума. Сигналы не перерисовываются и остаются на графике после закрытия бара. VERSION MT4     -     Раскрывает свой максимальный потенциал в связке с индикатором  RFI LEVELS PRO Что показывает индикатор: Реальные смены
FX Levels: Исключительно точные уровни поддержки и сопротивления для всех рынков Краткий обзор Ищете надежный способ определить уровни поддержки и сопротивления для любых инструментов—валют, индексов, акций или сырьевых товаров? FX Levels сочетает традиционный «Lighthouse» метод с современным динамическим подходом, обеспечивая почти универсальную точность. Благодаря сочетанию опыта реальных брокеров и автоматических ежедневных плюс «в реальном времени» обновлений, FX Levels поможет вам выявлят
Другие продукты этого автора
HTF Candles Overlay
Gustavo Barros Alexandre D Almeida
This indicator is an advanced visual tool designed for traders who rely on Multiple Timeframe (MTF) Analysis . It allows you to visualize High Timeframe (HTF) candles directly on your current chart, making it easy to identify supply and demand zones and macro trend direction without switching tabs. The standout feature of this indicator is its ability to generate Synthetic Timeframes , providing an institutional perspective that MetaTrader 5 does not offer natively. Main Features 1. Exclusive Sy
FREE
GDXM Period Separador
Gustavo Barros Alexandre D Almeida
Contextualize the Narrative: Multi-Timeframe Structure Simplified The HTF Period Cycles is a high-performance visualization tool designed for traders who need to anchor their intraday analysis to Higher Timeframe (HTF) levels without the friction of switching tabs. By projecting the Open, High, Low, and Close (OHLC) of completed HTF cycles directly onto your lower timeframe (LTF) chart, you can maintain a crystal-clear bias while executing in the "now." Why This belongs in Your Toolkit Successfu
FREE
GDXM Period Open Line
Gustavo Barros Alexandre D Almeida
GDXM Period Open Line The GDXM Period Open Line is a powerful institutional tool designed for traders who follow ICT concepts , SMC (Smart Money Concepts) , or price action strategies that rely on time-based price levels. In institutional trading, the opening price of a specific period (Yearly, Monthly, Weekly, or Daily) serves as the "Equilibrium" point. Trading above the opening price is considered a premium (seek shorts), and trading below is considered a discount (seek longs). This indicator
FREE
GDXM Session Open Line PO3
Gustavo Barros Alexandre D Almeida
This indicator is a specialized utility for traders following the ICT (Inner Circle Trader) methodology, specifically focusing on the Power of Three (PO3) concept: Accumulation, Manipulation, and Distribution. The ICT PO3 Open Line automatically identifies and plots critical opening prices from specific market sessions, allowing you to visualize price action relative to the "True Open" of the day or specific sessions. Key Features 1. Daily PO3 Open Levels The indicator tracks and draws horizonta
FREE
GDXM Multi Symbol Comparisson
Gustavo Barros Alexandre D Almeida
Multi Symbol Comparison GDXM The Multi Symbol Comparison GDXM is a professional-grade institutional analysis tool designed for traders utilizing Smart Money Concepts (SMC) and ICT methodologies to identify market divergences and "cracks in correlation" (SMT - Smart Money Technique). Unlike standard comparison indicators, this tool allows you to visualize up to 5 assets simultaneously, normalized on a 0–100% efficiency scale. This makes it effortless to identify which asset is leading or failing
FREE
GDXM Multi Symbol Comparisson Window The Multi Symbol Correlation Oscillator GDXM is a precision tool engineered for institutional traders and Smart Money Concepts (SMC) practitioners. This version operates in a separate window, transforming the price action of up to 5 assets into a normalized 0–100% efficiency scale. It is the perfect solution for identifying high-probability divergences without cluttering your main price chart. There is a version for the main chart . By isolating asset moveme
FREE
GDXM Fractal PO3 Custom HTF
Gustavo Barros Alexandre D Almeida
GDXM Fractal PO3 Custom HTF Master the Narrative: Higher Timeframe Fractals at Your Fingertips The GDXM Fractal PO3 Custom HTF is a professional-grade visualization tool designed specifically for Inner Circle Trader (ICT) and Smart Money Concept (SMC) practitioners. In the world of high-probability trading, understanding the Power of 3 (PO3) —Accumulation, Manipulation, and Distribution—across multiple timeframes is the key to building a winning market narrative. Why Every ICT Trader Needs This
Фильтр:
9069106mc Segrid Herrera
35
9069106mc Segrid Herrera 2026.05.13 15:50 
 

Buen indicador, excelente para novatos que quieran ver las zonas relevantes del mercado

Gustavo Barros Alexandre D Almeida
2043
Ответ разработчика Gustavo Barros Alexandre D Almeida 2026.05.13 21:19
No hay de qué, hermano!
EB83Br72
1125
EB83Br72 2026.03.31 02:25 
 

bom indicador, obrigado.

Gustavo Barros Alexandre D Almeida
2043
Ответ разработчика Gustavo Barros Alexandre D Almeida 2026.04.06 16:31
Valeu brother. Vou postar uma atualização melhor essa semana com a opção de plotar os horários dos silver bullets de cada killzone
Ответ на отзыв