Runner
- Experts
- Nurken Buralkiyev
- Versão: 1.0
- Ativações: 5
| The best way to test EA is from the date of publication till the date you downloaded it |
|---|
Strategy Overview
This EA is a trend following EA with pre-breakout detection and entry specifically designed for small accounts. The entry is triggered very early before the trade gets crowded which allows great R:R potential. The main position targets the breakout zone. The price visiting the breakout zone is much more likely than the breakout itself. Optional second position(runner) at the same entry price has no target price but equiped with a trailing stop loss (default 1%) in case if the price breaks out. Further, the runner follows a fresh medium term trend from the early stage. As a result, this approach allows to achieve assymetric payoff structure, allowing small positions earn big. In this particular test, Capital $1000, risk per trade $60($30 main +$30 runner) maximus loss per trade is $32, largest achieved profit $878.
Model architecture
The model consists of pre-breakout detection module, the trend facilitator and correlation filter. To increase model performance 6 instruments can be traded simultaneously(optional). Optional correlation guard prevents skewed positioning to overcorrelated trades. The model should run with correlation guard and trend filter enabled. 6 instruments are chosen as best performing and responsive to this setup over the last 6 years. Based on statistics of each instrument(see below), the user can choose to disable any by deleting the ticker in the symbol field. This EA can be attached to any chart and timeframe. It will trade only chosen instruments on 15 minute(default).
Since symbols for indices may differ on different broker platforms, for the following symbols, clear the symbol field and type the equivalent ticker name used by your broker:
-
SPX500: (e.g., US500, SPX.500, SPX500USD, or SPX)
-
GER40: (e.g., DE30EUR, DE40, DE30, or DAX)
-
NAS100: (e.g., NDX, NAS100USD, or USTEC)
Note: Gold, Silver, Oil, EURUSD underperform this strategy. You can test Bitcoin, other crypto or cross-currencies for example instead of NAS100(since NAS100 is correlated with SPX500 and one of them is skipped overime because of correlation). Follow recommended ranges for parameters.
Choosing and testing other instruments should be done in isolation. To make this possible, all other symbol names should be deleted except the tested one. After completing the test save the settings. right click and choose "Save Version"
To return default setting simply right click and choose "Default".
The default settings are the most robust and passed all minimum tests for current instruments. However there are less stable but more profitable clusters in the parameter set which have developed in the last 2 years. Keep in mind that these unstable parameters are temporary momentum based and may change/shift again. The model has no deep drawdon but can stay flat overtime. Have patience because when it trades it trades big.
To choose your drawdown level simply scale your position relative to the capital. But make sure your dollar position is enough to cover minimum margin requirement. Otherwise it will be simple skipped. For example, for Bitcoin some brokers require minimum $200 position in high vol periods.
Below is the summary of total trades and per instrument. Disable any instrument by deleting its name if not suitable.
================================================================================
EXECUTIVE SUMMARY — TOTAL (ALL INSTRUMENTS)
================================================================================
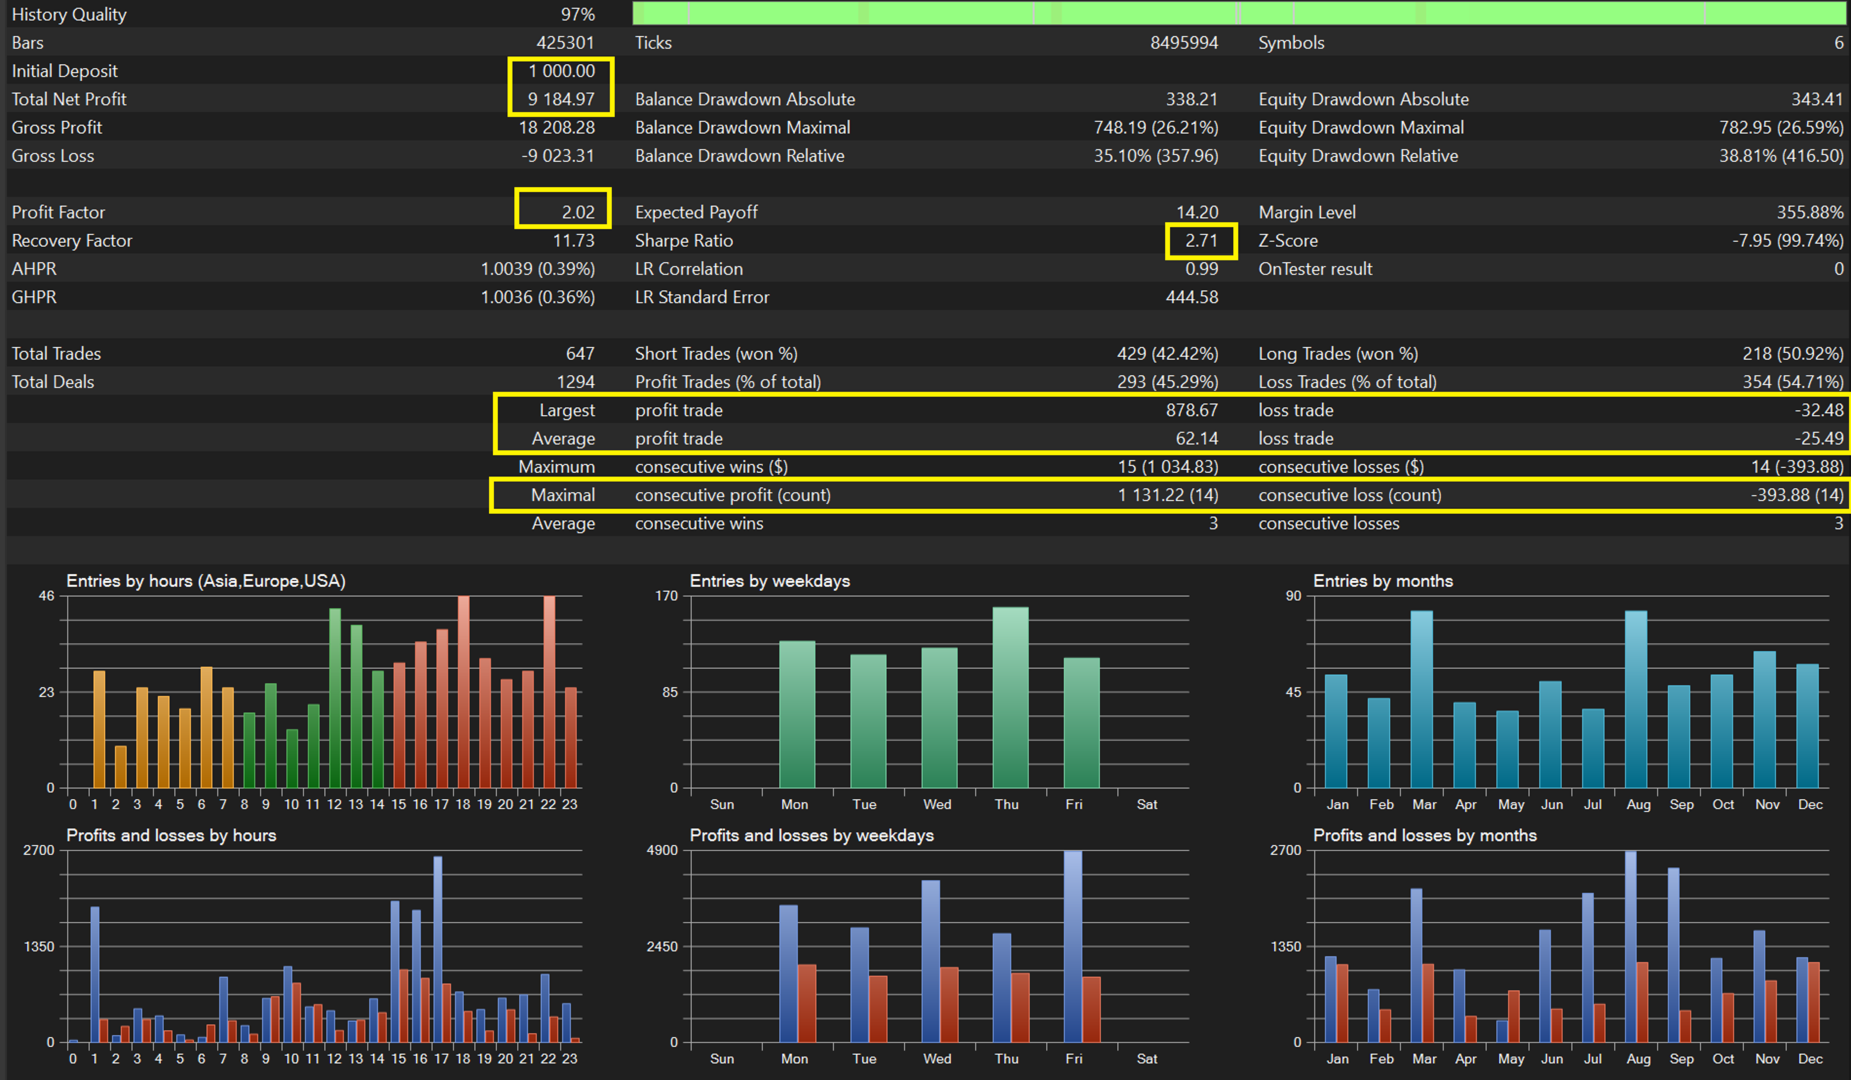
Account Performance
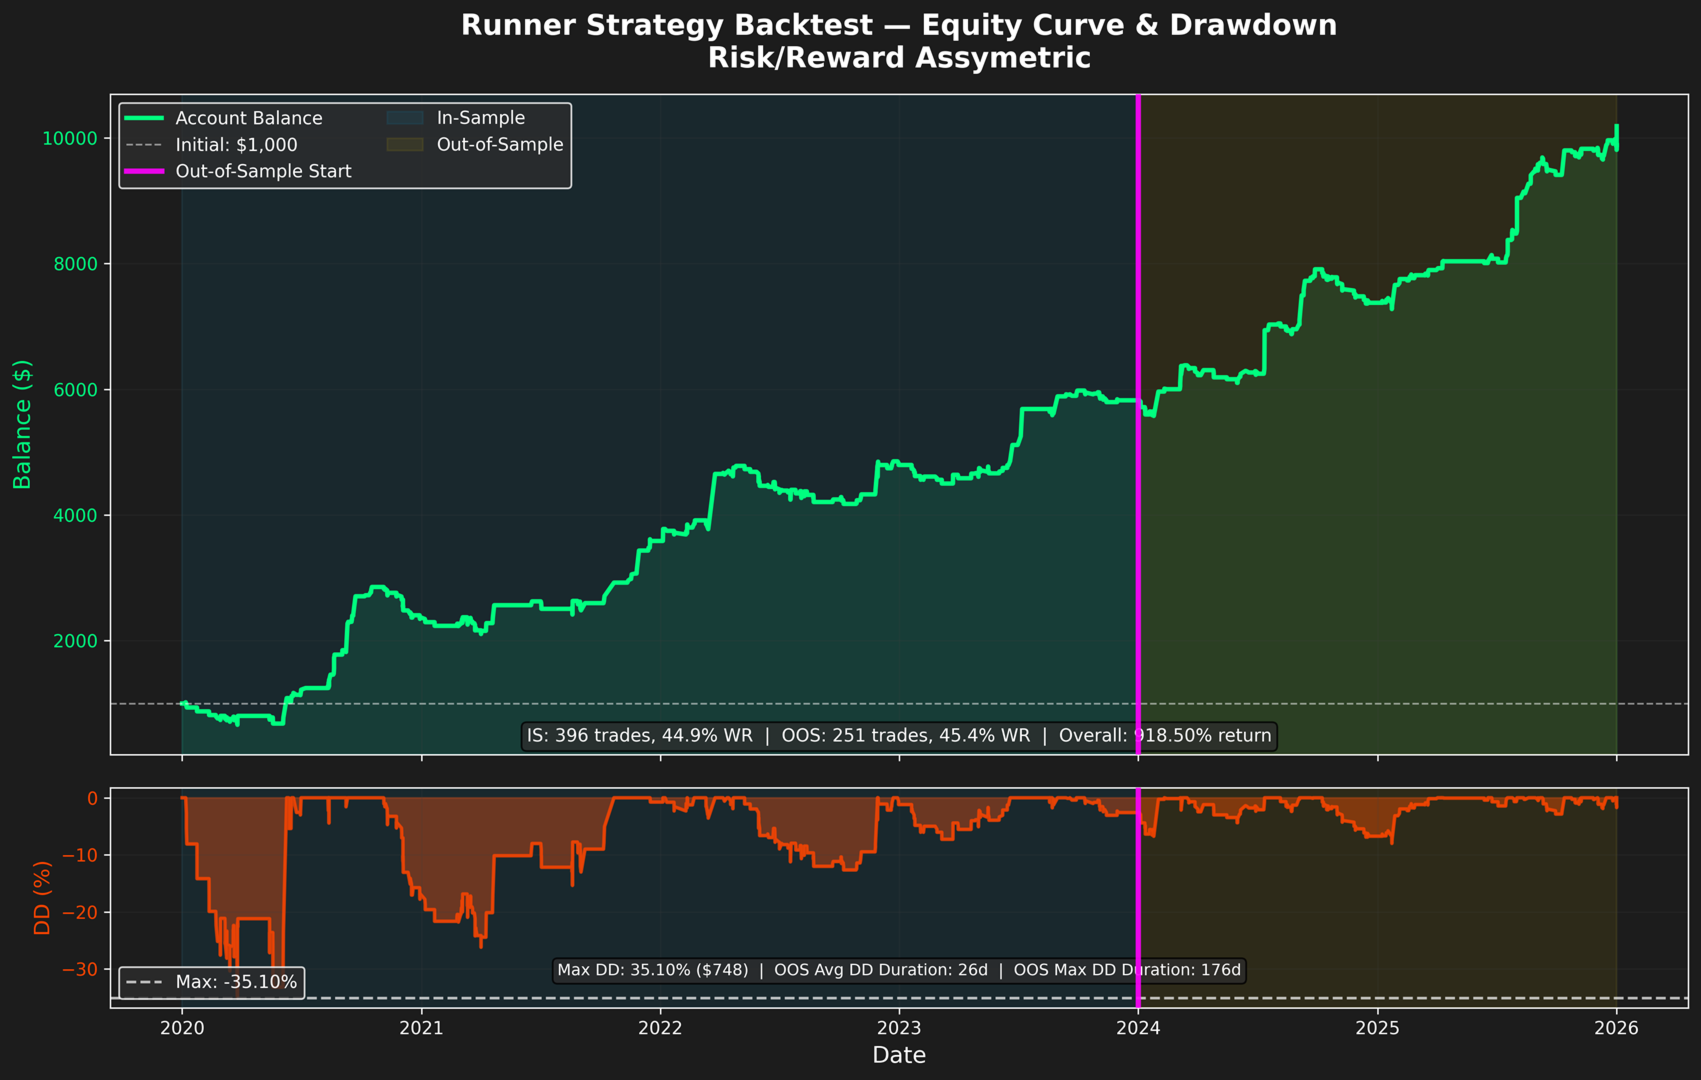
Initial Balance: $1,000.00
Final Balance: $10,184.97
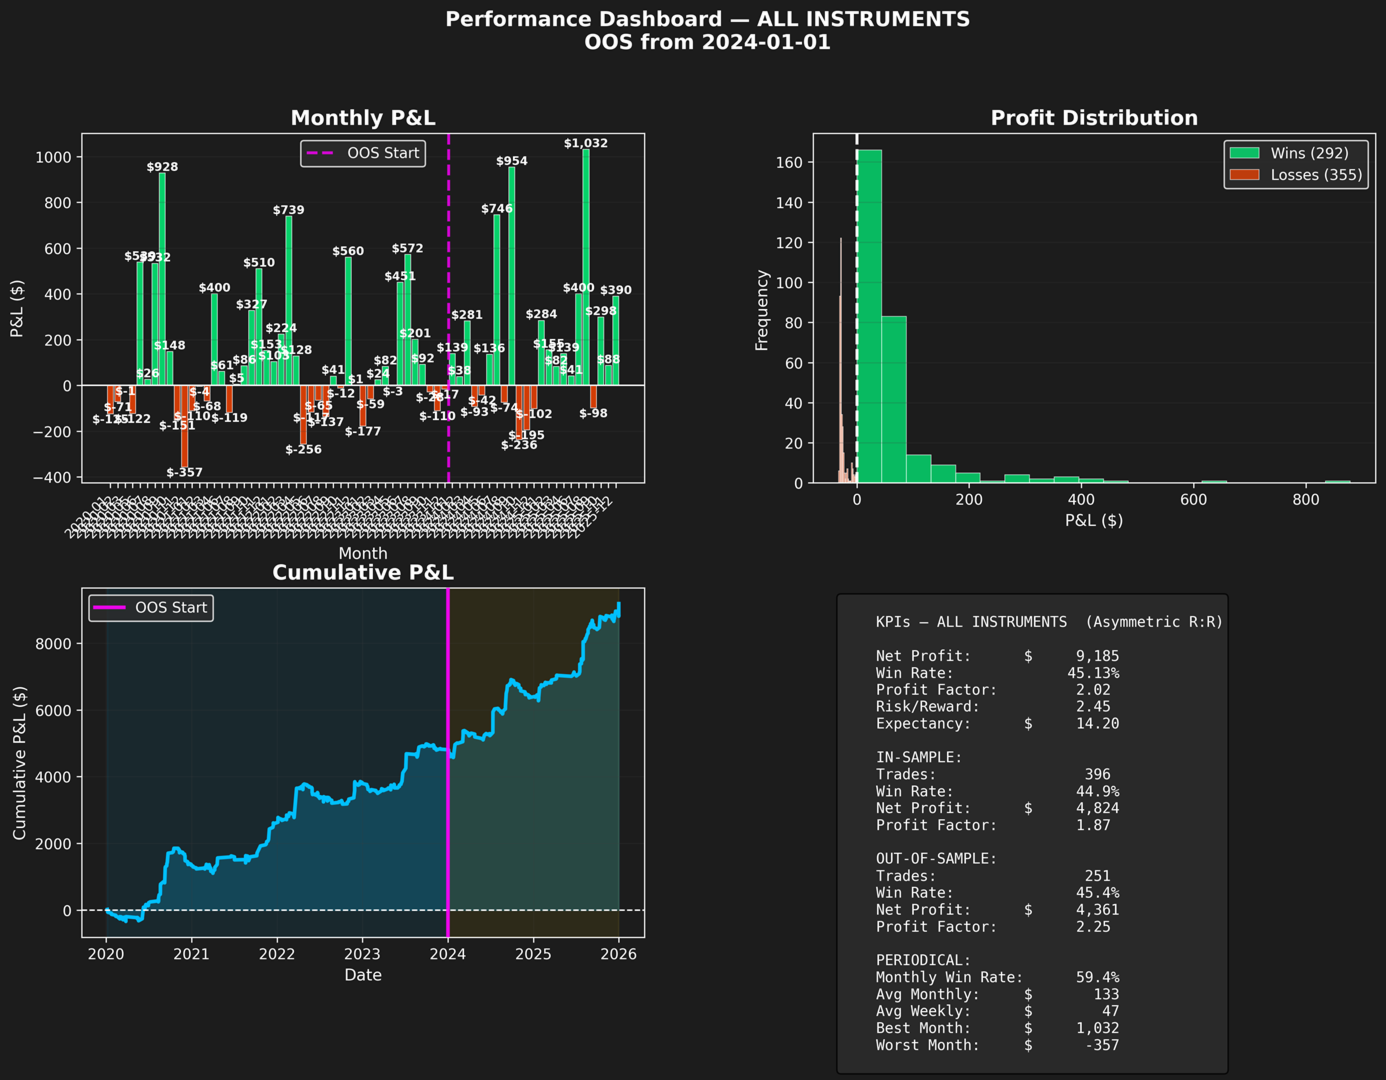
Net Profit/Loss: $9,184.97
Total Return: 918.50%
Trading Period: 2191 days (2020-01-01 to 2025-12-31)
Trading Activity
Total Trades: 647
Winning Trades: 292 (45.13%)
Losing Trades: 355 (54.87%)
Average Trade: $14.20
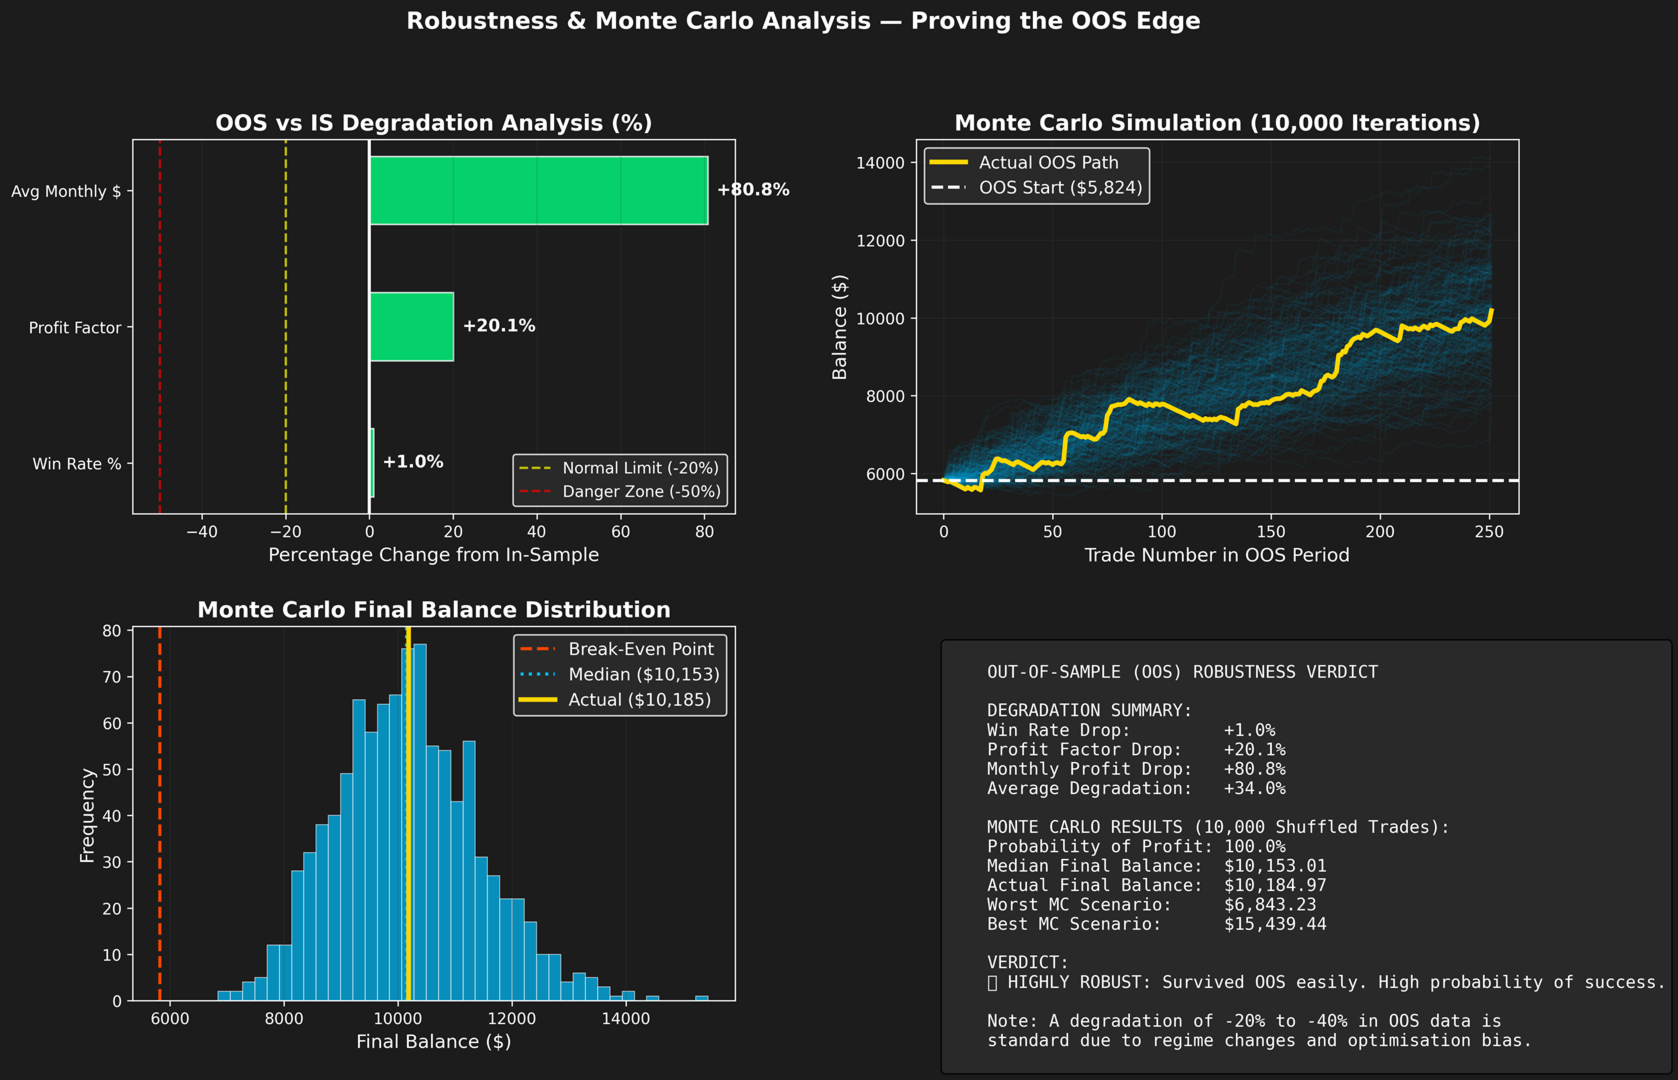
In-Sample (Before 2024-01-01)
Trades: 396 | Win Rate: 44.95% | Net Profit: $4,823.65 | PF: 1.87
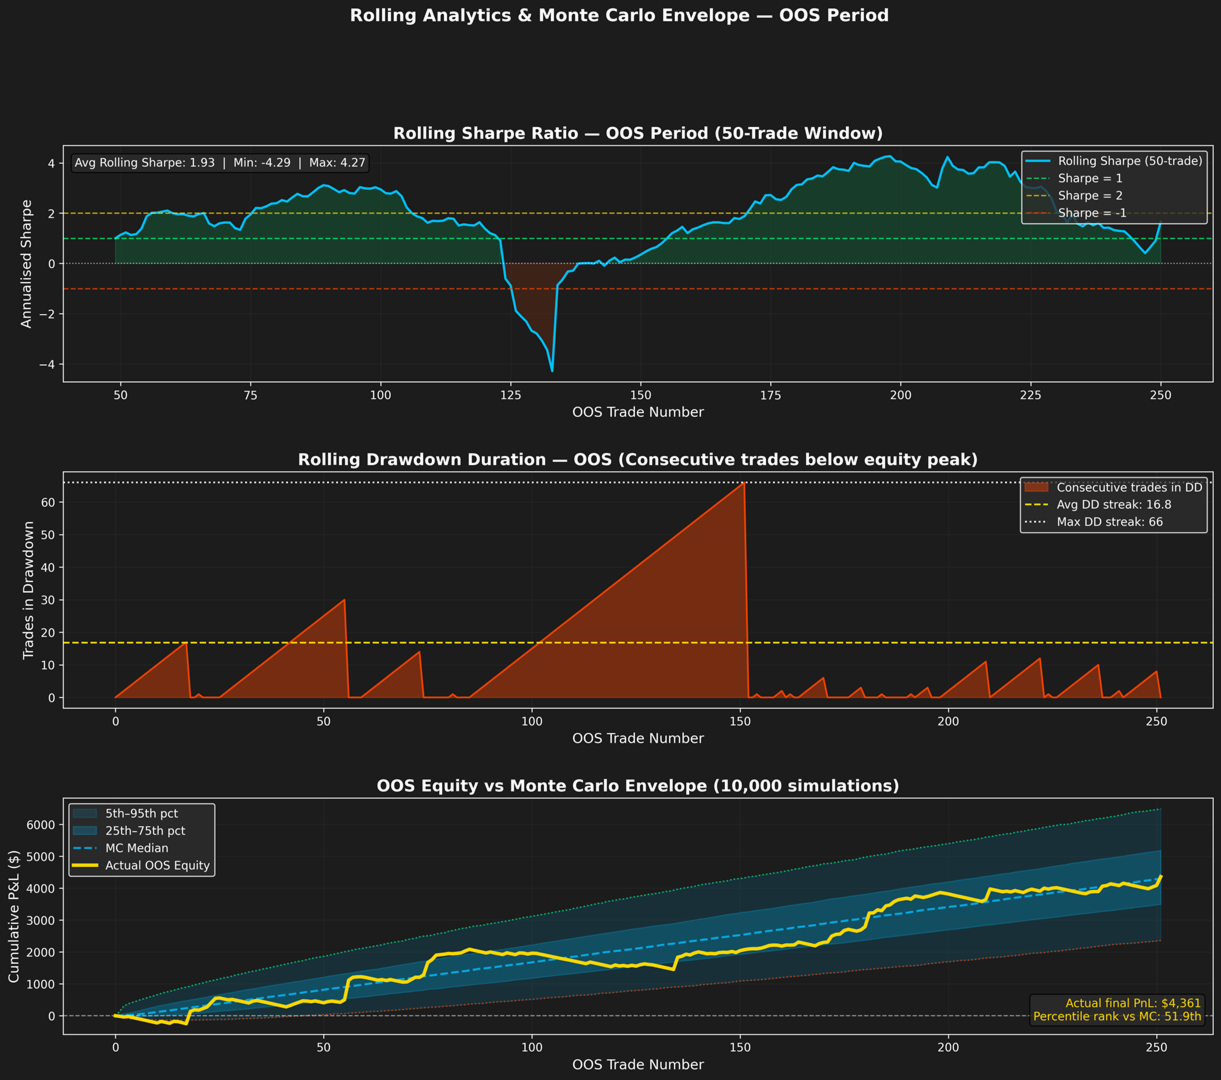
Out-of-Sample (From 2024-01-01)
Trades: 251 | Win Rate: 45.42% | Net Profit: $4,361.32 | PF: 2.25
Profitability Metrics
Gross Profit: $18,208.28
Gross Loss: $9,023.31
Profit Factor: 2.02
Average Win: $62.36
Average Loss: $-25.42
Risk/Reward Ratio: 2.45
Expectancy per Trade: $14.20
Largest Win: $878.67
Largest Loss: $-32.48
Risk Metrics
Maximum Drawdown: -35.10% ($748.19)
Avg Drawdown Duration (OOS): 26 days
Max Drawdown Duration (OOS): 176 days
Sharpe Ratio: 1.49
Sortino Ratio: 3.35
Calmar Ratio: 1.84
Value at Risk (95%): -1.23%
Consistency Metrics
Max Consecutive Wins: 15
Max Consecutive Losses: 14
Monthly Win Rate: 59.42%
Best Month: $1,031.74
Worst Month: $-356.58
Avg Monthly Return: $133.12
Avg Weekly Return: $46.62
Trade Timing
Avg Holding Time: 25.9 hours
================================================================================
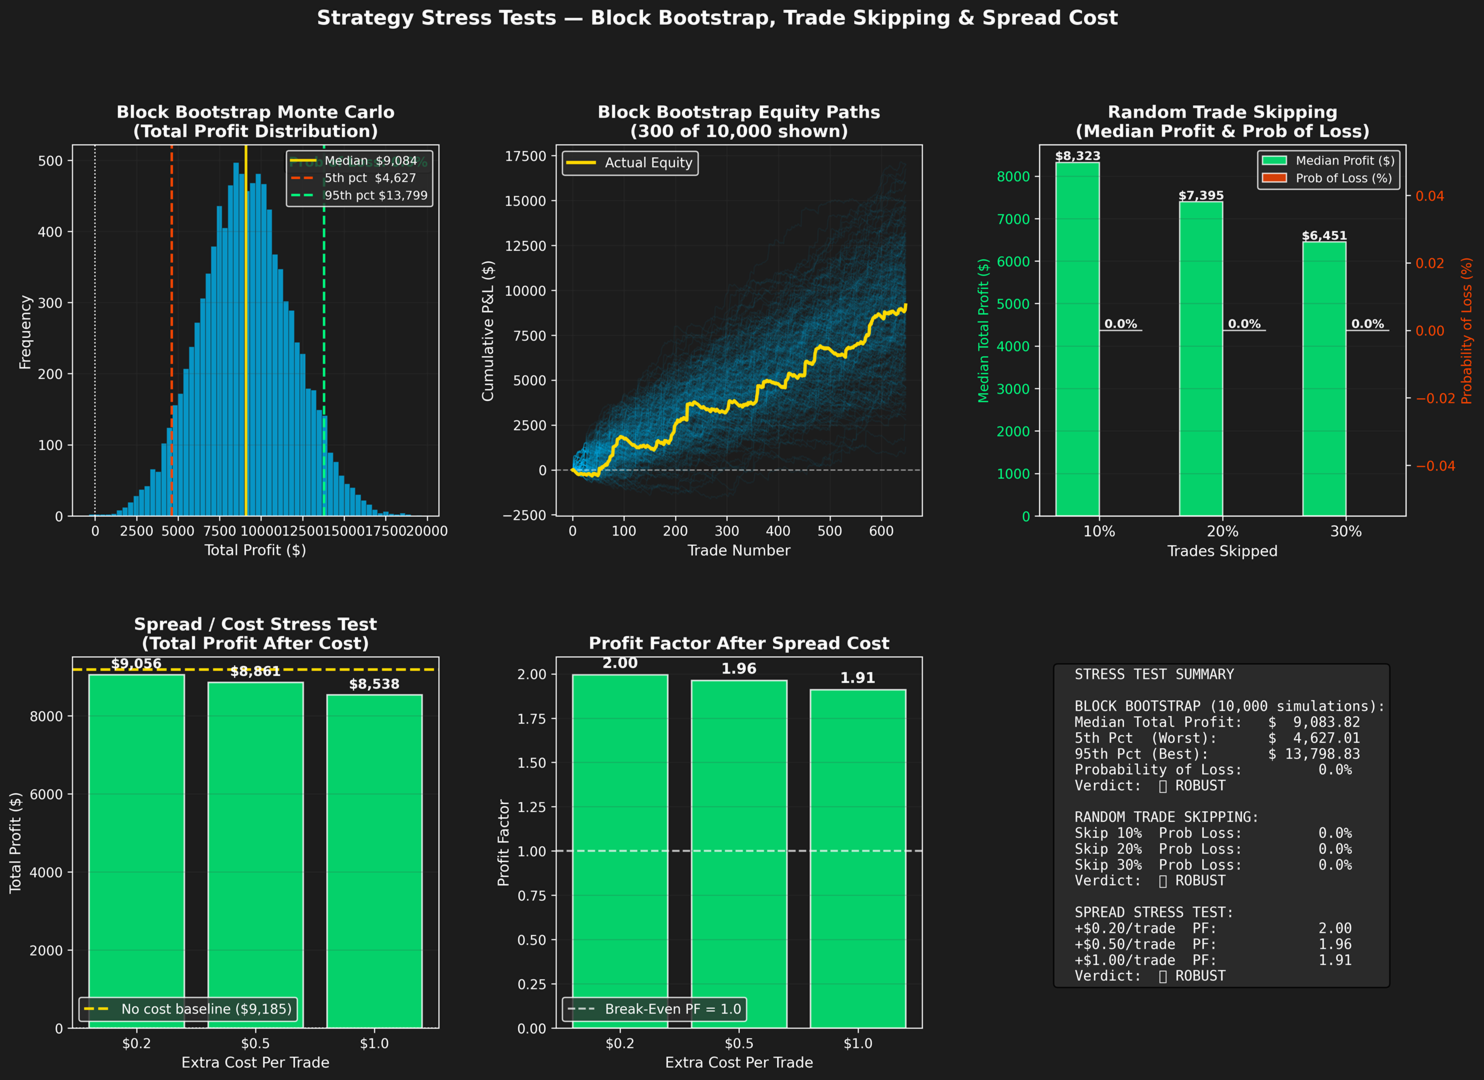
OUT-OF-SAMPLE BREAKDOWN — TOTAL (Actual & VaR-Based Expectations)
================================================================================
PERIOD ACTUAL BEST ACTUAL WORST ACTUAL MEAN BOOT MEAN BOOT MEDIAN VaR BEST(95%) VaR WORST(5%)
---------- -------------- -------------- -------------- -------------- -------------- -------------- --------------
Daily $ 616.30 $ -117.16 $ 30.50 $ 34.16 $ 9.50 $ 301.23 $ -58.32
Weekly $ 692.59 $ -143.48 $ 56.64 $ 53.41 $ 17.61 $ 371.70 $ -85.17
Monthly $ 1,031.74 $ -236.45 $ 1 89.62 $ 191.35 $ 125.70 $ 713.41 $ -131.38
================================================================================
PER-INSTRUMENT BREAKDOWN
================================================================================
──────────────────────────────────────────────────────────────────────
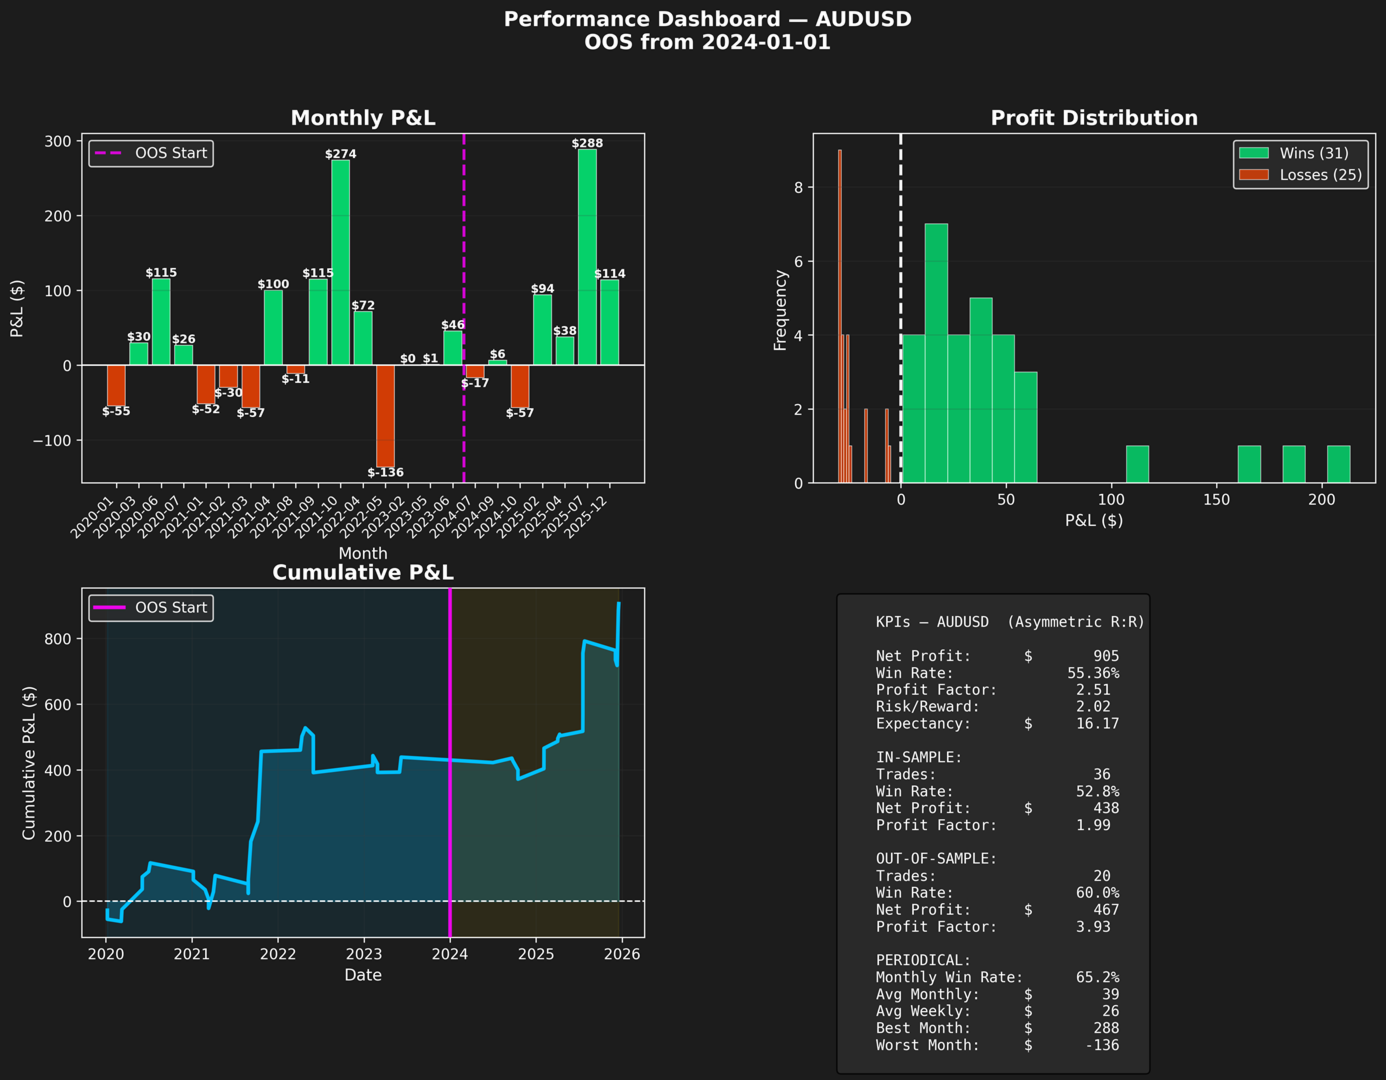
INSTRUMENT: AUDUSD
──────────────────────────────────────────────────────────────────────
Period: 2171 days (2020-01-07 → 2025-12-17)
Total Trades: 56 (IS: 36 | OOS: 20)
Net Profit: $905.28
Win Rate (Overall): 55.36%
Profit Factor: 2.51
Avg Win: $48.57 | Avg Loss: $-24.02
Risk/Reward Ratio: 2.02
Expectancy per Trade: $16.17
Largest Win: $213.39 | Largest Loss: $-29.58
Max Consec. Wins: 8 | Max Consec. Losses: 5
Best Month: $288.42 | Worst Month: $-136.12
Avg Monthly Return: $39.36 | Monthly Win Rate: 65.2%
In-Sample Trades: 36 | WR: 52.8% | PF: 1.99 | Net: $438.38
Out-of-Sample Trades: 20 | WR: 60.0% | PF: 3.93 | Net: $466.90
OOS P&L Summary:
Best Day: $251.50 | Worst Day: $-57.28 | Avg Day: $33.35
Best Week: $251.50 | Worst Week: $-57.28 | Avg Week: $38.91
Best Month: $288.42 | Worst Month: $-56.64 | Avg Month: $66.70
──────────────────────────────────────────────────────────────────────
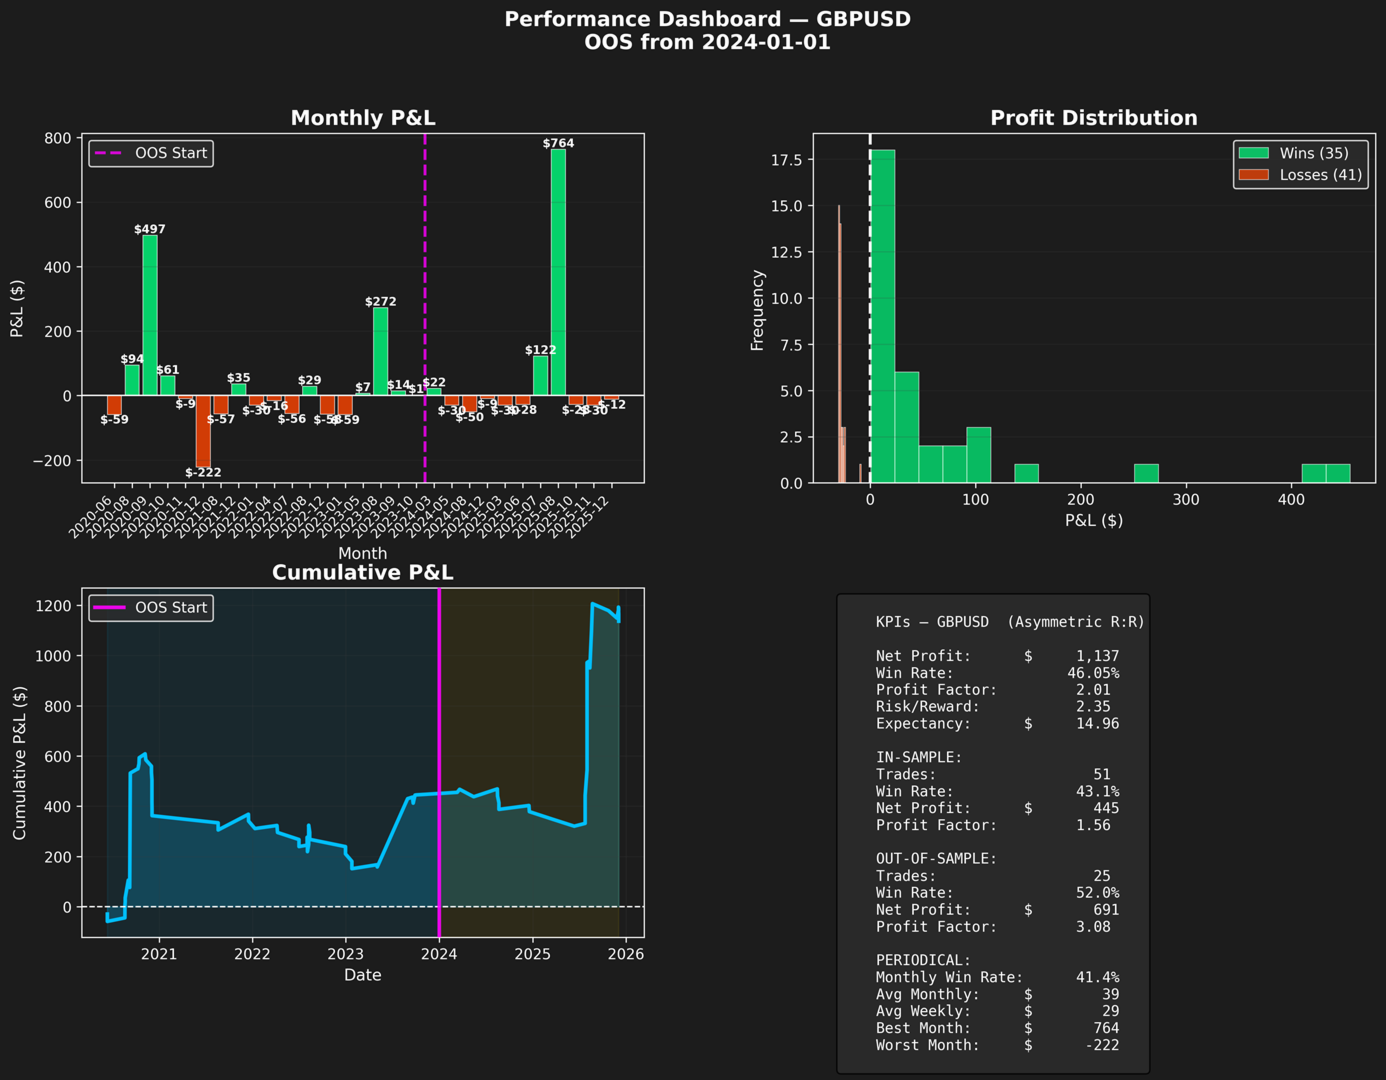
INSTRUMENT: GBPUSD
──────────────────────────────────────────────────────────────────────
Period: 2000 days (2020-06-11 → 2025-12-03)
Total Trades: 76 (IS: 51 | OOS: 25)
Net Profit: $1,136.60
Win Rate (Overall): 46.05%
Profit Factor: 2.01
Avg Win: $64.71 | Avg Loss: $-27.52
Risk/Reward Ratio: 2.35
Expectancy per Trade: $14.96
Largest Win: $455.50 | Largest Loss: $-29.92
Max Consec. Wins: 6 | Max Consec. Losses: 11
Best Month: $763.92 | Worst Month: $-221.76
Avg Monthly Return: $39.19 | Monthly Win Rate: 41.4%
In-Sample Trades: 51 | WR: 43.1% | PF: 1.56 | Net: $445.11
Out-of-Sample Trades: 25 | WR: 52.0% | PF: 3.08 | Net: $691.49
OOS P&L Summary:
Best Day: $529.38 | Worst Day: $-56.04 | Avg Day: $34.57
Best Week: $529.38 | Worst Week: $-52.80 | Avg Week: $43.22
Best Month: $763.92 | Worst Month: $-50.28 | Avg Month: $62.86
──────────────────────────────────────────────────────────────────────
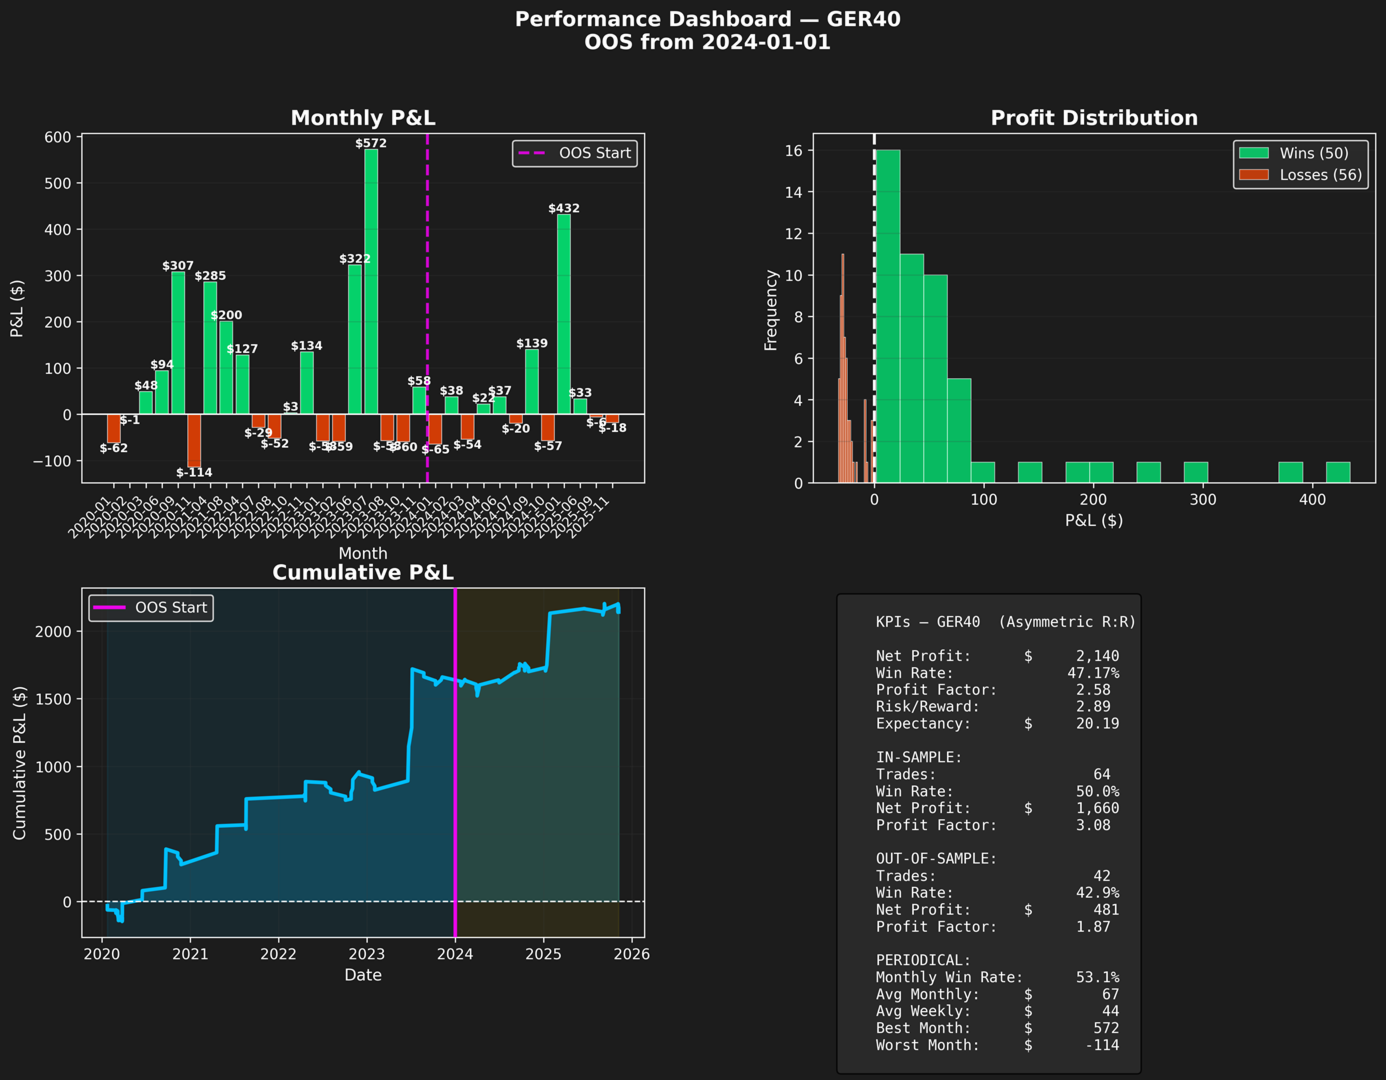
INSTRUMENT: GER40
──────────────────────────────────────────────────────────────────────
Period: 2114 days (2020-01-23 → 2025-11-07)
Total Trades: 106 (IS: 64 | OOS: 42)
Net Profit: $2,140.37
Win Rate (Overall): 47.17%
Profit Factor: 2.58
Avg Win: $69.87 | Avg Loss: $-24.16
Risk/Reward Ratio: 2.89
Expectancy per Trade: $20.19
Largest Win: $434.03 | Largest Loss: $-32.48
Max Consec. Wins: 6 | Max Consec. Losses: 6
Best Month: $572.32 | Worst Month: $-114.30
Avg Monthly Return: $66.89 | Monthly Win Rate: 53.1%
In-Sample Trades: 64 | WR: 50.0% | PF: 3.08 | Net: $1,659.73
Out-of-Sample Trades: 42 | WR: 42.9% | PF: 1.87 | Net: $480.64
OOS P&L Summary:
Best Day: $383.80 | Worst Day: $-64.96 | Avg Day: $17.80
Best Week: $383.80 | Worst Week: $-64.96 | Avg Week: $24.03
Best Month: $431.58 | Worst Month: $-64.96 | Avg Month: $40.05
──────────────────────────────────────────────────────────────────────
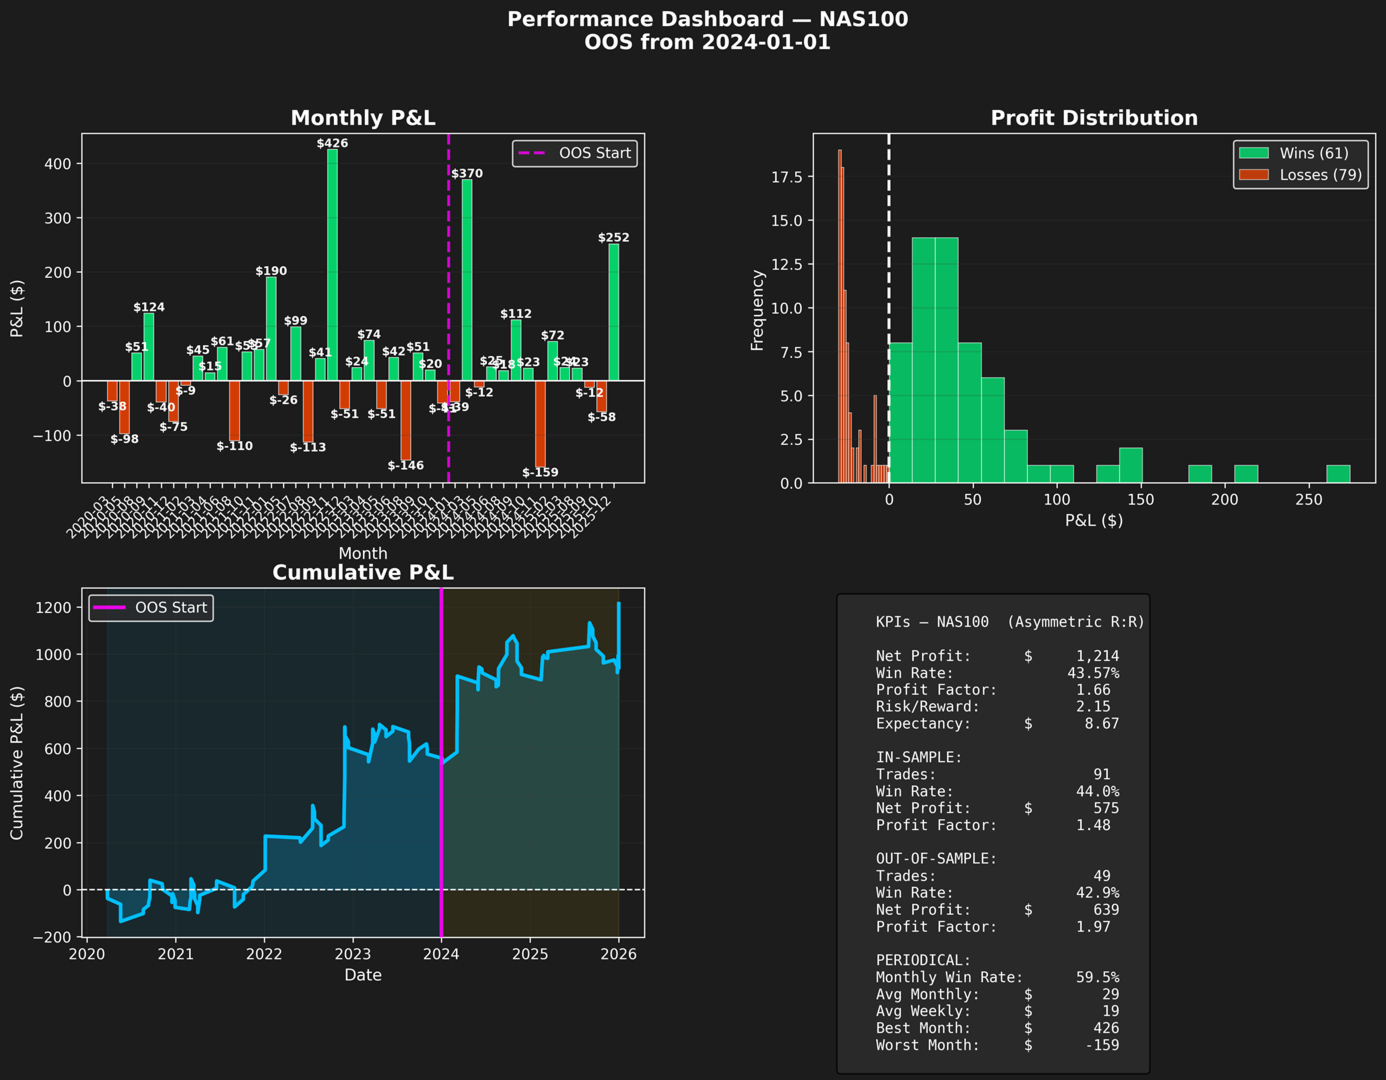
INSTRUMENT: NAS100
──────────────────────────────────────────────────────────────────────
Period: 2107 days (2020-03-25 → 2025-12-31)
Total Trades: 140 (IS: 91 | OOS: 49)
Net Profit: $1,213.84
Win Rate (Overall): 43.57%
Profit Factor: 1.66
Avg Win: $50.18 | Avg Loss: $-23.38
Risk/Reward Ratio: 2.15
Expectancy per Trade: $8.67
Largest Win: $274.44 | Largest Loss: $-29.96
Max Consec. Wins: 8 | Max Consec. Losses: 8
Best Month: $425.90 | Worst Month: $-158.96
Avg Monthly Return: $28.90 | Monthly Win Rate: 59.5%
In-Sample Trades: 91 | WR: 44.0% | PF: 1.48 | Net: $575.03
Out-of-Sample Trades: 49 | WR: 42.9% | PF: 1.97 | Net: $638.81
OOS P&L Summary:
Best Day: $271.60 | Worst Day: $-102.56 | Avg Day: $19.36
Best Week: $370.00 | Worst Week: $-102.56 | Avg Week: $26.62
Best Month: $370.00 | Worst Month: $-158.96 | Avg Month: $45.63
──────────────────────────────────────────────────────────────────────
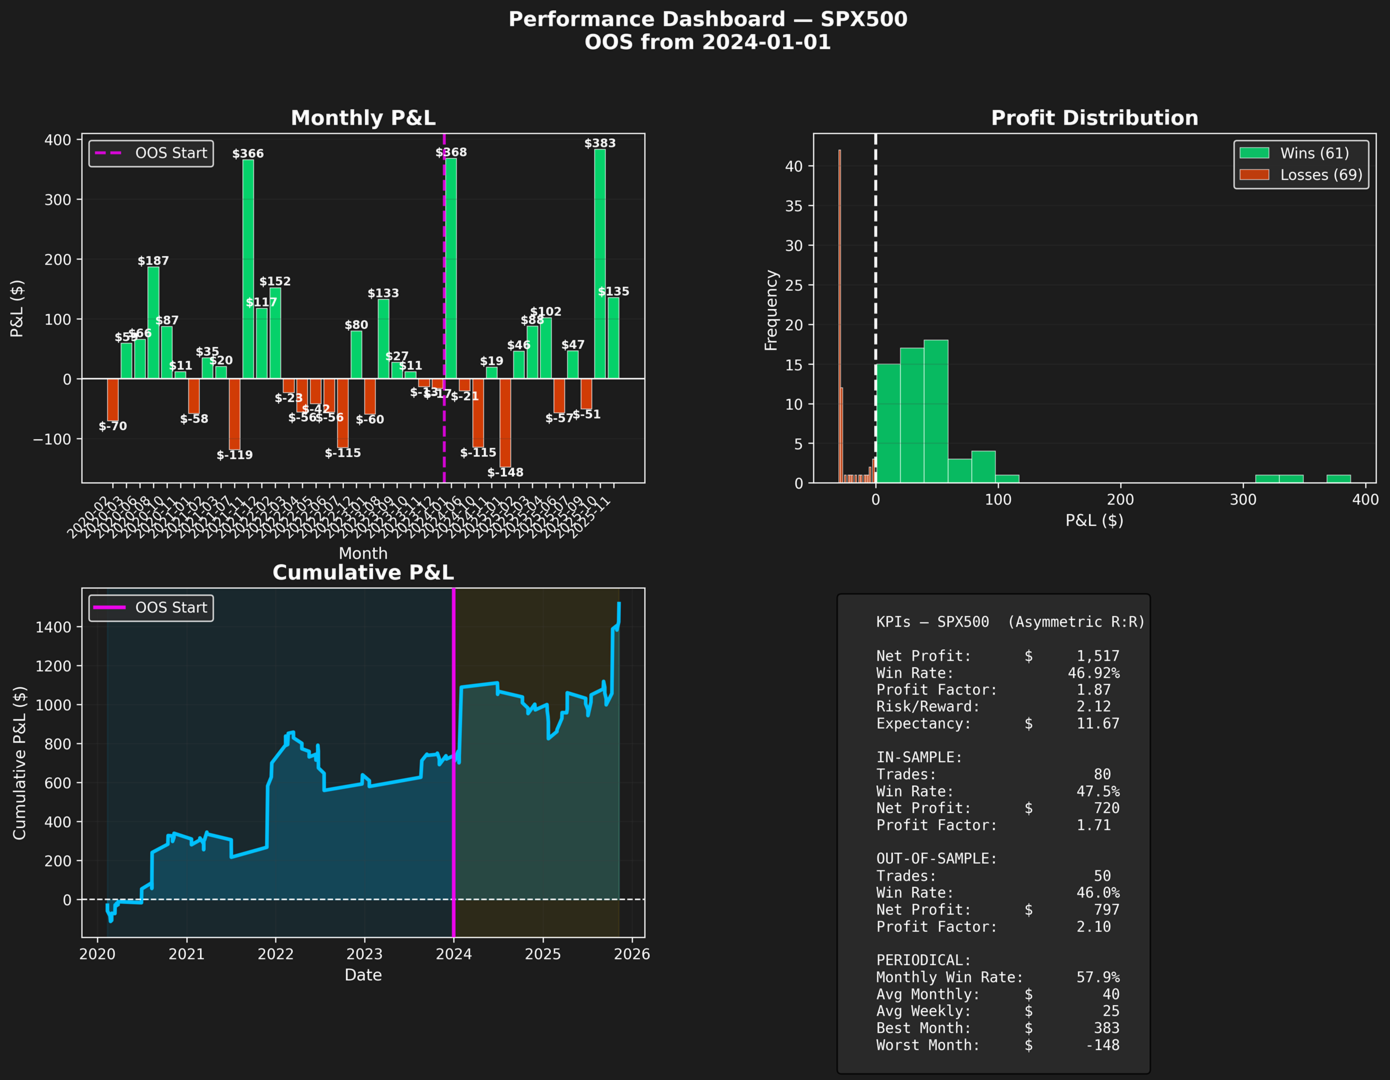
INSTRUMENT: SPX500
──────────────────────────────────────────────────────────────────────
Period: 2096 days (2020-02-11 → 2025-11-07)
Total Trades: 130 (IS: 80 | OOS: 50)
Net Profit: $1,517.07
Win Rate (Overall): 46.92%
Profit Factor: 1.87
Avg Win: $53.34 | Avg Loss: $-25.17
Risk/Reward Ratio: 2.12
Expectancy per Trade: $11.67
Largest Win: $387.60 | Largest Loss: $-30.00
Max Consec. Wins: 6 | Max Consec. Losses: 8
Best Month: $383.24 | Worst Month: $-147.70
Avg Monthly Return: $39.92 | Monthly Win Rate: 57.9%
In-Sample Trades: 80 | WR: 47.5% | PF: 1.71 | Net: $720.46
Out-of-Sample Trades: 50 | WR: 46.0% | PF: 2.10 | Net: $796.61
OOS P&L Summary:
Best Day: $387.60 | Worst Day: $-114.60 | Avg Day: $23.43
Best Week: $387.60 | Worst Week: $-143.48 | Avg Week: $34.64
Best Month: $383.24 | Worst Month: $-147.70 | Avg Month: $61.28
──────────────────────────────────────────────────────────────────────
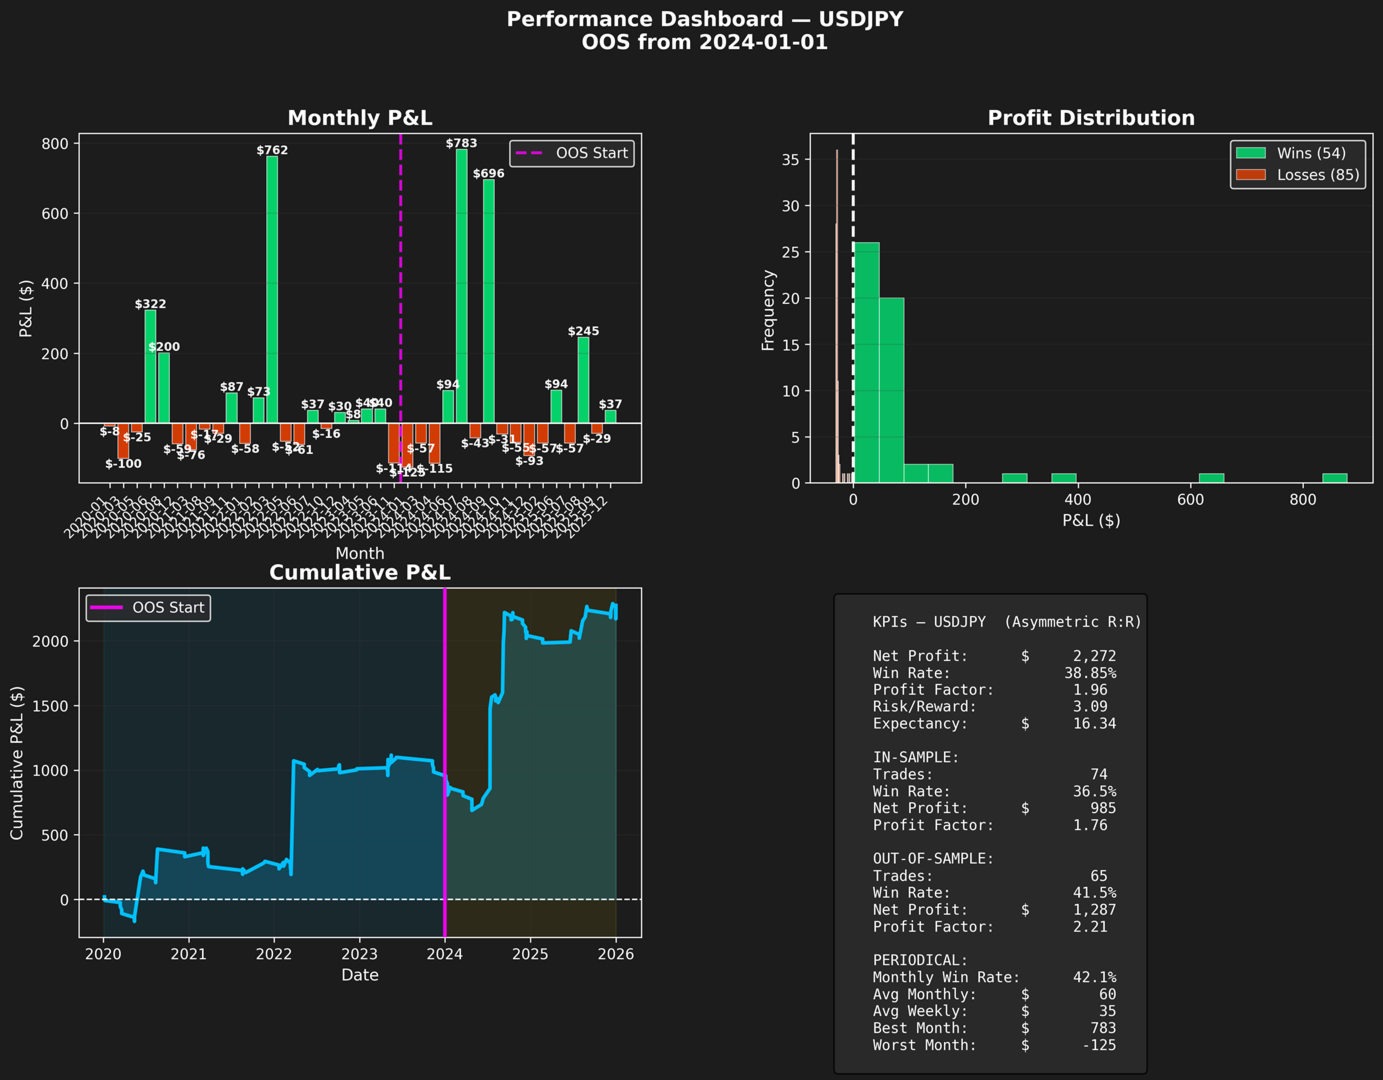
INSTRUMENT: USDJPY
──────────────────────────────────────────────────────────────────────
Period: 2186 days (2020-01-06 → 2025-12-31)
Total Trades: 139 (IS: 74 | OOS: 65)
Net Profit: $2,271.81
Win Rate (Overall): 38.85%
Profit Factor: 1.96
Avg Win: $85.73 | Avg Loss: $-27.74
Risk/Reward Ratio: 3.09
Expectancy per Trade: $16.34
Largest Win: $878.67 | Largest Loss: $-30.91
Max Consec. Wins: 7 | Max Consec. Losses: 10
Best Month: $782.57 | Worst Month: $-125.31
Avg Monthly Return: $59.78 | Monthly Win Rate: 42.1%
In-Sample Trades: 74 | WR: 36.5% | PF: 1.76 | Net: $984.94
Out-of-Sample Trades: 65 | WR: 41.5% | PF: 2.21 | Net: $1,286.87
OOS P&L Summary:
Best Day: $616.30 | Worst Day: $-117.16 | Avg Day: $33.00
Best Week: $692.59 | Worst Week: $-117.16 | Avg Week: $42.90
Best Month: $782.57 | Worst Month: $-125.31 | Avg Month: $80.43