Trading Chaos Chart

5

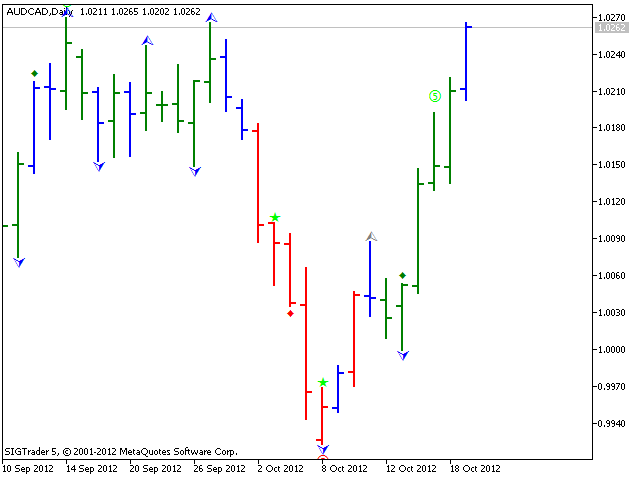
O principal objetivo do indicador é detectar e marcar no gráfico os seguintes sinais de negociação descritos em "Trading Chaos (2-nd edition)":

  1. Divergência nas barras de alta e baixa com angulação (incluindo o squat).
  2. Barras nas zonas em vermelho e verde de acordo com a cor do histograma Awesome Oscillator.
  3. Barras Squat no gráfico são independente da cor do histograma Awesome Oscillator.
  4. Níveis de fractais "importantes" em relação à "linha dos Dentes" do indicador Alligator.
  5. Desenha raios de angulação da linha de balanço para uma barra de reversão com angulação.
  6. Sinais do Second Wise Man (segundo homem sábio) com um símbolo Azul Claro Especial.
  7. Os sinais da "quinta barra consequente na zona" do indicador Awesome Oscillator.

O indicador inclui as funções básicas do indicador New Trading Dimensions Chart, conforme o seguinte:

  • Detecta e indica no gráfico os sinais gerados quando a linha do histograma cruza o nível zero, bem como os sinais em símbolos Azul Claro Especial formados pela intersecção da mesma.
  • Colore barras para três zonas (vermelho, verde, cinza), detectando as barras Squat.
  • Alterna para as funções do New Trading Dimensions Chart, definindo como TRUE (verdadeiro) os valores para o parâmetro de entrada Use new trading dimensions colors.

O indicador é desenvolvido para MetaTrader 5 de acordo com a estratégia descrita por B. Williams.
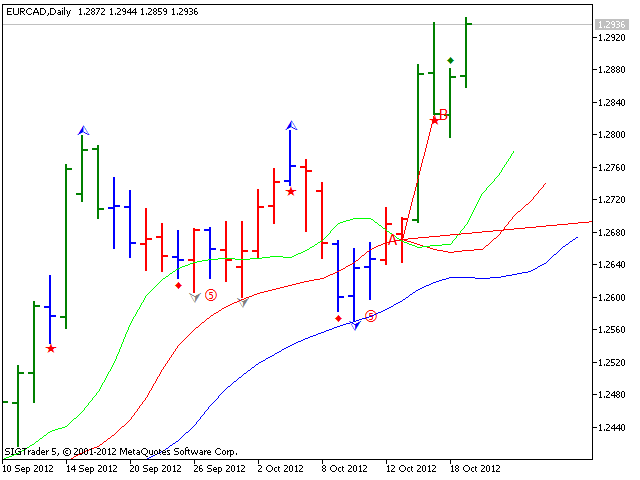
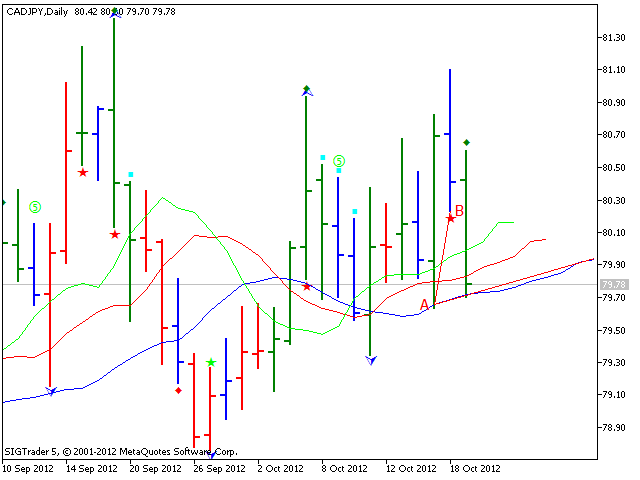
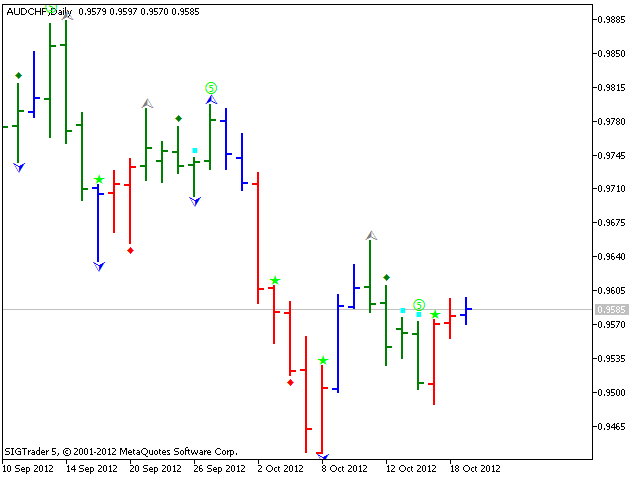
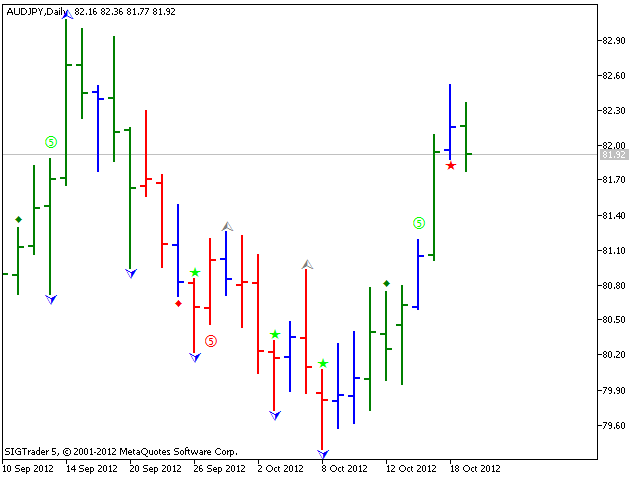
Legenda:

  • Barra azul - barra squat.
  • Estrela vermelha ou verde sobre uma barra - a barra apresenta sinais de barra divergente de "reversão" (BDB).
  • Lozango vermelho ou verde - o sinal do "Second Wise Man" (segundo homem sábio).
  • Quadrado vermelho ou verde - "Second Wise Man", sendo um forte sinal no símbolo "Azul Claro Especial".
  • Barra vermelha em qualquer direção - a barra está na zona do momento negativo.
  • Barra verde em qualquer direção - a barra está na zona do momento positivo.

O indicador inclui um bloco de sinal que informa ao trader sobre novos sinais de forma prática.

Este indicador é parte de uma integral negociação complexa . Ele forma um padrão de acordo com a estratégia descrita em "Trading Chaos 2". Recomenda-se usar o indicador, juntamente com os seguintes softwares:

Comentários 2
argo17
25
argo17 2020.11.11 12:27 
 

Классный продукт, на 5 баллов

Produtos recomendados
RBreaker
Zhong Long Wu
RBreaker Gold Indicators é uma estratégia de negociação intradiária de curto prazo para futuros de ouro que combina duas abordagens: o seguimento de tendência e as reversões intradiárias. Ela permite capturar lucros durante mercados em tendência e também realizar lucros oportunamente e operar na direção oposta quando o mercado se reverte. Esta estratégia foi classificada por 15 anos consecutivos entre as dez estratégias de negociação mais lucrativas pela revista americana Futures Truth. Ela pos
Noize Absorption Index - is the manual trading system that measures the difference of pressure between bears forces and bulls forces. Green line - is a noize free index that showing curent situation. Zero value of index shows totally choppy/flat market.Values above zero level shows how powerfull bullish wave is and values below zero measures bearish forces.Up arrow appears on bearish market when it's ready to reverse, dn arrow appears on weak bullish market, as a result of reverse expectation.
# DRAWDOWN INDICATOR V4.0 - The Essential Tool to Master Your Trading ## Transform Your Trading with a Complete Real-Time Performance Overview In the demanding world of Forex and CFD trading, **knowing your real-time performance** isn't a luxury—it's an **absolute necessity**. The **Drawdown Indicator V4.0** is much more than a simple indicator: it's your **professional dashboard** that gives you a clear, precise, and instant view of your trading account status. --- ## Why This Indicator
Universal Soul Reaper
Pieter Gerhardus Van Zyl
Universal Soul Reaper is an atmospheric market-flow oscillator designed to interpret price behavior as a cycle of spiritual energy. Instead of reacting to raw price alone, it visualizes the state of the market’s soul —revealing when momentum is awakening, stabilizing, or fading. The indicator operates in a separate window and presents three interwoven entities: the Ectoplasmic Veil , the Spirit Boundary , and the Soul Core . Together, they form a living framework that helps traders sense pressu
"Impulses and Corrections 5" is created to help traders navigate the market situation. The indicator shows multi-time frame upward and downward "Impulses" of price movements. These impulses are the basis for determining the "Base" , which is composed of zones of corrections of price movements, as well as "Potential" zones for possible scenarios of price movement. Up and down impulses are determined based on a modified formula of Bill Williams' "Fractals" indicator. The last impulse is always "U
Pro Gold System Indicator
PEDRO JOAQUIM GONCALVES GOMES
ADVANCED FUNCTIONALITIES: Trend Score (0-100) with visual bar Intelligent signals with adjustable strength (1-10) Risk management with automatic TP/SL Audible and visual alerts Price zones with smooth filling Multi-indicator analysis (RSI, ATR, BB, EMAs) DESIGN FEATURES Modern Visual: Smooth and well-spaced lines (EMA with 2-3px width) Vibrant and professional colors (Sky Blue, Orange, Gold) Modern arrows (code 233/234) for buy/sell signals Configurable dark/light theme Adjustable transparency f
O nível Premium é um indicador único com mais de 80% de precisão nas previsões corretas! Este indicador foi testado pelos melhores Especialistas em Negociação por mais de dois meses! O indicador do autor você não encontrará em nenhum outro lugar! A partir das imagens você pode ver por si mesmo a precisão desta ferramenta! 1 é ótimo para negociar opções binárias com um tempo de expiração de 1 vela. 2 funciona em todos os pares de moedas, ações, commodities, criptomoedas Instruções: Assim
CosmiCLab SMC FIBO CosmiCLab SMC FIBO is a professional trading indicator designed for traders who use Smart Money Concepts (SMC), market structure analysis and Fibonacci retracement levels. The indicator automatically detects market swings and builds Fibonacci levels based on the latest impulse movement. It also identifies market structure changes such as BOS (Break of Structure) and CHOCH (Change of Character), helping traders understand the current market direction. CosmiCLab SMC FIBO also pr
O indicador SMC Venom Model BPR é uma ferramenta profissional para os traders que trabalham com o conceito Smart Money (SMC). Identifica automaticamente dois padrões principais no gráfico de preços: FVG   (Fair Value Gap) é uma combinação de três velas, em que existe um gap entre a primeira e a terceira velas. Forma uma zona entre níveis onde não há suporte de volume, o que geralmente leva a uma correção de preço. BPR   (Balanced Price Range) é uma combinação de dois padrões FVG que formam uma
STRICTLY FOR BOOM INDEX ONLY!!!!! Here I bring the Maximum Trend Arrows OT1.0 MT5 indicator. This indicator is made up of a combination of different trend indicators for entries and exits, for entries an orange arrow will paint on the chart below the current market and a red flag for closing of trades and it produces buy arrows only. When the orange arrow appears, it will appear along with it's sound to notify you. The 1H timeframe is recommended, don't use it anywhere else than on the 1H timefr
HMA Trend Professional MT5
Pavel Zamoshnikov
4.25 (4)
Improved version of the free HMA Trend indicator (for MetaTrader 4) with statistical analysis. HMA Trend is a trend indicator based on the Hull Moving Average (HMA) with two periods. HMA with a slow period identifies the trend, while HMA with a fast period determines the short-term movements and signals in the trend direction. The main differences from the free version: Ability to predict the probability of a trend reversal using analysis of history data. Plotting statistical charts for analyzi
Volume Profile V6
Andrey Kolesnik
4.67 (3)
Indicador de perfil de volume de mercado + oscilador inteligente. Funciona em praticamente todos os instrumentos — pares de moedas, ações, futuros, criptomoedas, tanto em volumes reais quanto em ticks. É possível configurar a definição automática do intervalo de construção do perfil (por exemplo, por uma semana ou um mês, etc.), bem como definir o intervalo manualmente movendo os limites (duas linhas verticais: vermelha e azul). É exibido na forma de um histograma. A largura do histograma em um
Nova AC Trader is a modern automation of the Accelerator Oscillator (AC) — a Bill Williams momentum tool designed to detect shifts in market acceleration before trends fully form. This EA transforms the indicator’s early-warning nature into a structured trading system that reacts only when momentum changes are clear and consistent. Instead of waiting for the trend to be obvious, Nova AC Trader identifies when market acceleration starts to turn — offering opportunities at the earliest stage of mo
Buy CTS scalping indicator, provide buying and selling signals, automatic channeling and sending signals to mobile phones Using technical analysis and price action methods and modern methods, CTS indicator can draw price channels and recognize price trends with high accuracy and issue entry and exit signals according to them. Traders can easily fluctuate using this indicator in different time frames and in different markets. With the CTS indicator, you can signal in different ways. This indicato
Schaff Trend Cycle STC
Mohammad Taher Halimi Tabrizi
The Schaff Trend Cycle indicator is the product of combining Slow Stochastics and the moving average convergence/divergence (MACD). The MACD has a reputation as a trend indicator, but it's also notorious for lagging due to its slow responsive signal line. The improved signal line gives the STC its relevance as an early warning sign to detect currency trends. this indicator is converted from Trading View code of STC Indicator - A Better MACD [SHK]
MercariaPattern1-2-3 відстежує рух ціни, знаходить трьоххвильові структури 1-2-3 та підсвічує момент, коли сценарій підтверджується пробоєм ключового рівня. MercariaPattern1-2-3 tracks price movement, detects three-leg 1-2-3 structures and highlights the moment when the scenario is confirmed by a key level breakout. Індикатор збирає локальні свінги в компактну фігуру 0–1–2–3 , чекає підтвердженого пробою та будує стрілку входу з готовими рівнями SL/TP. The indicator combines local swings into a
Difícil de encontrar e com pouca frequência, as divergências são um dos cenários de negociação mais confiáveis. Este indicador localiza e verifica automaticamente divergências ocultas e regulares usando seu oscilador favorito. [ Guia de instalação | Guia de atualização | Solução de problemas | FAQ | Todos os produtos ] Fácil de trocar Encontra divergências regulares e ocultas Suporta muitos osciladores conhecidos Implementa sinais de negociação baseados em fugas Exibe níveis adequados de sto
Price Magnet — Price Density and Attraction Levels Indicator Price Magnet is a professional analytical tool designed to identify key support and resistance levels based on statistical Price Density. The indicator analyzes a specified historical period and detects price levels where the market spent the most time. These zones act as “magnets,” attracting price action or forming a structural base for potential reversals. Unlike traditional Volume Profile tools, Price Magnet focuses on price-time d
An indicator for accurately determining price reversal points on all timeframes and all currency pairs. With the help of technical analysis of the market and mathematical diagnostic models, this indicator determines the price reversal points and the current trend direction with great efficiency. The indicator displays this information on the chart in the form of arrows and lines. The arrows show the trend reversal points and the lines show the current trend direction. INDICATOR trades in real t
The Trend Duration Forecast MT5 indicator is designed to estimate the probable lifespan of a bullish or bearish trend. Using a Hull Moving Average (HMA) to detect directional shifts, it tracks the duration of each historical trend and calculates an average to forecast how long the current trend is statistically likely to continue. This allows traders to visualize both real-time trend strength and potential exhaustion zones with exceptional clarity. KEY FEATURES Dynamic Trend Detection:   Utiliz
Prime Power ML é um Currency Strength Meter avançado com dois modelos de redes neurais ONNX que filtram sinais por probabilidade de ganho antes de exibi-los. Ao contrário dos indicadores CSM tradicionais que mostram cada divergência entre moedas, o Prime Power ML destaca apenas os sinais onde a AI confirma uma vantagem estatística. Como funciona O indicador calcula em tempo real a força de 8 moedas principais (USD, EUR, GBP, JPY, AUD, CAD, CHF, NZD) usando pontuação RSI em todos os 28 pares. Qua
Rainbow EA MT5
Jamal El Alama
Description : Rainbow EA MT5 is a simple Expert advisor based on   Rainbow MT5 indicator witch is based on Moving average with period 34. The indicator is incorporated in the EA, therefore, it is not required for the EA to operate, but if you wish, you can download it from   my product page . The Expert Advisor settings are as follows : Suitable for Timeframes up to H1 The parameters below can be set according to your trading rules. StopLoss ( Stop Loss in pips) TakeProfit ( Take Profit in pips
Stochastic R
Antony Augustine
Stochastic  Reversal  allows you to recognize reversals professionally. Stochastic Indicator: This technical indicator was developed by George Lane more than 50 years ago. The reason why this indicator survived for so many years is because it continues to show consistent signals even in these current times. The Stochastic indicator is a momentum indicator that shows you how strong or weak the current trend is. It helps you identify overbought and oversold market conditions within a trend.  Rules
##   ONLY GOLD ##   Тiльки Золото ## **Mercaria Professional Trading Zones - Complete Guide** ## **Mercaria Professional Trading Zones - Повний посібник** ### **How Mercaria Zones Work / Як працюють зони Mercaria** **English:** Mercaria Zones is an advanced trading indicator that identifies high-probability support and resistance areas using ZigZag extremes combined with mathematical zone calculations. The indicator works on multiple timeframes simultaneously, providing a comprehensive view
Antes de tudo, vale ressaltar que esta Ferramenta de Negociação é um Indicador Não Repintante, Não Redesenhante e Não Atrasado, o que a torna ideal para negociação profissional. Curso online, manual do utilizador e demonstração. O Indicador de Conceitos de Ação de Preço Inteligente é uma ferramenta muito poderosa tanto para traders novos quanto experientes. Ele combina mais de 20 indicadores úteis em um único, combinando ideias avançadas de negociação como Análise do Trader do Círculo Interno
Master Edition
Peter Ofunda Fischer
Harvester Pro Universal Master The Ultimate Volatility Breakout & Trend-Following Solution for XAUUSD and Major Pairs. Harvester Pro Universal Master is a professional-grade Expert Advisor (EA) engineered for high-performance trading on the MetaTrader 5 (MT5) platform. Optimized specifically for XAUUSD (Gold) and major currency pairs like EURUSD , this EA combines a sophisticated Volatility Breakout engine with a robust EMA/TEMA Trend-Following filter to capture explosive market moves with surg
Este é sem dúvida o indicador de reconhecimento automático de formação de preço harmônico mais completo que você pode encontrar para a MetaTrader Platform. Ele detecta 19 padrões diferentes, leva as projeções de Fibonacci tão a sério quanto você, exibe a Zona de Reversão Potencial (PRZ) e encontra níveis adequados de stop loss e take-profit. [ Guia de instalação | Guia de atualização | Solução de problemas | FAQ | Todos os produtos ] Detecta 19 formações harmônicas de preços diferentes Traça
The RSI Divergence + FVG Signal indicator combines Relative Strength Index (RSI) Divergence with Fair Value Gap (FVG) detection to generate high-probability buy and sell signals based on both momentum shifts and institutional imbalance zones. Core Features: RSI Divergence Detection : Identifies both regular and hidden bullish/bearish divergences between price and RSI. Divergences indicate potential trend reversals or continuation. FVG Zone Recognition : Detects Fair Value Gaps (imbalances caused
Indicador Crypto_Forex Padrão PINBAR para MT5, sem repintura, sem atraso. - O indicador "Padrão PINBAR" é um indicador muito poderoso para negociação de Price Action. - O indicador detecta PinBars no gráfico: - PinBar de alta - Sinal de seta azul no gráfico (veja as imagens). - PinBar de baixa - Sinal de seta vermelha no gráfico (veja as imagens). -   Com alertas para PC e dispositivos móveis . - O indicador "Padrão PINBAR" é excelente para combinar com níveis de suporte/resistência. Clique a
TRI Visualizer
Yoshimi Mon 三 Ura
TRI Visualizer MT5 – Thermodynamic Market Analysis Overview The TRI (Thermal Range Indicator) Visualizer Enhanced is a rare market analysis indicator that goes beyond conventional technical analysis, applying principles of thermodynamics from physics. It interprets market price fluctuations as “thermodynamic energy,” enabling the highly accurate detection of subtle market changes that are often overlooked. Innovative Mechanisms 1. Dual Calculation Engines Classic TRI Mode Formula: |Close
Os compradores deste produto também adquirem
Divergence Bomber
Ihor Otkydach
4.9 (86)
Cada comprador deste indicador recebe adicionalmente, e de forma gratuita: A ferramenta exclusiva "Bomber Utility", que acompanha automaticamente cada operação, define os níveis de Stop Loss e Take Profit e fecha operações de acordo com as regras da estratégia; Arquivos de configuração (set files) para ajustar o indicador em diferentes ativos; Set files para configurar o Bomber Utility nos modos: "Risco Mínimo", "Risco Balanceado" e "Estratégia de Espera"; Um vídeo tutorial passo a passo que aju
Azimuth Pro
Ottaviano De Cicco
5 (6)
Azimuth Pro V2: Estrutura Fractal Sintética e Entradas Confirmadas para MT5 Visão geral Azimuth Pro é um indicador de estrutura swing multinível da Merkava Labs . Quatro camadas de swing aninhadas, VWAP ancorado em swings, detecção de padrões ABC, filtragem estrutural de três timeframes e entradas confirmadas em barra fechada — um gráfico, um fluxo de trabalho dos micro-swings aos macro-ciclos. Este não é um produto de sinais cegos. É um fluxo de trabalho baseado em estrutura para traders que v
Quantum TrendPulse
Bogdan Ion Puscasu
5 (23)
Apresentando   Quantum TrendPulse   , a ferramenta de negociação definitiva que combina o poder do   SuperTrend   ,   RSI   e   Stochastic   em um indicador abrangente para maximizar seu potencial de negociação. Projetado para traders que buscam precisão e eficiência, este indicador ajuda você a identificar tendências de mercado, mudanças de momentum e pontos de entrada e saída ideais com confiança. Principais características: Integração SuperTrend:   siga facilmente a tendência predominante do
OmniSync Projection
Antonio-alin Teculescu
5 (1)
Chronos Fractal Engine is an innovative price projection indicator for MetaTrader 5, designed to transform your technical analysis by intelligently identifying and projecting historical price patterns. Built upon an advanced correlation algorithm and the fractal principles of the market, this powerful tool visualizes potential future price movements, giving you a unique edge in your trading decisions. What is Chronos Fractal Engine? At its core, the Chronos Fractal Engine employs a sophisticat
Apresentando       Quantum Breakout PRO   , o inovador Indicador MQL5 que está transformando a maneira como você negocia Breakout Zones! Desenvolvido por uma equipe de traders experientes com experiência comercial de mais de 13 anos,       Quantum Breakout PRO       foi projetado para impulsionar sua jornada comercial a novos patamares com sua estratégia de zona de fuga inovadora e dinâmica. O Quantum Breakout Indicator lhe dará setas de sinal em zonas de breakout com 5 zonas-alvo de lucro e su
CGE Trading Suite
Carl Gustav Johan Ekstrom
5 (2)
Institutional-Grade Analytics for MT5 C GE Trading Suite delivers the analytical edge typically reserved for professional trading desks. The platform integrates a full suite of analytical tools into one seamless workflow: dynamic grid mapping, liquidity behavior analysis, ECM, trend lines, MIDAS, trade cycles, and directional channel projections. Together, these provide a unified view of market structure and momentum. Directional clarity is further enhanced by the capital flow index, which meas
Grabber System MT5
Ihor Otkydach
4.83 (23)
Apresento a você um excelente indicador técnico: Grabber, que funciona como uma estratégia de trading “tudo incluído”, pronta para usar. Em um único código estão integradas ferramentas poderosas de análise técnica de mercado, sinais de entrada (setas), funções de alertas e notificações push. Cada comprador deste indicador também recebe gratuitamente: Utilitário Grabber: ferramenta para gerenciamento automático de ordens abertas Vídeo tutorial passo a passo: como instalar, configurar e operar com
Btmm state engine pro
Garry James Goodchild
5 (4)
BTMM State Engine Pro is a MetaTrader 5 indicator for traders who use the Beat The Market Maker approach: Asian session context, kill zone timing, level progression, peak formation detection, and a multi-pair scanner from a single chart. It combines cycle state logic with a built-in scanner dashboard so you do not need the same tool on many charts at once. What it does Draws the Asian session range; session times can follow broker server offset or be set in inputs. Tracks level progression (L
RelicusRoad Pro: Sistema Operacional Quantitativo de Mercado 70% DE DESCONTO ACESSO VITALÍCIO (TEMPO LIMITADO) - JUNTE-SE A 2.000+ TRADERS Por que a maioria dos traders falha mesmo com indicadores "perfeitos"? Porque eles operam Conceitos Únicos no vácuo. Um sinal sem contexto é uma aposta. Você precisa de CONFLUÊNCIA . RelicusRoad Pro não é um simples indicador de seta. É um Ecossistema Quantitativo de Mercado completo. Ele mapeia a "Estrada do Valor Justo", distinguindo ruído de rupturas estru
ARICoins
Temirlan Kdyrkhan
ARICoin is a powerful trading companion designed to generate high-probability entry signals with dynamic TP/SL/DP levels based on volatility. Built-in performance tracking shows win/loss stats, PP1/PP2 hits, and success rates all updated live. Key Features: Buy/Sell signals with adaptive volatility bands Real-time TP/SL/DP levels based on ATR Built-in MA Filter with optional ATR/StdDev volatility Performance stats panel (Success, Profit/Loss, PP1/PP2) Alerts via popup, sound, push, or email Cust
ARIPoint
Temirlan Kdyrkhan
ARIPoint is a powerful trading companion designed to generate high-probability entry signals with dynamic TP/SL/DP levels based on volatility. Built-in performance tracking shows win/loss stats, PP1/PP2 hits, and success rates all updated live. Key Features: Buy/Sell signals with adaptive volatility bands Real-time TP/SL/DP levels based on ATR Built-in MA Filter with optional ATR/StdDev volatility Performance stats panel (Success, Profit/Loss, PP1/PP2) Alerts via popup, sound, push, or email Cu
ICT PO3 (Power of 3) AMD Protocol Framework Indicator True Time & Structure Integration   |  Non-Repainting | Real-Time  | Multi-Asset  | MT4 Version Available Full Setup Guide & Strategy Playbook: https://www.mql5.com/en/blogs/post/768683 MT4 Version: https://www.mql5.com/en/market/product/171742 Indicator Overview The ICT PO3 AMD Protocol Framework is a complete structural overlay for MetaTrader 5 that maps the True Daily Cycle directly onto your lower-timeframe execution chart. It projects
Gartley Hunter Multi
Siarhei Vashchylka
5 (11)
Gartley Hunter Multi - An indicator for searching for harmonic patterns simultaneously on dozens of trading instruments and on all possible timeframes. Manual (Be sure to read before purchasing) | Version for MT4 Advantages 1. Patterns: Gartley, Butterfly, Shark, Crab. Bat, Alternate Bat, Deep Crab, Cypher 2. Simultaneous search for patterns on dozens of trading instruments and on all possible timeframes 3. Search for patterns of all possible sizes. From the smallest to the largest 4. All fou
Bill Williams Advanced
Siarhei Vashchylka
5 (11)
Bill Williams Advanced is designed for automatic chart analysis using Bill Williams' "Profitunity" system. The indicator analyzes four timeframes at once. Manual (Be sure to read before purchasing) Advantages 1. Analyzes the chart using Bill Williams' "Profitunity" system. Signals are displayed in a table in the corner of the screen and on the price chart. 2. Finds all known AO and AC signals, as well as zone signals. Equipped with a trend filter based on the Alligator. 3. Finds "Divergence Bar
TPA True Price Action indicator reveals the true price action of the market makers through 100% non-repainting signals strictly at the close of a candle! TPA shows entries and re-entries, every time the bulls are definitely stronger than the bears and vice versa. Not to confuse with red/green candles. The shift of power gets confirmed at the earliest stage and is ONE exit strategy of several. There are available now two free parts of the TPA User Guide for our customers. The first "The Basics"
AriX
Temirlan Kdyrkhan
1 (4)
AriX Indicator for MT5 A powerful trend-following and signal-evaluation tool AriX is a custom MT5 indicator that combines Moving Averages and ATR-based risk/reward logic to generate clear buy/sell signals. It visualizes dynamic SL/TP levels, evaluates past trade outcomes, and displays win/loss statistics in a clean on-chart panel. Key features include: Buy/Sell signals based on MA crossovers ATR-based SL/TP1/TP2/TP3 levels with visual lines and labels Signal outcome tracking with real-time stat
Advanced Supply Demand MT5
Bernhard Schweigert
4.53 (15)
Atualmente com 33% de desconto! A melhor solução para qualquer Trader Novato ou especialista! Este indicador é uma ferramenta de negociação exclusiva, de alta qualidade e acessível porque incorporamos uma série de recursos proprietários e uma nova fórmula. Com esta atualização, você poderá mostrar fusos horários duplos. Você não só será capaz de mostrar um TF mais alto, mas também mostrar ambos, o TF do gráfico, MAIS o TF mais alto: MOSTRANDO ZONAS ANINHADAS. Todos os traders de Oferta e Demanda
Meravith MT5
Ivan Stefanov
5 (1)
Ferramenta dos market makers. O Meravith irá: Analisar todos os timeframes e exibir a tendência atual em vigor. Destacar zonas de liquidez (equilíbrio de volume) onde o volume comprador e vendedor é igual. Mostrar todos os níveis de liquidez de diferentes timeframes diretamente no seu gráfico. Gerar e apresentar análise de mercado em formato de texto para sua referência. Calcular alvos, níveis de suporte e pontos de stop-loss com base na tendência atual. Calcular a relação risco/retorno das suas
SignalTech MT5 is a trading system for EURUSD, USDCHF, USDJPY, AUDUSD, NZDUSD, EURJPY, AUDJPY, NZDJPY, CADJPY H2 and H3 Timeframe.  It can generate signals with Buy/Sell Arrows and Pop-Up/Sound Alerts. Each signal has clear Entry and Stop Loss levels, which should be automatically flagged on the chart, as well as potential Targets 1, 2, and 3. The Entry and TP levels are fixed after the trade is taken. The exit level is dynamic. If there are signs of a potential short-term trend reversal, the
ZIVA Signal Intelligence
Hassan Abdullah Hassan Al Balushi
ZIVA Signal Intelligence An Adaptive, Modular Market Intelligence System ZIVA Signal Intelligence is not positioned as a conventional trading indicator. It is a fully integrated, proprietary market intelligence system engineered to deliver structured, high-precision interpretation of price behavior within a controlled analytical environment. Developed through an independent architectural approach, ZIVA does not rely on, derive from, or replicate existing indicators. It represents a standalone
PZ Swing Trading MT5
PZ TRADING SLU
5 (5)
Swing Trading é o primeiro indicador projetado para detectar oscilações na direção da tendência e possíveis oscilações de reversão. Ele usa a abordagem de negociação de linha de base, amplamente descrita na literatura de negociação. O indicador estuda vários vetores de preço e tempo para rastrear a direção da tendência agregada e detecta situações nas quais o mercado está sobrevendido ou sobrecomprado em excesso e pronto para corrigir. [ Guia de instalação | Guia de atualização | Solução de prob
Trend Forecaster
Alexey Minkov
5 (7)
12% OFF EASTER SALE The Trend Forecaster indicator utilizes a unique proprietary algorithm to determine entry points for a breakout trading strategy. The indicator identifies price clusters, analyzes price movement near levels, and provides a signal when the price breaks through a level. The Trend Forecaster indicator is suitable for all financial assets, including currencies (Forex), metals, stocks, indices, and cryptocurrencies. You can also adjust the indicator to work on any time frames, alt
FX Analysis is an all-in-one MT5 indicator dashboard that combines eight analytical tools in a single panel, helping traders identify high-probability setups without switching between charts or indicators. Designed for standard forex pairs on MetaTrader 5. Best results on M15 - H4 timeframes when all components are used together as part of the included workflow. Components Volatility Analyzer Displays historical average movement by hour and by day of the week. A real-time Pip Balance shows the
Volatility Trend System - é um sistema de negociação que fornece sinais para entradas. O sistema de volatilidade fornece sinais lineares e pontuais na direção da tendência, bem como sinais para sair dela, sem redesenhar ou atrasos. O indicador de tendência monitora a direção da tendência de médio prazo, mostra a direção e sua mudança. O indicador de sinal é baseado em mudanças na volatilidade e mostra as entradas no mercado. O indicador está equipado com diversos tipos de alertas. Pode ser apli
Easy SMC Trading
Israr Hussain Shah
3 (2)
Análise de Tendência Estrutural com Auto RR e Scanner de BOS Versão: 1.0 Visão Geral A Análise de Tendência Estrutural com Auto RR é um sistema de negociação abrangente, concebido para traders que dependem da Ação do Preço e da Estrutura de Mercado. Combina um filtro de tendência suavizado com a deteção de Pontos de Oscilação e sinais de Ruptura de Estrutura (BOS) para gerar configurações de negociação de alta probabilidade. O principal diferencial desta ferramenta é a sua Gestão de Risco Aut
Berma Bands
Muhammad Elbermawi
5 (8)
O indicador Berma Bands (BBs) é uma ferramenta valiosa para traders que buscam identificar e capitalizar tendências de mercado. Ao analisar a relação entre o preço e os BBs, os traders podem discernir se um mercado está em uma fase de tendência ou de variação. Visite o [ Blog Berma Home ] para saber mais. As Bandas de Berma são compostas por três linhas distintas: a Banda de Berma Superior, a Banda de Berma Média e a Banda de Berma Inferior. Essas linhas são plotadas em torno do preço, criando u
Ziva LSE System
Hassan Abdullah Hassan Al Balushi
ZIVA LSE System A Professional Liquidity & Structure Execution Framework Executive Overview ZIVA LSE System is a professionally engineered analytical framework designed to interpret market behavior through structural logic and liquidity dynamics. It is not positioned as a conventional indicator. Rather, it functions as a structured execution environment that organizes price action into a clear, disciplined decision-making model. The system is built to deliver consistency, clarity, and controlle
SunSignal ML — AI Gold Signals with Multi-Timeframe Confluence SunSignal ML is an advanced AI-powered signal indicator purpose-built for XAUUSD gold trading. It combines a proprietary adaptive trend algorithm with six machine learning models trained on confirmed price pivots to produce high-confidence entry signals with multi-timeframe validation. The indicator runs efficiently on M1, M5 and M15 timeframes and is designed for traders who want precision entries guided by data rather than guesswor
Weltrade Spike Sentinel
Batsirayi L Marango
5 (1)
Introducing Indicator for PainX and GainX Indices Traders on Weltrade Get ready to experience the power of trading with our indicator, specifically designed for Weltrade   broker's PainX and GainX Indices.  Advanced Strategies for Unbeatable Insights Our indicator employs sophisticated strategies to analyze market trends, pinpointing optimal entry and exit points.  Optimized for Maximum Performance To ensure optimal results, our indicator is carefully calibrated for 5-minute timeframe charts on
Este é um indicador para MT5 que fornece sinais precisos para entrar em uma negociação sem redesenhar. Ele pode ser aplicado a qualquer ativo financeiro: forex, criptomoedas, metais, ações, índices. Ele fornecerá estimativas bastante precisas e informará quando é melhor abrir e fechar um negócio. Assista o vídeo (6:22) com um exemplo de processamento de apenas um sinal que compensou o indicador! A maioria dos traders melhora seus resultados de negociação durante a primeira semana de negociação c
Mais do autor
Recognizer 1 2 3 Patterns
Gennadiy Stanilevych
4.67 (36)
tO indicador é destinado ao reconhecimento e marcação dos padrões 1-2-3 comprar e vende de um gráfico. O indicador vai ajudar um negócio para determinar o início e o sinal de fractais, e especificar os possíveis pontos de entrada em todos os tempos do МetaTrader 5. Linhas de Fibonacci são desenhados no gráfico para indicar supostos alvos de movimento sobre a base da teoria ondulatória. As formações 1-2-3 parecem ser especialmente importante como as divergências (convergências) são formados em to
FREE
O principal objetivo do indicador é determinar e marcar sinais de negociação no histograma do Accelerator Oscillator, que foram descritos por Bill Williams em seu livro "New Trading Dimensions". A lista de sinais: O sinal de compra quando o histograma do indicador está abaixo da linha zero. O sinal de venda quando o histograma do indicador está abaixo da linha zero. O sinal de venda quando o histograma do indicador está acima da linha de zero. O sinal de compra quando o histograma do indicador e
FREE
Purpose and functions of the indicator The indicator determines and marks the moments of trend change on the chart based on the theory of fractal levels breakout on any of the analyzed timeframes. If a breakout based on all rules is valid, a horizontal line with corresponding color will appear on the chart. If there is an uptrend, the line will be blue. In the descending trend, the line will be red. The blue line is a strong support level, the trader should look for buying opportunities above th
FREE
Stairway
Gennadiy Stanilevych
4.75 (4)
The multi-timeframe indicator of the levels of the Pivot Points. Every closed daily period has its own so-called reference point - Pivot Point, which sets the levels for smaller intraday timeframes for the following day. The Pivot Points indicators existing in the codes have no method of showing the dynamics of the pivot point changes on the historical data of the price chart. Pivot Point calculation formula. Pivot=(High + Low + Close) /3 High — the maximum of the previous day; Low — the minimum
FREE
The standard Bollinger Bands indicator has been improved by integrating additional indications from the Standard Deviation indicator (StdDev), which gives an additional filter for confirming trading signals. In addition, the color of the indicator's lines shows the beginning of a trend, its development and exhaustion. This indicator has a signal block that notifies the trader of the beginning of the trend on any time frame to which it is attached. Settings Type of messages - select the type of
FREE
Fifth dimension
Gennadiy Stanilevych
5 (3)
The indicator looks for the "Fifth dimension" trade signals and marks them on the chart. A detailed description of the chart patterns that generate the trade signals can be found in Chapter 8 "The Balance Line Trades" in the book Williams' "New Trading Dimensions". Signal levels with indication of the position entry or stop loss placement price are indicated directly on the chart. This feature creates additional convenience for the trader when placing pending orders. A solid horizontal line is d
FREE
Trading Chaos Expert
Gennadiy Stanilevych
5 (11)
Não existe software igual no mundo e que represente um "console" universal de negociação informando sinais para operar, entrada automatizada do mercado, configurando o Stop Loss e o Take Profit, assim como o Trailling Profit para diversas negociações em apenas uma janela aberta. O controle intuitivo do Expert Advisor em "três cliques" garante um uso abrangente de todas as suas funções em diferentes computadores, incluindo tablets. Interagindo com indicadores de sinal adicionais que marcam o gráf
Spread and Swap monitor
Gennadiy Stanilevych
5 (1)
O indicador tem o objetivo de determinar o tamanho do spread e swap, a distância para configurar ordens pendentes, stop loss permitido com o preço atual e o risco por 1 ponto na moeda de depósito. O indicador informa ao trader sobre possíveis despesas e os lucros adicionais relacionados com a transferência de uma posição para a próxima sessão de negociação do instrumento financeiro. Ele também informa sobre o tamanho do spread, a distância das ordens pendentes, stop loss e o trailing stop a part
Iranger
Gennadiy Stanilevych
Description The indicator based on Average True Range (ATR) is designed to accurately determine the possible range of price fluctuations on a selected timeframe. This tool is ideal for both beginner traders and experienced professionals looking to effectively plan their trades. Key Features: Displays possible price fluctuation levels on the chart, simplifying visual analysis. Utilizes the power of the ATR algorithm to calculate precise volatility values. Adapts to any timeframe, providing releva
FREE
Slider profy
Gennadiy Stanilevych
The idea of ​​enhancing the free Slider utility appeared after the release of a lite version of the EA trade panel Trading Chaos Expert Lite , which operates in the Current Chart mode without the possibility to maintain trades of several symbols in a single window. The purpose of Slider profy Ease search for trading signals by automatic display of charts of currency pairs from the "Market Watch" one by one at a specified interval of time in seconds. Automation of one-click placing of pending ord
FREE
Slider
Gennadiy Stanilevych
This is a utility created to ease charts watching on tablet PCs. The indicator allows you automatically alternately display "slide show" of all currency charts from "MarketWatch". The user can set the display time interval (in seconds) between charts in indicator settings. In addition, there is an option of selecting the angle of Start/Stop button which starts and stops the display of charts. This function is very useful if a trader noticed a trading signal and would like to study it in more det
FREE
Lifebuoy
Gennadiy Stanilevych
The script analyzes all trading instruments listed in the Market Watch of the MT5 platform to assess their suitability for trading on the timeframes specified in the settings. Based on the analysis, the script displays a table, where trading instruments deemed suitable and recommended for trading are marked in green, based on their compliance with the risk-to-reward ratio coefficient, including the spread (default 1:3). Instruments not recommended for trading are marked in red.
FREE
Modified Awesome Oscillator
Gennadiy Stanilevych
5 (2)
O principal objetivo do indicador é detectar e marcar sinais de negociação no histograma do Awesome Oscillator de acordo com as estratégias de "Trading Chaos, second edition" e "New Trading Dimensions". O indicador detecta e marca os seguintes sinais de negociação: "Two peaks" (dois topos) - divergência. O sinal do "Second wise-man" (Segundo homem sábio) - terceiro barra consequente do indicador Awesome Oscillator após a sua cor ter sido alterada. O histograma cruza a linha zero. O sinal "Saucer
Auto Format
Gennadiy Stanilevych
Este é um utilitário para o dimensionar automaticamente o gráfico com menos de 140 barras visíveis. Isso é necessário para uma análise correta de ondas de acordo com a estratégia "Negociação do Caos"de Bill Williams. O utilitário pode ser usado em qualquer período de tempo disponível no МetaТrader 5. Ele desenha uma linha vertical através da primeira barra iniciando o cálculo. Esta linha permite que você veja o ponto provável de partida da sequência da onda, juntamente com um número suficiente d
Short term extremum
Gennadiy Stanilevych
5 (1)
The indicator determines and marks the short-term lows and highs of the market on the chart according to Larry Williams` book "Long-term secrets to short-term trading". "Any time there is a daily low with higher lows on both sides of it, that low will be a short-term low. We know this because a study of market action will show that prices descended in the low day, then failed to make a new low, and thus turned up, marking that ultimate low as a short-term point. A short-term market high is just
Alligator modified
Gennadiy Stanilevych
5 (4)
The MT5 platform indicator has standard settings and requires no modifications when connected to the chart. Modifying the indicator involves adding two functions: Marking the area when the indicator lines are in the correct sequence (green line above or below red and blue lines, and red above or below blue). This creates a confirmed cross marked by the closing price to avoid false signals during the Alligator lines' entanglement periods. Drawing horizontal rays from market structure break levels
Stop close only
Gennadiy Stanilevych
The script in the form of an expert is created for the possibility of automatic installation of pending orders of the Stop Close Only type, which are not in MT5 by default. This type of order implies entering a long position in case the price closes above a given price level and opening a short position if the price closes below the price set by the trader. At the same time, level breakouts are not taken into account. The expert indicates the levels on the chart with lines, overcoming which will
Filtro:
argo17
25
argo17 2020.11.11 12:27 
 

Классный продукт, на 5 баллов

Oleksii Stanilevych
580
Oleksii Stanilevych 2017.06.23 09:12 
 

O usuário não deixou nenhum comentário para sua avaliação

Responder ao comentário