Trend Flow Oscillator
- 지표
-
Joas Da Silva Veiga
 안녕하세요, 저는 브라질 출신입니다. 저의 필요와 데이 트레이딩 연구를 바탕으로 MT5용 도구와 지표를 혼자서 직접 개발하고 있습니다. MQL5에서는 아직 신규 사용자이며, 제가 직접 사용하고 개발한 도구와 지표를 공유하고 있습니다. 무료인 것도 있고 유료인 것도 있습니다. 제 유료 도구나 지표 중 하나를 구매해 주셔서 제 작업을 계속할 수 있도록 도와주신다면 매우 감사하겠으며, 더 많은 무료 도구를 이곳에 공개할 수 있을 것입니다. 감사합니다.
 - 버전: 1.2
- 업데이트됨: 11 1월 2026
추세,추세지표,모멘텀,오실레이터,히스토그램,추세강도,시장흐름,추세확인,강세,약세,기술적분석
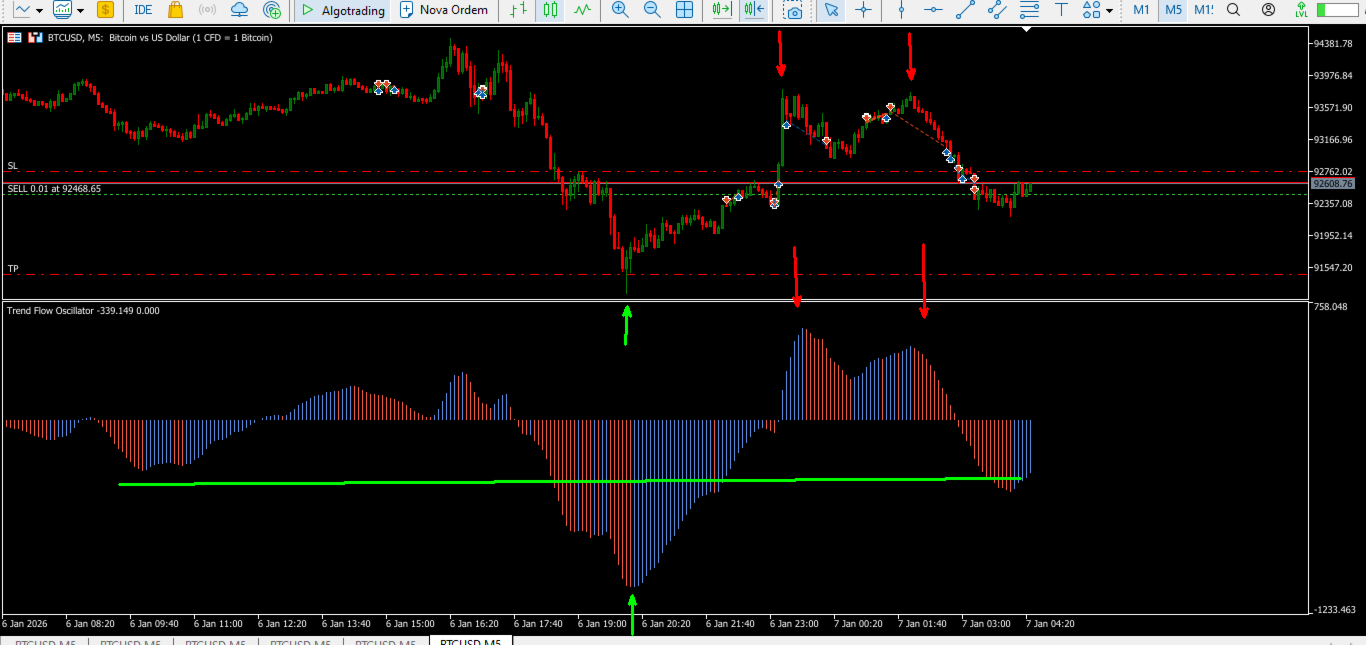
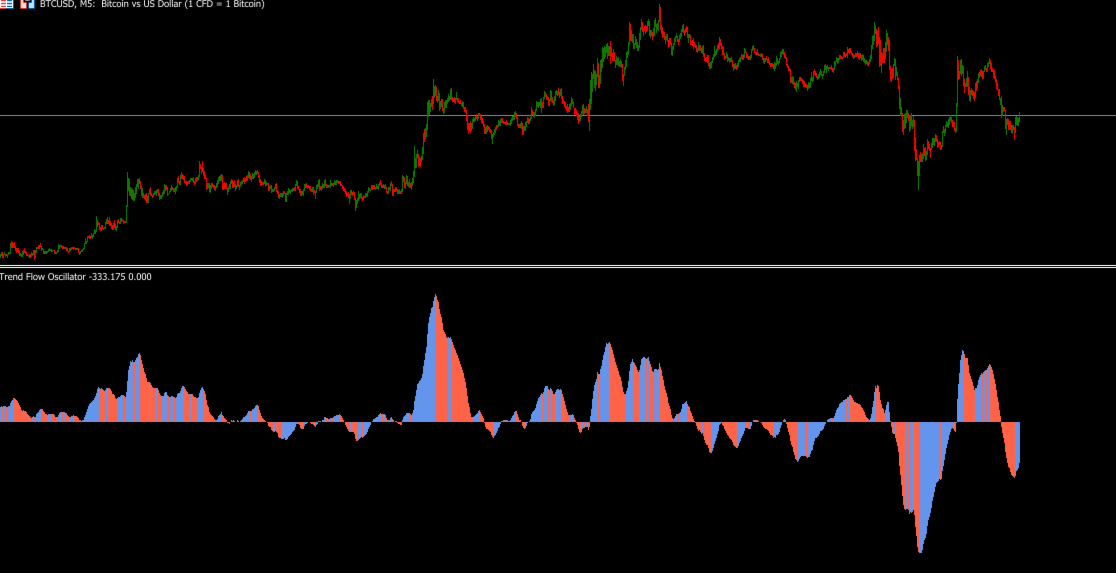
Trend Flow Oscillator는 시장의 흐름과 모멘텀을 분석하기 위한 지표로, 가격 움직임의 강도와 방향을 명확하고 간단하게 빠르게 시각적으로 파악할 수 있도록 설계되었습니다.
특히 M5 타임프레임에서 효과적이며, 이 구간에서는 흐름 변화가 더 자주 발생합니다.
기능
- 매수 및 매도 압력의 변화와 지속을 식별
- 가격 움직임의 가속 및 감속 표시
- 추세 방향의 진입 확인을 지원
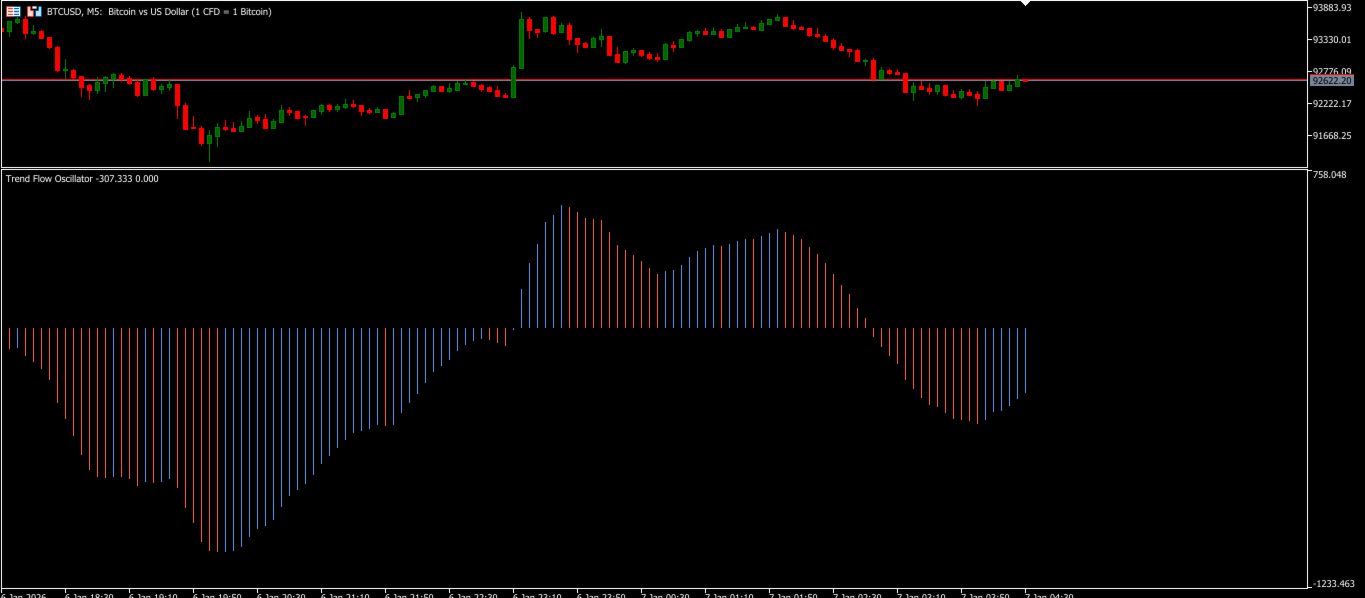
- 흐름을 별도의 히스토그램으로 표시
- 방향성 모멘텀 오실레이터로 작동
대상 사용자
- 재량 트레이더
- 스캘퍼 및 데이트레이더 (특히 M5)
- 자동 신호보다 흐름 확인을 원하는 트레이더
- 추세 및 되돌림 매매 트레이더
- 간결하고 명확한 지표를 선호하는 사용자
사용 방법
- 권장 타임프레임: M5
- 히스토그램 해석:
- 양수 막대는 매수 압력 증가를 의미
- 음수 막대는 매도 압력 증가를 의미
- 막대가 클수록 모멘텀이 강함
다음과 같은 용도로 사용할 수 있습니다:
- 추세 방향 진입 확인
- 지배적인 흐름에 반하는 거래 회피
- 돌파 및 추세 지속 확인
다음과 함께 사용하는 것을 권장합니다:
- Price Action
- 지지 및 저항
- 시장 구조
참고: 이 지표는 확인 도구이며 단독 진입 신호로 사용해서는 안 됩니다.
제한 사항
- 자동 매매 로봇이 아님
- 자동으로 거래를 실행하거나 종료하지 않음
- 시장을 예측하지 않음
- 리스크 관리를 대체하지 않음
- 수익을 보장하지 않음
위험 고지
금융 시장 거래는 높은 위험을 수반합니다.
과거 성과는 미래 결과를 보장하지 않습니다.
항상 적절한 리스크 관리를 사용하고 데모 계좌에서 테스트한 후 책임 있게 거래하십시오.
이 지표는 의사결정을 보조하는 도구이며 수익을 보장하지 않습니다.