
지표 배출 (Indicator Emissions)의 적분 특성 계산
소개
지표 배출은 시계열 연구에서 새롭고 매우 유망한 방향을 나타냅니다. 분석이 지표 자체에 초점을 맞추는 것이 아니라 실제로 시장 환경을 예측할 수 있는 미래 또는 과거로의 배출량에 초점을 맞춘다는 사실이 특징입니다.
- 미래의 지지 및 저항 수준;
- 추세 방향(가격 움직임);
- 과거에 축적된 움직임의 힘.
"MQL5의 도면 지표의 배출"이라는 이전 글에서 배출 도면 알고리즘을 다루고 주요 기능을 지정했습니다. 다시 한 번 알려드리죠:
배출은 고려 중인 지표에 고유한 선의 교차점에 위치한 일련의 점입니다.
배출 지점에는 다음과 같은 몇 가지 특성이 있습니다.
- 동일한 유형의 배출 지점은 클러스터 되는 경향이 있습니다.
- 밀집된 점 클러스터는 가격을 끌어당기거나 반대로 가격을 물러나도록 할 수 있습니다.
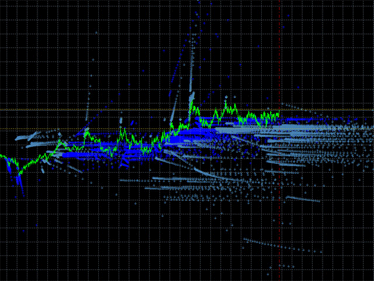
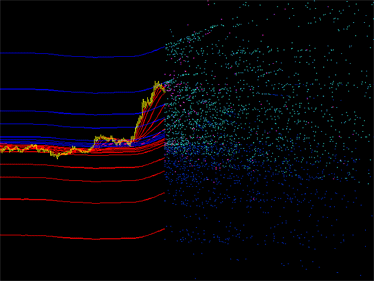
배출 갤러리:
 |  |
|---|---|
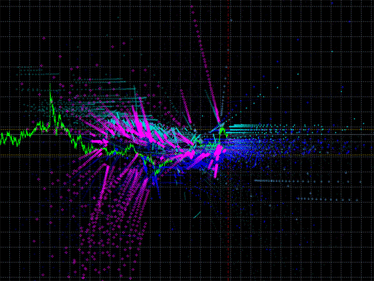 | 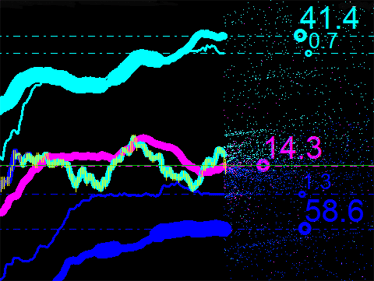 |
그림 1. 지표 배출 도표의 예. 왼쪽: DCMV 지표의 배출. 오른쪽: iMA 및 iEnvelopes 지표의 배출
배출의 적분 특성 계산을 설명하기 위해 다음과 같이 입력 매개변수를 사용하여 이동 평균 엔벨로프(Envelopes)와 이동 평균(Moving Average) 자체를 취합니다.
//--- external variable for storing averaging period of the iEnvelopes indicator
input int   ma_period=140; // averaging period of the iEnvelopes indicator
//--- array for storing deviations of the iEnvelopes indicator
double      ENV[]={0.01,0.0165,0.0273,0.0452,0.0747,01234,0.204,0.3373,0.5576,0.9217,1.5237};
//--- array for storing iMA indicator periods
int         MA[]={4,7,11,19,31,51,85};
따라서 선택한 지표에 고유한 선의 교차점을 찾습니다. 라인 수와 특성(평균 기간 및 편차)은 무작위로 선택됩니다. 실제로 배출은 이러한 지표에 대한 매개변수 세트를 사용하여 표시할 수 있습니다(공간에서 교차하는 한).
지표를 선택했으므로 이제 배출 분석을 위한 기본 프로그램 역할을 할 Expert Advisor를 생성해 보겠습니다. iMA 및 iEnvelopes 기술 지표에서 계산된 데이터를 가져와야 합니다. 저는 Expert Advisor의 기술 지표 사용 가이드에 설명된 방법을 사용할 것을 제안합니다.
교차점을 찾아야 하는 선을 표시하려면 각 선에 대해 두 개의 점만 설정하면 됩니다. 따라서 두 개의 바(예: 현재 및 이전)에 대한 지표 값만 얻는 것으로 충분합니다. 이전 바의 가격은 정적이지만 현재 바의 가격은 동적이므로 새 틱마다 새로운 포인트가 계속 생성됩니다. 코드는 다음과 같습니다.
//+------------------------------------------------------------------+
//|                                      emission_of_MA_envelope.mq5 |
//|                                           Copyright 2013, DC2008 |
//|                           https://www.mql5.com/ru/users/DC2008 |
//+------------------------------------------------------------------+
#property copyright "Copyright 2013, DC2008"
#property link      "https://www.mql5.com/ru/users/DC2008"
#property version   "1.00"
//---
#include <GetIndicatorBuffers.mqh>
#include <Emission.mqh>
//--- external variable for storing averaging period of the iEnvelopes indicator
input int   ma_period=140;      // averaging period of the iEnvelopes indicator
//--- array for storing deviations of the iEnvelopes indicator
double      ENV[]={0.01,0.0165,0.0273,0.0452,0.0747,01234,0.204,0.3373,0.5576,0.9217,1.5237};
//--- array for storing the iMA indicator periods
int         MA[]={4,7,11,19,31,51,85};
//--- array for storing pointers to the iMA and iEnvelopes indicators
int         handle_MA[];
int         handle_Envelopes[];
//--- market data
datetime    T[],prevTimeBar=0;
double      H[],L[];
#define     HL(a, b) (a+b)/2
//--- class instances
CEmission      EnvMa(0,300);
PointEmission  pEmission;
//--- drawing styles for points of emission
#define     COLOR_UPPER  C'51,255,255'
#define     COLOR_LOWER  C'0,51,255'
#define     COLOR_MA     C'255,51,255'
color       colorPoint[]={COLOR_UPPER,COLOR_LOWER,COLOR_MA};
CodeColor   styleUpper={158,COLOR_UPPER,SMALL};
CodeColor   styleLower={158,COLOR_LOWER,SMALL};
CodeColor   styleMA={158,COLOR_MA,SMALL};
//+------------------------------------------------------------------+
//| Expert initialization function                                   |
//+------------------------------------------------------------------+
int OnInit()
  {
   ArraySetAsSeries(T,true);
   ArraySetAsSeries(H,true);
   ArraySetAsSeries(L,true);
//---
   int size=ArraySize(MA);
   ArrayResize(handle_MA,size);
//--- create a pointer to the object - the iMA indicator
   for(int i=0; i<size; i++)
     {
      handle_MA[i]=iMA(NULL,0,MA[i],0,MODE_SMA,PRICE_MEDIAN);
      //--- if an error occurs when creating the object, print the message
      if(handle_MA[i]<0)
        {
         Print("The iMA object[",MA[i],"] has not been created: Error = ",GetLastError());
         //--- forced program termination
         return(-1);
        }
     }
//---
   size=ArraySize(ENV);
   ArrayResize(handle_Envelopes,size);
//--- create a pointer to the object - the iEnvelopes indicator
   for(int i=0; i<size; i++)
     {
      handle_Envelopes[i]=iEnvelopes(NULL,0,ma_period,0,MODE_SMA,PRICE_MEDIAN,ENV[i]);
      //--- if an error occurs when creating the object, print the message
      if(handle_Envelopes[i]<0)
        {
         Print("The iEnvelopes object[",ENV[i],"] has not been created: Error = ",GetLastError());
         //--- forced program termination
         return(-1);
        }
     }
//---
   return(0);
  }
//+------------------------------------------------------------------+
//| Expert deinitialization function                                 |
//+------------------------------------------------------------------+
void OnDeinit(const int reason)
  {
//---

  }
//+------------------------------------------------------------------+
//| Expert tick function                                             |
//+------------------------------------------------------------------+
void OnTick()
  {
//--- market data
   CopyTime(NULL,0,0,2,T);
   CopyHigh(NULL,0,0,2,H);
   CopyLow(NULL,0,0,2,L);
//--- fill the declared arrays with current values from all indicator buffers
   string name;
   uint GTC=GetTickCount();
//---- indicator buffers
   double   ibMA[],ibMA1[];      // arrays for the iMA indicator
   double   ibEnvelopesUpper[];  // array for the iEnvelopes indicator (UPPER_LINE)
   double   ibEnvelopesLower[];  // array for the iEnvelopes indicator (LOWER_LINE)
   for(int i=ArraySize(handle_MA)-1; i>=0; i--)
     {
      if(!CopyBufferAsSeries(handle_MA[i],0,0,2,true,ibMA))
         return;
      //---
      for(int j=ArraySize(handle_Envelopes)-1; j>=0; j--)
        {
         if(!GetEnvelopesBuffers(handle_Envelopes[j],0,2,ibEnvelopesUpper,ibEnvelopesLower,true))
            return;
         //--- find the intersection point of the iEnvelopes(UPPER_LINE) and iMA indicators
         pEmission=EnvMa.CalcPoint(ibEnvelopesUpper[1],ibEnvelopesUpper[0],ibMA[1],ibMA[0],T[0]);
         if(pEmission.real) // if the intersection point is found, draw it in the chart
           {
            name="iEnvelopes(UPPER_LINE)"+(string)j+"=iMA"+(string)i+(string)GTC;
            EnvMa.CreatePoint(name,pEmission,styleUpper);
           }
         //--- find the intersection point of the iEnvelopes(LOWER_LINE) and iMA indicators
         pEmission=EnvMa.CalcPoint(ibEnvelopesLower[1],ibEnvelopesLower[0],ibMA[1],ibMA[0],T[0]);
         if(pEmission.real) // if the intersection point is found, draw it in the chart
           {
            name="iEnvelopes(LOWER_LINE)"+(string)j+"=iMA"+(string)i+(string)GTC;
            EnvMa.CreatePoint(name,pEmission,styleLower);
           }
        }
      //---
      for(int j=ArraySize(handle_MA)-1; j>=0; j--)
        {
         if(i!=j)
           {
            if(!CopyBufferAsSeries(handle_MA[j],0,0,2,true,ibMA1))
               return;
            //--- find the intersection point of the iMA and iMA indicators
            pEmission=EnvMa.CalcPoint(ibMA1[1],ibMA1[0],ibMA[1],ibMA[0],T[0]);
            if(pEmission.real) // if the intersection point is found, draw it in the chart
              {
               name="iMA"+(string)j+"=iMA"+(string)i+(string)GTC;
               EnvMa.CreatePoint(name,pEmission,styleMA);
              }
           }
        }
     }
//--- deletion of the graphical objects of emission not to stuff the chart
   if(T[0]>prevTimeBar) // delete once per bar
     {
      int  total=ObjectsTotal(0,0,-1);
      prevTimeBar=T[0];
      for(int obj=total-1;obj>=0;obj--)
        {
         string obj_name=ObjectName(0,obj,0,OBJ_TEXT);
         datetime obj_time=(datetime)ObjectGetInteger(0,obj_name,OBJPROP_TIME);
         if(obj_time<T[0])
            ObjectDelete(0,obj_name);
        }
      Comment("Emission © DC2008       Objects = ",total);
     }
//---
  }
이 Expert Advisor의 모든 디테일에 대해서는 언급하지 않겠습니다. 여기서 주목해야 할 주요 사항은 배출을 플롯하기 위해 두 선의 교차점 계산 및 표시를 담당하는 CEmission 클래스 인스턴스를 사용한다는 것입니다.
//+------------------------------------------------------------------+
//|                                                     Emission.mqh |
//|                                           Copyright 2013, DC2008 |
//|                           https://www.mql5.com/ru/users/DC2008 |
//+------------------------------------------------------------------+
#property copyright "Copyright 2013, DC2008"
#property link      "https://www.mql5.com/ru/users/DC2008"
#property version   "1.00"
#define  BIG   7    // point size
#define  SMALL 3    // point size
//+------------------------------------------------------------------+
//| pMABB structure                                                  |
//+------------------------------------------------------------------+
struct PointEmission
  {
   double            x;       // X-coordinate of the time point
   double            y;       // Y-coordinate of the price point
   datetime          t;       // t-coordinate of the point's time
   bool              real;    // whether the point exists
  };
//+------------------------------------------------------------------+
//| CodeColor structure                                              |
//+------------------------------------------------------------------+
struct CodeColor
  {
   long              Code;    // point symbol code
   color             Color;   // point color
   int               Width;   // point size
  };
//+------------------------------------------------------------------+
//| Base class for emissions                                         |
//+------------------------------------------------------------------+
class CEmission
  {
private:
   int               sec;
   int               lim_Left;   // limiting range of visibility in bars
   int               lim_Right;  // limiting range of visibility in bars

public:
   PointEmission     CalcPoint(double   y1,  // Y-coordinate of straight line 1 on bar [1]
                               double   y0,  // Y-coordinate of straight line 1 on bar [0]
                               double   yy1, // Y-coordinate of straight line 2 on bar [1]
                               double   yy0, // Y-coordinate of straight line 2 on bar [0]
                               datetime t0   // t-coordinate of the current bar Time[0]
                               );
   bool              CreatePoint(string name,            // point name
                                 PointEmission &point,   // coordinates of the point
                                 CodeColor &style);      // point drawing style
                                 CEmission(int limitLeft,int limitRight);
                    ~CEmission();
  };
//+------------------------------------------------------------------+
//|                                                                  |
//+------------------------------------------------------------------+
CEmission::CEmission(int limitLeft,int limitRight)
  {
   sec=PeriodSeconds();
   lim_Left=limitLeft;
   lim_Right=limitRight;
  }
//+------------------------------------------------------------------+
//|                                                                  |
//+------------------------------------------------------------------+
CEmission::~CEmission()
  {
  }
//+------------------------------------------------------------------+
//| The CalcPoint method of the CEmission class                      |
//+------------------------------------------------------------------+
PointEmission CEmission::CalcPoint(double   y1, // Y-coordinate of straight line 1 on bar [1]
                                   double   y0, // Y-coordinate of straight line 1 on bar [0]
                                   double   yy1,// Y-coordinate of straight line 2 on bar [1]
                                   double   yy0,// Y-coordinate of straight line 2 on bar [0]
                                   datetime t0  // t-coordinate of the current bar Time[0]
                                   )
  {
   PointEmission point={NULL,NULL,NULL,false};
   double y0y1=y0-y1;
   double y1yy1=y1-yy1;
   double yy0yy1=yy0-yy1;
   double del0=yy0yy1-y0y1;
   if(MathAbs(del0)>0)
     {
      point.x=y1yy1/del0;
      if(point.x<lim_Left || point.x>lim_Right) return(point);
      point.y=y1+y0y1*y1yy1/del0;
      if(point.y<0) return(point);
      point.t=t0+(int)(point.x*sec);
      point.real=true;
      return(point);
     }
   return(point);
  }
//+------------------------------------------------------------------+
//| The CreatePoint method of the CEmission class                    |
//+------------------------------------------------------------------+
bool CEmission::CreatePoint(string name,            // point name
                            PointEmission &point,  // coordinates of the point
                            CodeColor &style)      // point drawing style
  {
   if(ObjectCreate(0,name,OBJ_TEXT,0,0,0))
     {
      ObjectSetString(0,name,OBJPROP_FONT,"Wingdings");
      ObjectSetInteger(0,name,OBJPROP_ANCHOR,ANCHOR_CENTER);
      ObjectSetInteger(0,name,OBJPROP_FONTSIZE,style.Width);
      ObjectSetString(0,name,OBJPROP_TEXT,CharToString((uchar)style.Code));
      ObjectSetDouble(0,name,OBJPROP_PRICE,point.y);
      ObjectSetInteger(0,name,OBJPROP_TIME,point.t);
      ObjectSetInteger(0,name,OBJPROP_COLOR,style.Color);
      return(true);
     }
   return(false);
  }
배출 지점은 텍스트와 같은 그래픽 개체로 표시됩니다. 우선 개체 앵커가 기호 중심에 정렬되어야 한다는 사실에서 비롯됩니다. 둘째, 넓은 범위에서 개체 크기를 변경할 수 있습니다. 이러한 점 속성은 복잡한 배출을 얻을 수 있는 큰 잠재력을 제공합니다.

그림 2. iMA 및 iEnvelopes 지표의 원래 배출
배출의 적분 특성
따라서 제안된 Expert Advisor를 차트에 배치한 후 다양한 색상으로 많은 포인트를 얻었습니다(그림 2 참조).
- 아쿠아 - iMA와 iEnvelopes의 교차점, UPPER_LINE 버퍼.
- 파란색 - iMA와 iEnvelopes의 교차점, LOWER_LINE 버퍼.
- 마젠타색 - iMA와 iMA의 교차점입니다.
이 혼돈은 자동 거래에서 사용할 수 없습니다. 신호, 수준 및 기타 양적 시장 특성이 필요하지만 여기서는 명상과 chiromancy에 대한 시각적 이미지만 얻을 수 있으며 숫자는 없습니다.
배출의 적분 특성은 지표 배출의 결과로 얻은 데이터를 일반화하는 역할을 합니다.
배출의 통합 특성에 대한 필요성은 또한 통합 채널, 라인, 레벨, 신호 등의 새로운 유형의 지표를 사용하여 시장 조사 기회를 제공한다는 사실에 의해 주도됩니다. 가장 일반적인 배출 값을 결정하기 위해 작게 시작하여 모든 포인트 유형에 대한 평균 가격을 계산하여 아래와 같이 수평선을 추가로 그립니다.

그림 3. 모든 포인트 유형에 대한 평균 가격의 수평선
이를 위해 기존 코드에 몇 가지 추가 코드 블록을 추가합니다. 데이터 섹션으로:
//--- arrays for calculation and display of integral characteristics of emissions
#define     NUMBER_TYPES_POINT   3
double      sum[NUMBER_TYPES_POINT],sumprev[NUMBER_TYPES_POINT];
datetime    sum_time[NUMBER_TYPES_POINT];
int         n[NUMBER_TYPES_POINT],W[NUMBER_TYPES_POINT];
color       colorLine[]={clrAqua,clrBlue,clrMagenta};
OnTick() 모듈:
//--- calculation of integral characteristics of emissions
   ArrayInitialize(n,0);
   ArrayInitialize(sum,0.0);
   ArrayInitialize(sum_time,0.0);
   for(int obj=total-1;obj>=0;obj--)
     {
      string   obj_name=ObjectName(0,obj,0,OBJ_TEXT);
      datetime obj_time=(datetime)ObjectGetInteger(0,obj_name,OBJPROP_TIME);
      if(obj_time>T[0])
        {
         color    obj_color=(color)ObjectGetInteger(0,obj_name,OBJPROP_COLOR);
         double   obj_price=ObjectGetDouble(0,obj_name,OBJPROP_PRICE);
         for(int i=ArraySize(n)-1; i>=0; i--)
            if(obj_color==colorPoint[i])
              {
               n[i]++;
               sum[i]+=obj_price;
               sum_time[i]+=obj_time;
              }
        }
     }
//--- displaying integral characteristics of emissions
   for(int i=ArraySize(n)-1; i>=0; i--)
     {
      if(n[i]>0)
        {
         name="H.line."+(string)i;
         ObjectCreate(0,name,OBJ_HLINE,0,0,0,0);
         ObjectSetInteger(0,name,OBJPROP_COLOR,colorLine[i]);
         ObjectSetInteger(0,name,OBJPROP_STYLE,STYLE_DASHDOT);
         ObjectSetInteger(0,name,OBJPROP_WIDTH,1);
         ObjectSetDouble(0,name,OBJPROP_PRICE,sum[i]/n[i]);
        }
     }
계속 진행합니다. 이제 모든 포인트 세트에 대한 평균 시간 값을 계산하고 평균 가격의 해당 라인에 표시해 보겠습니다(그림 4 참조). 따라서 우리는 결코 정적이지 않고 항상 공간에서 움직이는 배출의 양적 특성을 처음으로 얻었습니다.
차트에는 일시적인 위치만 표시됩니다. 우리는 그것들을 나중에 연구할 수 있도록 어떻게든 내역을 고정시켜야 합니다. 지금까지 이것이 어떻게 수행될 수 있는지 아직 불분명하며 신중하게 고려해야 합니다... 그 동안 우리는 더 개선하고 차트의 마커 옆에 계산에 관련된 포인트 수를 표시합니다. 이는 추가 분석에도 유용할 획득된 특성의 가중치입니다.

그림 4. 평균 가격과 평균 시간의 교차점에 있는 마커
그러나 분석의 편의를 위해 백분율 비율을 사용합니다. 주요 배출 지점은 iMA 및 iEnvelopes 지표의 교차로 인한 것이므로 합계를 100%로 간주합니다. 우리가 지금 무엇을 가지고 있는지 보자:

그림 5. 모든 유형의 배출 지점에 대한 백분율 비율
세 값을 더하면 합계가 100% 이상입니다. 마젠타 색으로 표시된 값 34.4는 특정 시점에서 iMA와 iMA의 교차점 속성입니다. 즉, 지표가 자체 교차하지만 입력 데이터가 다릅니다. 이 경우 기준값이며 추후 시장분석에 어떻게 활용될 수 있을지 생각해 볼 수 있습니다.
그러나 포인트 수의 백분율 비율을 얻을 때 또 다른 문제가 발생합니다. 특히 변하기 때문에 특히 배출 특성의 백분율 값을 기록에서 어떻게 고칠 수 있습니까?
그래픽 분석
우리는 이제 배출량의 통합적인 특성을 가지고 있지만 얻은 데이터를 기반으로 한 거래 전략의 분석 및 개발에 여전히 가깝지 않습니다. 그러나 주의 깊은 독자는 이미 이 문제에 대한 해결책을 찾았을 것입니다(그림 1 참조). 해결책은 다음과 같습니다. 저는 주요 배출 지점의 백분율 비율에 비례하는 다른 두께를 사용하여 적분 곡선을 그릴 것을 제안합니다.
곡선의 현재 부분은 현재 바와 이전 바 사이의 평균 가격선을 따라 표시되며 이러한 좌표는 실제로 미래에서 가져온 것임을 명심하세요. 지표 배출의 일종의 선도적인 통합 채널입니다. 나는 그것이 실제로 매우 혼란스럽게 들린다는 것을 알고 있습니다 ... 그리고 계속 읽어야 하는지 생각해야 합니다. 하지만 진행하면서 이것이 점점 더 흥미로워지기를 바랍니다.
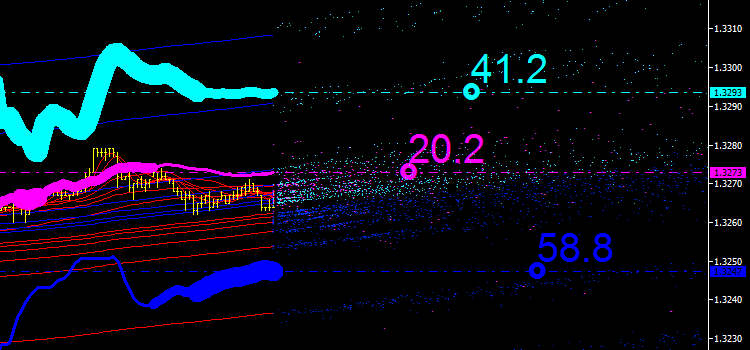
그림 6. 지표 배출의 통합 채널
그래서 우리는 "iMA & iMA" 배출(차트에서 마젠타색으로 표시)에 대한 일부 용도를 찾은 것 같습니다. 그리고 우리는 통합 이동 평균이라는 새로운 지표를 얻었습니다.
이제 Expert Advisor의 코드로 돌아가서 OnTick() 모듈에서 어떤 변경 사항이 발생했는지 확인합니다.
//--- displaying integral characteristics of emissions
   ArrayInitialize(W,10);
   W[ArrayMaximum(n)]=20;
   W[ArrayMinimum(n)]=3;
   for(int i=ArraySize(n)-1; i>=0; i--)
     {
      if(n[i]>0)
        {
         //--- horizontal lines of mean prices
         name="H.line."+(string)i;
         ObjectCreate(0,name,OBJ_HLINE,0,0,0,0);
         ObjectSetInteger(0,name,OBJPROP_COLOR,colorLine[i]);
         ObjectSetInteger(0,name,OBJPROP_STYLE,STYLE_DASHDOT);
         ObjectSetInteger(0,name,OBJPROP_WIDTH,1);
         ObjectSetDouble(0,name,OBJPROP_PRICE,sum[i]/n[i]);
         //--- markers
         name="P."+(string)i;
         ObjectCreate(0,name,OBJ_TEXT,0,0,0);
         ObjectSetString(0,name,OBJPROP_FONT,"Wingdings");
         ObjectSetInteger(0,name,OBJPROP_ANCHOR,ANCHOR_CENTER);
         ObjectSetInteger(0,name,OBJPROP_FONTSIZE,17);
         ObjectSetString(0,name,OBJPROP_TEXT,CharToString(163));
         ObjectSetInteger(0,name,OBJPROP_COLOR,colorLine[i]);
         ObjectSetDouble(0,name,OBJPROP_PRICE,sum[i]/n[i]);
         ObjectSetInteger(0,name,OBJPROP_TIME,sum_time[i]/n[i]);
         //--- integral curves
         name="T"+(string)i+".line"+(string)T[1];
         ObjectCreate(0,name,OBJ_TREND,0,0,0);
         ObjectSetInteger(0,name,OBJPROP_COLOR,colorLine[i]);
         ObjectSetInteger(0,name,OBJPROP_WIDTH,W[i]);
         if(sumprev[i]>0)
           {
            ObjectSetDouble(0,name,OBJPROP_PRICE,0,sumprev[i]);
            ObjectSetInteger(0,name,OBJPROP_TIME,0,T[1]);
            ObjectSetDouble(0,name,OBJPROP_PRICE,1,(sum[i]/n[i]));
            ObjectSetInteger(0,name,OBJPROP_TIME,1,T[0]);
           }
         //--- numerical values of integral characteristics
         name="Text"+(string)i+".control";
         ObjectCreate(0,name,OBJ_TEXT,0,0,0);
         ObjectSetInteger(0,name,OBJPROP_ANCHOR,ANCHOR_LEFT_LOWER);
         ObjectSetInteger(0,name,OBJPROP_FONTSIZE,30);
         ObjectSetInteger(0,name,OBJPROP_COLOR,colorLine[i]);
         string str=DoubleToString((double)n[i]/(double)(n[0]+n[1])*100,1);
         ObjectSetString(0,name,OBJPROP_TEXT,str);
         ObjectSetDouble(0,name,OBJPROP_PRICE,0,(sum[i]/n[i]));
         ObjectSetInteger(0,name,OBJPROP_TIME,0,sum_time[i]/n[i]);
        }
     }
그래픽 분석을 계속하겠습니다. 하지만 뭔가 부족합니다... 또 다른 중요한 배출 특성을 놓친 것 같습니다. 적분 곡선은 평균 가격을 기반으로만 그려졌습니다. 그러나 평균 시간 좌표를 고려해야 합니다. 아래 그림을 보고 채널 제한에 특히 주의하세요.
- 아쿠아 라인은 채널의 상한선입니다.
- 파란색 선은 채널의 하한선입니다.
시간상 제로 바에 더 가까운 마커를 식별해야 합니다.
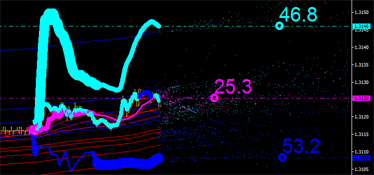 | 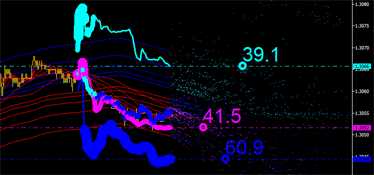 |
|---|
그림 7. 시간을 선도하는 완전한 특성. 왼쪽: 채널의 선행 상한선입니다. 오른쪽: 채널의 선행 하한선입니다.
이 문제는 다음과 같이 해결할 수 있습니다. 가격선(PRICE_MEDIAN)을 가격 차트에 추가하고 선의 색상에 따라 선의 색상을 변경합니다. 마지막 바에 더 가까운 마커(청록색 또는 파란색)입니다(그림 7 참조). 또한 기존 코드에 다음 코드 블록을 삽입합니다.
//---
   if(n[ArrayMinimum(n)]>0)
     {
      datetime d[2];
      for(int j=0;j<2;j++)
        {
         d[j]=sum_time[j]/n[j];
        }
      int i=ArrayMinimum(d);

      name="Price.line"+(string)T[1];
      ObjectCreate(0,name,OBJ_TREND,0,0,0);
      ObjectSetInteger(0,name,OBJPROP_WIDTH,8);
      ObjectSetDouble(0,name,OBJPROP_PRICE,0,HL(H[1],L[1]));
      ObjectSetInteger(0,name,OBJPROP_TIME,0,T[1]);
      ObjectSetDouble(0,name,OBJPROP_PRICE,1,HL(H[0],L[0]));
      ObjectSetInteger(0,name,OBJPROP_TIME,1,T[0]);
      ObjectSetInteger(0,name,OBJPROP_COLOR,colorLine1[i]);
     }
//---
이제 다음 단계를 준비하세요. 2차 배출과 같은 원래 배출의 적분 특성을 기반으로 배출을 플롯하려고 하면 어떻게 될까요? 결국, 그 선들은 또한 서로 교차하므로 결과적으로 배출점이 있어야 합니다. 어떤 결과가 나올 수 있는지 알아보겠습니다. 다음 코드 줄을 추가하여 이전 코드 블록을 향상시킵니다.
      //--- emissions of integral characteristics of the original emissions
      pEmission=EnvMa.CalcPoint(sumprev[0],sum[0]/n[0],sumprev[2],sum[2]/n[2],T[0]);
      if(pEmission.real) // if the intersection point is found, draw it in the chart
        {
         name="test/up"+(string)GTC;
         EnvMa.CreatePoint(name,pEmission,styleUpper2);
        }
      pEmission=EnvMa.CalcPoint(sumprev[1],sum[1]/n[1],sumprev[2],sum[2]/n[2],T[0]);
      if(pEmission.real) // if the intersection point is found, draw it in the chart
        {
         name="test/dn"+(string)GTC;
         EnvMa.CreatePoint(name,pEmission,styleLower2);
        }
그리고 데이터 섹션에 다음 줄을 삽입합니다.
#define     COLOR_2_UPPER  C'102,255,255'
#define     COLOR_2_LOWER  C'51,102,255'
CodeColor   styleUpper2={178,COLOR_2_UPPER,BIG};
CodeColor   styleLower2={178,COLOR_2_LOWER,BIG};
아래 그림에서 결과를 확인할 수 있습니다. 우리는 지금까지 아무것도 제안하지 않는 새로운 점을 볼 수 있습니다.
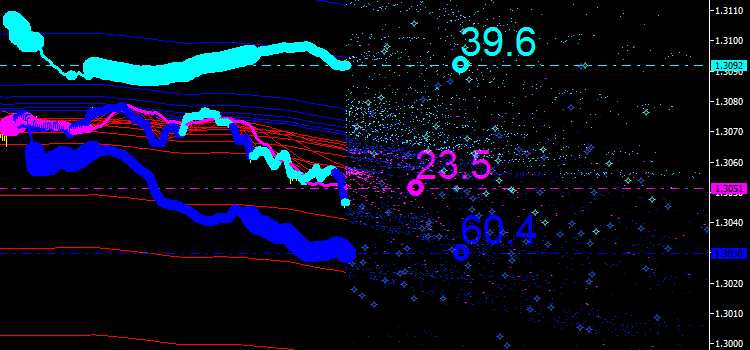
그림 8. 적분 라인의 배출
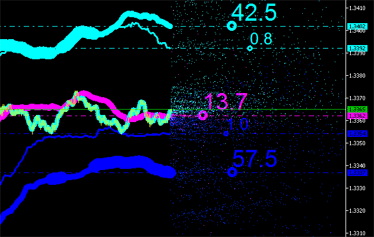
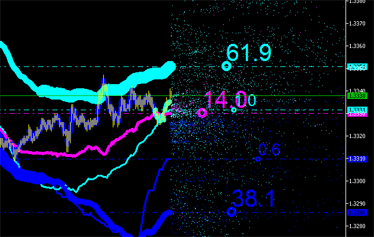
적분 특성은 차트에 표시된 배출량을 사용하여 새 포인트(그림 9 참조)에 대해서도 분명히 계산할 수 있습니다!
 |  |
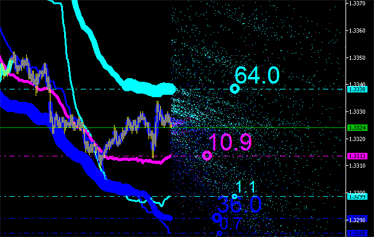 | 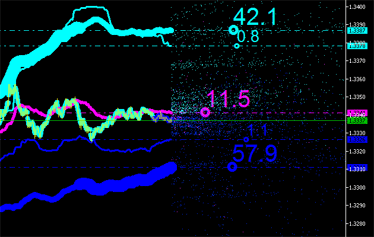 |
그림 9. 배출의 적분 특성
그래서 우리는 우리가 필요로 하는 모든 것을 플로팅하고 배출의 적분 특성을 얻었습니다. 이제 거래 전략의 분석 및 개발을 진행할 수 있습니다. 하지만 여전히 불가능해 보입니다! 지금 우리를 막고 있는 것은 무엇입니까?
시계열 배출
그래픽 분석을 통해 배출의 통합적 특성을 연구할 수 있지만 너무 자원 집약적입니다. 전략 테스터의 비주얼 모드에서 제안된 코드를 실행하려고 하면 테스트 속도가 곧 0으로 떨어질 것입니다! 이는 차트에 그래픽 개체가 많기 때문입니다.
따라서 자연스럽게 많은 점을 제거하고 적분 곡선만 남기고 싶을 것입니다. 이 문제를 해결하기 위해 특수 배열(버퍼)을 사용합니다.
배출량의 시계열은 배출량에 대한 정보가 축적되는 특별히 배열된 배열입니다.
시간이 핵심 필드임에도 불구하고 포함된 데이터가 시간순으로 정렬되지 않는다는 점에서 표준 시계열과 다릅니다.

그림 10. 배출 특성의 시계열
이러한 배열은 새 요소가 빈 셀이나 이전 값으로 채워진 셀에 저장되는 방식으로 배열됩니다. 이를 위해 CTimeEmission 클래스를 사용합니다. 코드에서 구현하는 방법은 다음과 같습니다.
//+------------------------------------------------------------------+
//|                                                 TimeEmission.mqh |
//|                                           Copyright 2013, DC2008 |
//|                           https://www.mql5.com/ru/users/DC2008 |
//+------------------------------------------------------------------+
#property copyright "Copyright 2013, DC2008"
#property link      "https://www.mql5.com/ru/users/DC2008"
#property version   "1.00"
//---
#include <Emission.mqh>
#define ARRMAX       64
#define ARRDELTA     8
//+------------------------------------------------------------------+
//| pIntegral structure                                              |
//+------------------------------------------------------------------+
struct pIntegral
  {
   double            y;       // Y-coordinate of the price point (mean price of the points with the same time)
   datetime          t;       // t-coordinate of the point's time
   int               n;       // n-number of points with the same time
  };
//+------------------------------------------------------------------+
//| Base class for time series of emissions                          |
//+------------------------------------------------------------------+
class CTimeEmission
  {
private:
   pIntegral         time_series_Emission[]; // time series of emission
   int               size_ts; // number of elements in time series
   datetime           t[1];
public:
   //--- method of writing new elements to time series of emission
   void              Write(PointEmission &point);
   //--- method of reading integral characteristics of emissions
   pIntegral         Read();
                     CTimeEmission();
                    ~CTimeEmission();
  };

//+------------------------------------------------------------------+
//|                                                                  |
//+------------------------------------------------------------------+
CTimeEmission::CTimeEmission()
  {
   ArrayResize(time_series_Emission,ARRMAX,ARRMAX);
   size_ts=ArraySize(time_series_Emission);
   for(int i=size_ts-1; i>=0; i--)
      time_series_Emission[i].t=0;
  }
//+------------------------------------------------------------------+
//|                                                                  |
//+------------------------------------------------------------------+
CTimeEmission::~CTimeEmission()
  {
  }
//+------------------------------------------------------------------+
//| The Write method of the CTimeEmission class                      |
//+------------------------------------------------------------------+
void CTimeEmission::Write(PointEmission &point)
  {
   CopyTime(NULL,0,0,1,t);
   size_ts=ArraySize(time_series_Emission);
   for(int k=0;k<size_ts;k++)
     {
      if(time_series_Emission[k].t<t[0]) // find the first empty cell
        {
         if(k>size_ts-ARRDELTA)
           {   // increase the array size, if necessary
            int narr=ArrayResize(time_series_Emission,size_ts+ARRMAX,ARRMAX);
            for(int l=size_ts-1;l<narr;l++)
               time_series_Emission[l].t=0;
           }
         time_series_Emission[k].y=point.y;
         time_series_Emission[k].t=point.t;
         time_series_Emission[k].n=1;
         return;
        }
      if(time_series_Emission[k].t==point.t) // find the first similar cell
        {
         time_series_Emission[k].y=(time_series_Emission[k].y*time_series_Emission[k].n+point.y)/(time_series_Emission[k].n+1);
         time_series_Emission[k].n++;
         return;
        }
     }
  }
//+------------------------------------------------------------------+
//| The Read method of the CTimeEmission class                       |
//+------------------------------------------------------------------+
pIntegral CTimeEmission::Read()
  {
   CopyTime(NULL,0,0,1,t);
   pIntegral property_Emission={0.0,0,0};
   size_ts=ArraySize(time_series_Emission);
   for(int k=0;k<size_ts;k++)
     {
      if(time_series_Emission[k].t>=t[0])
        {
         property_Emission.y+=time_series_Emission[k].y*time_series_Emission[k].n;
         property_Emission.t+=(time_series_Emission[k].t-t[0])*time_series_Emission[k].n;
         property_Emission.n+=time_series_Emission[k].n;
        }
     }
   if(property_Emission.n>0)
     {
      property_Emission.y=property_Emission.y/property_Emission.n;
      property_Emission.t=property_Emission.t/property_Emission.n+t[0];
     }
   return(property_Emission);
  }
여기에서 두 가지 클래스 방법의 구현을 볼 수 있습니다. 배출 지점을 시계열에 쓰는 것과 배출의 적분 특성 값을 읽는 것입니다.
적분 특성의 간결한 계산
이제 배출량의 시계열이 있으므로 거래 전략을 추가로 개발하기 위해 적분 특성 계산을 위한 간결한 알고리즘을 만들 수 있습니다. 원래 Expert Advisor를 업데이트하겠습니다.
//+------------------------------------------------------------------+
//|                                   emission_of_MA_envelope_ts.mq5 |
//|                                           Copyright 2013, DC2008 |
//|                           https://www.mql5.com/ru/users/DC2008 |
//+------------------------------------------------------------------+
#property copyright "Copyright 2013, DC2008"
#property link      "https://www.mql5.com/ru/users/DC2008"
#property version   "1.00"
//---
#include <GetIndicatorBuffers.mqh>
#include <Emission.mqh>
#include <TimeEmission.mqh>
//--- number of point types
#define     NUMBER_TYPES_POINT   3
//--- array for storing the iMA indicator periods
int      MA[]={4,7,11,19,31,51,85};
//--- external variable for storing averaging period of the iEnvelopes indicator
input int ma_period=140; // averaging period of the iEnvelopes indicator
//--- array for storing deviations of the iEnvelopes indicator
double   ENV[]={0.01,0.0165,0.0273,0.0452,0.0747,01234,0.204,0.3373,0.5576,0.9217,1.5237};
//--- array for storing pointers to the iMA indicator
int      handle_MA[];
//--- array for storing pointers to the iEnvelopes indicator
int      handle_Envelopes[];
//--- market data
datetime    T[],prevTimeBar=0;
double      H[],L[];
#define     HL(a, b) (a+b)/2
//--- class instances
CEmission      EnvMa(0,200);
PointEmission  pEmission;
CTimeEmission  tsMA[NUMBER_TYPES_POINT];
pIntegral      integral[NUMBER_TYPES_POINT];
//--- drawing styles for points of emission
#define     DEL            500
//--- arrays for calculation and display of integral characteristics of emissions
double      sumprev[NUMBER_TYPES_POINT];
int         n[NUMBER_TYPES_POINT],W[NUMBER_TYPES_POINT];
color       colorLine[]={clrAqua,clrBlue,clrMagenta};
int         fontPoint[]={30,30,30};
int         fontMarker[]={16,16,16};
//+------------------------------------------------------------------+
//| Expert initialization function                                   |
//+------------------------------------------------------------------+
int OnInit()
  {
   ArraySetAsSeries(T,true);
   ArraySetAsSeries(H,true);
   ArraySetAsSeries(L,true);
   ArrayInitialize(sumprev,0.0);
//---
   int size=ArraySize(MA);
   ArrayResize(handle_MA,size);
//--- create a pointer to the object - the iMA indicator
   for(int i=0; i<size; i++)
     {
      handle_MA[i]=iMA(NULL,0,MA[i],0,MODE_SMA,PRICE_MEDIAN);
      //--- if an error occurs when creating the object, print the message
      if(handle_MA[i]<0)
        {
         Print("The iMA object[",MA[i],"] has not been created: Error = ",GetLastError());
         //--- forced program termination
         return(-1);
        }
     }
//+------------------------------------------------------------------+
   size=ArraySize(ENV);
   ArrayResize(handle_Envelopes,size);
//--- create a pointer to the object - the iEnvelopes indicator
   for(int i=0; i<size; i++)
     {
      handle_Envelopes[i]=iEnvelopes(NULL,0,ma_period,0,MODE_SMA,PRICE_MEDIAN,ENV[i]);
      //--- if an error occurs when creating the object, print the message
      if(handle_Envelopes[i]<0)
        {
         Print("The iEnvelopes object[",ENV[i],"] has not been created: Error = ",GetLastError());
         //--- forced program termination
         return(-1);
        }
     }
//---
   return(0);
  }
//+------------------------------------------------------------------+
//| Expert deinitialization function                                 |
//+------------------------------------------------------------------+
void OnDeinit(const int reason)
  {
//---

  }
//+------------------------------------------------------------------+
//| Expert tick function                                             |
//+------------------------------------------------------------------+
void OnTick()
  {
//--- market data
   CopyTime(NULL,0,0,2,T);
   CopyHigh(NULL,0,0,2,H);
   CopyLow(NULL,0,0,2,L);
//--- fill the declared arrays with current values from all indicator buffers
   string name;
   uint GTC=GetTickCount();
//---- indicator buffers
   double   ibMA[],ibMA1[];      // arrays for the iMA indicator
   double   ibEnvelopesUpper[];  // array for the iEnvelopes indicator (UPPER_LINE)
   double   ibEnvelopesLower[];  // array for the iEnvelopes indicator (LOWER_LINE)
   for(int i=ArraySize(handle_MA)-1; i>=0; i--)
     {
      if(!CopyBufferAsSeries(handle_MA[i],0,0,2,true,ibMA))
         return;
      //---
      for(int j=ArraySize(handle_Envelopes)-1; j>=0; j--)
        {
         if(!GetEnvelopesBuffers(handle_Envelopes[j],0,2,ibEnvelopesUpper,ibEnvelopesLower,true))
            return;
         //--- find the intersection point of the iEnvelopes(UPPER_LINE) and iMA indicators
         pEmission=EnvMa.CalcPoint(ibEnvelopesUpper[1],ibEnvelopesUpper[0],ibMA[1],ibMA[0],T[0]);
         if(pEmission.real) // if the intersection point is found, add it to the time series of emission
            tsMA[0].Write(pEmission);
         //--- find the intersection point of the iEnvelopes(LOWER_LINE) and iMA indicators
         pEmission=EnvMa.CalcPoint(ibEnvelopesLower[1],ibEnvelopesLower[0],ibMA[1],ibMA[0],T[0]);
         if(pEmission.real) // if the intersection point is found, add it to the time series of emission
            tsMA[1].Write(pEmission);
        }
      //---
      for(int j=ArraySize(handle_MA)-1; j>=0; j--)
        {
         if(i!=j)
           {
            if(!CopyBufferAsSeries(handle_MA[j],0,0,2,true,ibMA1))
               return;
            //--- find the intersection point of the iMA and iMA indicators
            pEmission=EnvMa.CalcPoint(ibMA1[1],ibMA1[0],ibMA[1],ibMA[0],T[0]);
            if(pEmission.real) // if the intersection point is found, add it to the time series of emission
               tsMA[2].Write(pEmission);
           }
        }
     }
//--- deletion of the graphical objects of emission not to stuff the chart
   if(T[0]>prevTimeBar)
     {
      prevTimeBar=T[0];
      //---
      for(int i=ArraySize(n)-1; i>=0; i--)
         sumprev[i]=integral[i].y;
      //---
      for(int obj=ObjectsTotal(0,0,-1)-1;obj>=0;obj--)
        {
         string obj_name=ObjectName(0,obj,0,OBJ_TREND);
         datetime obj_time=(datetime)ObjectGetInteger(0,obj_name,OBJPROP_TIME);
         if(obj_time<T[0]-DEL*PeriodSeconds())
            ObjectDelete(0,obj_name);
        }
      Comment("Emission © DC2008   Graphical objects = ",ObjectsTotal(0,0,-1));
     }
//--- calculation of integral characteristics of emission
   for(int i=ArraySize(n)-1; i>=0; i--)
      integral[i]=tsMA[i].Read();
//--- displaying integral characteristics of emission
   ArrayInitialize(W,5);
   if(integral[0].n>integral[1].n)
     {
      W[0]=20;
      W[1]=10;
     }
   else
     {
      W[0]=10;
      W[1]=20;
     }
   for(int i=ArraySize(n)-1; i>=0; i--)
     {
      //--- horizontal lines of mean prices
      name="H.line."+(string)i;
      ObjectCreate(0,name,OBJ_HLINE,0,0,0,0);
      ObjectSetInteger(0,name,OBJPROP_COLOR,colorLine[i]);
      ObjectSetInteger(0,name,OBJPROP_STYLE,STYLE_DASHDOT);
      ObjectSetInteger(0,name,OBJPROP_WIDTH,1);
      ObjectSetDouble(0,name,OBJPROP_PRICE,integral[i].y);
      //--- markers
      name="P."+(string)i;
      ObjectCreate(0,name,OBJ_TEXT,0,0,0);
      ObjectSetString(0,name,OBJPROP_FONT,"Wingdings");
      ObjectSetInteger(0,name,OBJPROP_ANCHOR,ANCHOR_CENTER);
      ObjectSetInteger(0,name,OBJPROP_FONTSIZE,fontMarker[i]);
      ObjectSetString(0,name,OBJPROP_TEXT,CharToString(163));
      ObjectSetInteger(0,name,OBJPROP_COLOR,colorLine[i]);
      ObjectSetDouble(0,name,OBJPROP_PRICE,integral[i].y);
      ObjectSetInteger(0,name,OBJPROP_TIME,integral[i].t);
      //--- integral curves
      name="T"+(string)i+".line"+(string)T[1];
      ObjectCreate(0,name,OBJ_TREND,0,0,0);
      ObjectSetInteger(0,name,OBJPROP_COLOR,colorLine[i]);
      ObjectSetInteger(0,name,OBJPROP_WIDTH,W[i]);
      if(sumprev[i]>0)
        {
         ObjectSetDouble(0,name,OBJPROP_PRICE,0,sumprev[i]);
         ObjectSetInteger(0,name,OBJPROP_TIME,0,T[1]);
         ObjectSetDouble(0,name,OBJPROP_PRICE,1,integral[i].y);
         ObjectSetInteger(0,name,OBJPROP_TIME,1,T[0]);
        }
      //--- numerical values of integral characteristics
      if(integral[0].n+integral[1].n>0)
        {
         name="Text"+(string)i+".control";
         ObjectCreate(0,name,OBJ_TEXT,0,0,0);
         ObjectSetInteger(0,name,OBJPROP_ANCHOR,ANCHOR_LEFT_LOWER);
         ObjectSetInteger(0,name,OBJPROP_FONTSIZE,fontPoint[i]);
         ObjectSetInteger(0,name,OBJPROP_COLOR,colorLine[i]);
         string str=DoubleToString((double)integral[i].n/(double)(integral[0].n+integral[1].n)*100,1);
         ObjectSetString(0,name,OBJPROP_TEXT,str);
         ObjectSetDouble(0,name,OBJPROP_PRICE,0,integral[i].y);
         ObjectSetInteger(0,name,OBJPROP_TIME,0,integral[i].t);
        }
     }
  }
코드는 짧아지고계산 속도는 빨라졌습니다. 이제 시각화 없이 거래 로봇을 테스트하고 최적화할 수 있습니다!
거래에서 적분 특성의 사용
적분 특성은 다음에 대한 신호 발생기로 사용할 수 있습니다.
- 채널 혁신,
- 서로 교차하거나 가격,
- 방향으로 변경합니다.
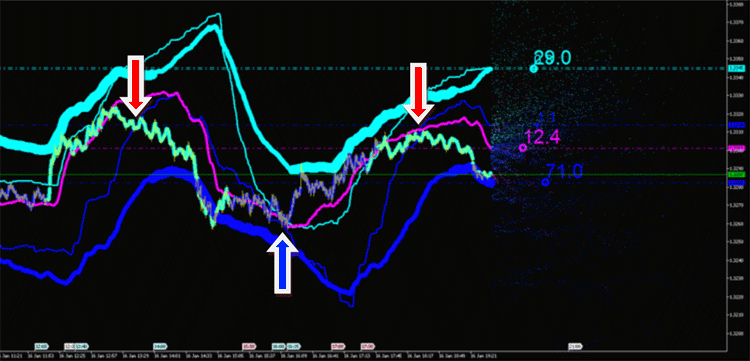
Fig. 11. 지표 배출의 통합 특성 계산은 시장 분석(시계열)을 위한 새로운 도구와 방법을 제공합니다.
결론
- 지표 배출의 통합 특성 계산은 시장 분석(시계열)을 위한 새로운 도구와 방법을 제공합니다.
- 시계열을 사용하여 적분 특성 계산 속도를 높이는 데 성공했습니다.
- 그리고 그것은 우리가 배출량을 사용하는 자동 거래 전략을 개발할 수 있는 가능성을 열어주었습니다.
MetaQuotes 소프트웨어 사를 통해 러시아어가 번역됨.
원본 기고글: https://www.mql5.com/ru/articles/610
경고: 이 자료들에 대한 모든 권한은 MetaQuotes(MetaQuotes Ltd.)에 있습니다. 이 자료들의 전부 또는 일부에 대한 복제 및 재출력은 금지됩니다.
이 글은 사이트 사용자가 작성했으며 개인의 견해를 반영합니다. Metaquotes Ltd는 제시된 정보의 정확성 또는 설명 된 솔루션, 전략 또는 권장 사항의 사용으로 인한 결과에 대해 책임을 지지 않습니다.
 MetaTrader 4 및 MetaTrader 5의 신호 거래에 대한 일반 정보
여기 하나...
동영상 보기
주제 관련 동영상
배출 관련 비디오
DC2008, 여분의 선(값이 0.8인 파란색과 1.1인 파란색)이 무엇인지 알려주시겠습니까?