Naked Forex Big Shadow indicator for MT4
- インディケータ
-
Renaud Herve Francois Candel
 ITC SOFTWARE is a technology company based in the United States since 2010.
🟠🔴 The company develops financial software and indicators for different trading platforms:
-Metatrader 4 and Metatrader 5
-TradingView
-NinjaTrader - バージョン: 1.40
- アップデート済み: 2 7月 2023
- アクティベーション: 5
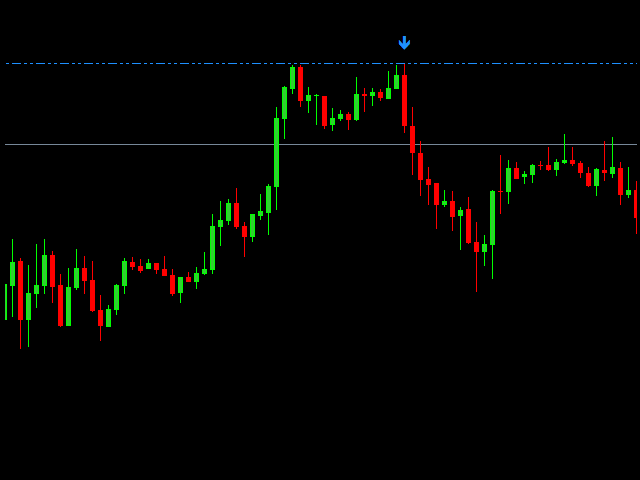
Naked Forex Big Shadow IndicatorBig Shadow Indicator is a pattern recognition indicator for Forex, Stocks, Indices, Futures, Commodities and Cryptos.
When you have a Big Shadow on your chart then this is a strong signal meaning that you might be ahead of a reversal. You can take other elements (momentum, trend, volatility, price action, fundamentals) to build a complete strategy and confirm your entries. Beware that you might not make money just following the arrows generated by the pattern recognition.
The Big Shadow pattern is a simple and effective pattern to trade.
The strategy that comes with the Big Shadow is based on price action.
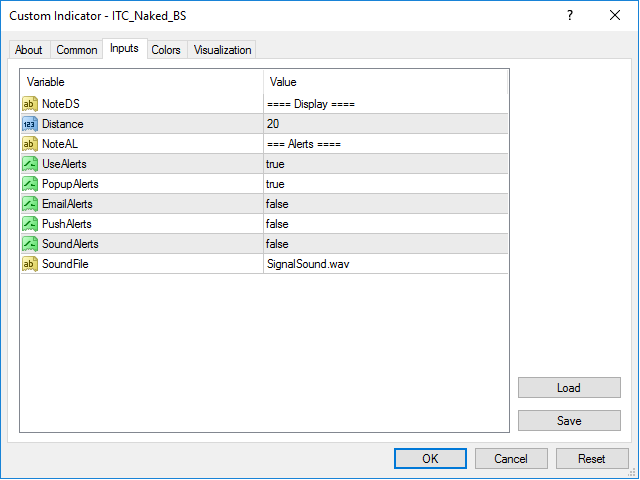
Inputs of the indicator are:
Trading rules:
When you have a Big Shadow on your chart then this is a strong signal meaning that you might be ahead of a reversal. You can take other elements (momentum, trend, volatility, price action, fundamentals) to build a complete strategy and confirm your entries. Beware that you might not make money just following the arrows generated by the pattern recognition.
The Big Shadow pattern is a simple and effective pattern to trade.
The strategy that comes with the Big Shadow is based on price action.
Inputs of the indicator are:
- Distance: distance in pixel relative to top or bottom of candle to display the arrow symbol
- UseAlerts (true/false): to enable alerts
- PopAlerts (true/false): to enable alerts of type Popup window
- EmailAlerts (true/false): to enable alerts of type Email
- PushAlerts (true/false): to enable alerts of type Push Notification
- SoundAlerts (true/false): to enable alerts of type Sound
- SoundFile: file to be used for sound alerts
Trading rules:
- For BUY: wait for a bullish Big Shadow to print on a support zone after a down trend. Wait for price to break high of the Big Shadow candle (5 pips above the high for H1 and higher time frames). Immediately enter in the trade once high is broken. You also can use a BUY STOP order placed 5 pips above the high of the candle (plus spread). Stop Loss should be placed below the low of the Big Shadow candle. If order is not triggered in the next candle then trade is invalidated and should be canceled.
- For SELL: wait for a bearish Big Shadow to print on resistance zone after an up trend. Wait for price to break the low of the Big Shadow candle (5 pips below the low for H1 and higher time frames). Immediately enter in the trade once low is broken. You also can use a SELL STOP order place 5 pips below the low of the candle. Stop Loss should be placed above the high of the Big Shadow candle. If order is not triggered in the next candle then trade is invalidated and should be canceled.
The Big Shadow indicator can be used with any time frame.
The Big Shadow indicator can be used with any class of asset: Forex, Stocks, Indices, Futures, Commodities and Cryptos.
Other indicators for MT4:
We developed more than 60 indicators and utilities for Metatrader 4 and Metatrader 5.
Indicators for MT5:
All our indicator are developed both for MT4 and MT5.
List of all our indicators:
👉 You can get the complete list of our indicators visiting our profile page.