Keltner Channel indicator for MT4
- インディケータ
-
Renaud Herve Francois Candel
 ITC SOFTWARE is a technology company based in the United States since 2010.
🟠🔴 The company develops financial software and indicators for different trading platforms:
-Metatrader 4 and Metatrader 5
-TradingView
-NinjaTrader - バージョン: 1.50
- アップデート済み: 4 7月 2023
- アクティベーション: 5
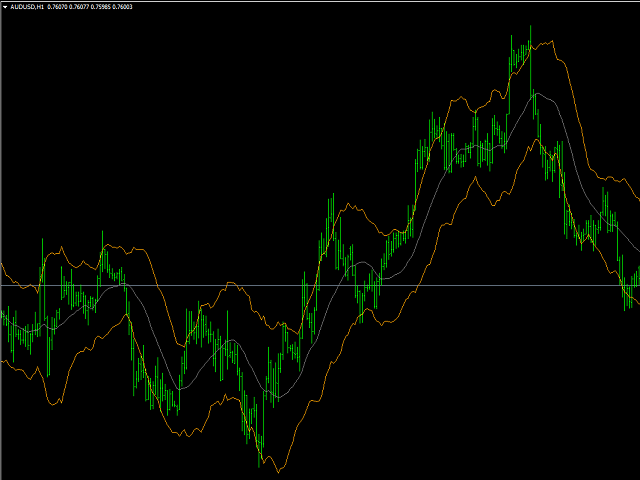
Keltner Channel is an oscillator like Bollinger Bands.
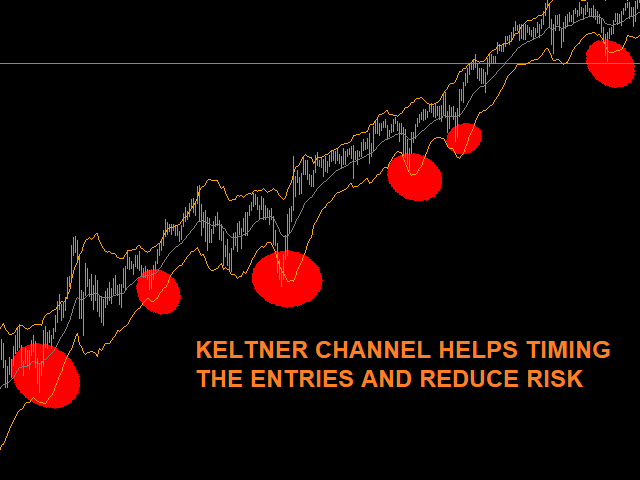
Keltner Channel is a very good tool to time entries for your strategy.
Keltner Channel displays a channel where price is supposed to stay unless we are in overbought or oversold situations.
Various strategies use Keltner Channel indicator successfully to spot overbought / oversold situations and look for reversals.
Keltner Channel indicator uses ATR to determine overbought and oversold situations.
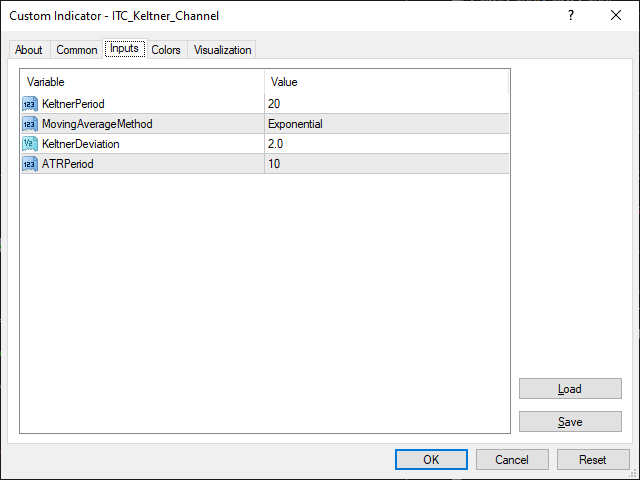
Inputs of the indicator are:
- Keltner Period: period to be used for the moving average calculation
- MovingAverageMethod: method to be used for the moving average calculation (exponential, simple, smoothed, linear weighted)
- KeltnerDeviation: deviation to be used for calculation of upper and lower bands
- ATRPeriod: ATR period to be used for calculation of upper and lower bands
The Keltner Channel indicator can be used with any time frame.
It can be used with any class of assets: Forex, Stocks, Indices, Futures, Commodities and Cryptos.
Other indicators for MT4:
We developed more than 60 indicators and utilities for Metatrader 4 and Metatrader 5.
Indicators for MT5:
All our indicator are developed both for MT4 and MT5.
List of all our indicators:
You can see the complete list of our indicators visiting our profile page.