OBOS Overbought Oversold indicator for MT4
- インディケータ
-
Renaud Herve Francois Candel
 ITC SOFTWARE is a technology company based in the United States since 2010.
🟠🔴 The company develops financial software and indicators for different trading platforms:
-Metatrader 4 and Metatrader 5
-TradingView
-NinjaTrader - バージョン: 1.50
- アップデート済み: 2 7月 2023
- アクティベーション: 5
OBOS indicator
OBOS Indicator is an exclusive indicator to spot entries based on price action.The OBOS Indicator is both effective and user friendly.
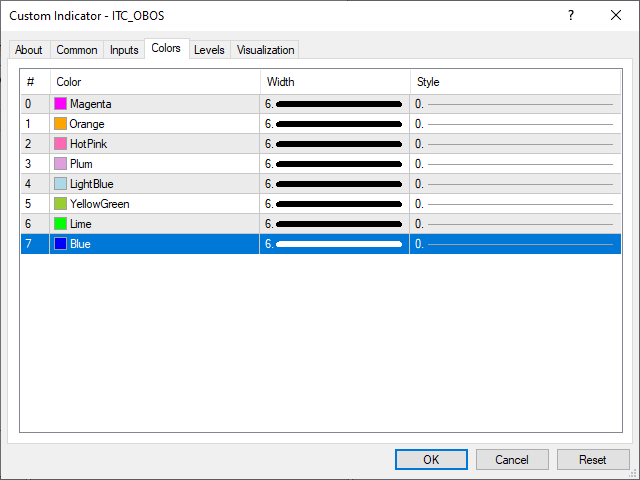
Indicator uses simple color codes and levels to indicate Overbought and Oversold conditions. No more headache.
The OBOS Indicator will only gives you indication when there are possible entries. Means you only get useful information.
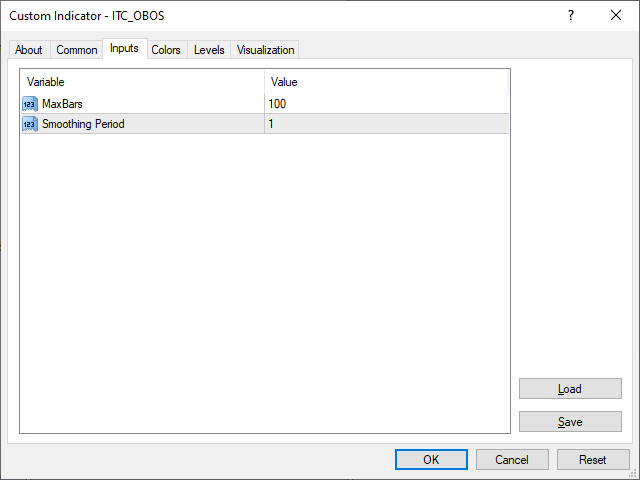
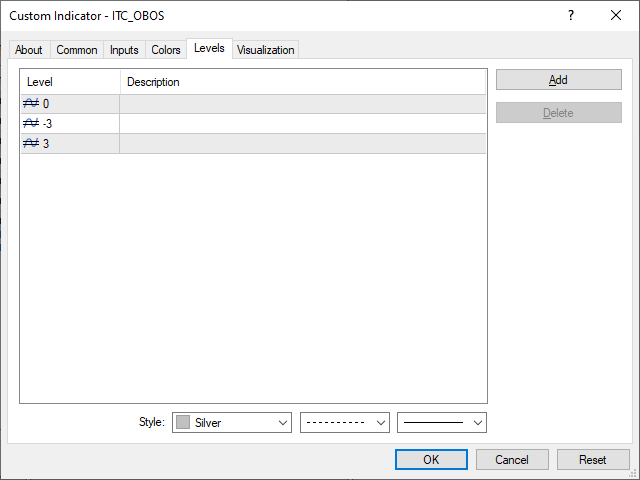
Inputs of the indicator are:
- MaxBars: number of bars to display in your chart
- Smoothing period: number of bars to be used for indicator calculations
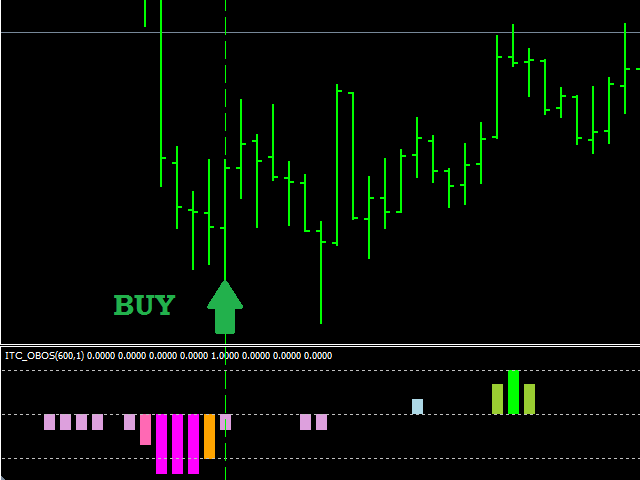
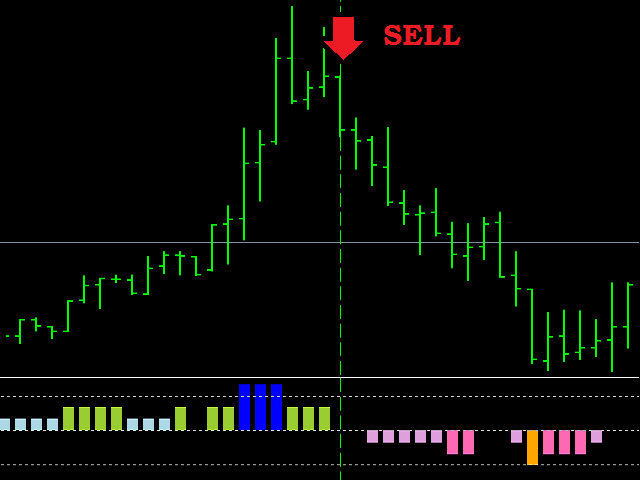
- wait for the indicator to give you an overbought or oversold signal (usually blue and magenta bars)
- once signal comes out, wait for price to calm down (small bar or no bar in the indicator)
- enter in the market with a SELL or BUY order
Please look at the screenshots attached for examples of entries applying the rules given above.
The indicator can be used with any class of assets: Forex, Stocks, Indices, Futures, Commodities and Cryptos.
The indicator works fine with any time frame.
Other indicators for MT4:
We developed more than 60 indicators and utilities for Metatrader 4 and Metatrader 5.
Indicators for MT5:
All our indicators are developed both for MT4 and MT5.
List of all our indicators:
👉 You can get the complete list of our indicators visiting our profile page.