Round Numbers Levels indicator for MT4
- インディケータ
-
Renaud Herve Francois Candel
 ITC SOFTWARE is a technology company based in the United States since 2010.
🟠🔴 The company develops financial software and indicators for different trading platforms:
-Metatrader 4 and Metatrader 5
-TradingView
-NinjaTrader - バージョン: 1.70
- アップデート済み: 4 7月 2023
Round Numbers Levels indicator for MT4
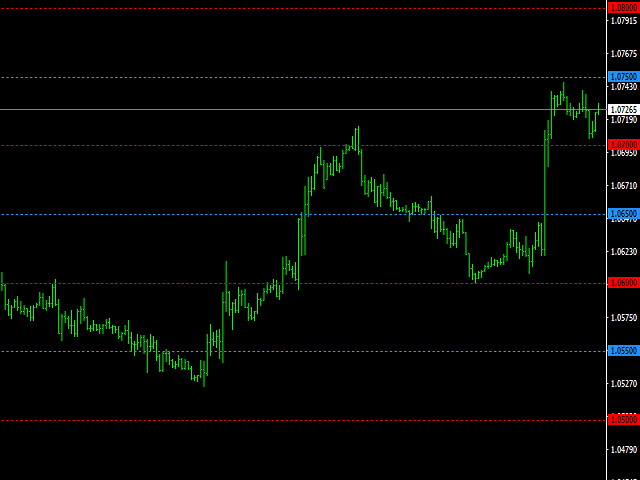
Round Numbers indicator is a simple but useful indicator to draw 00 and 50 price levels in your chart.These levels act as supports and resistances, and therefore should be taken into account when trading.
These levels can be used as profit targets or entry points.
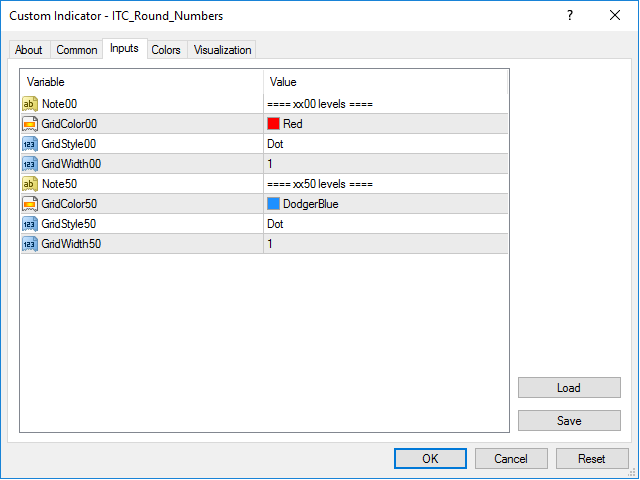
Inputs of the indicator are:
- TGridColor00: color to be used for xx00 levels
- GridStyle00: line style to be used for xx00 levels
- GridWidth00: line width to be used for xx00 levels
- GridColor50: color to be used for xx50 levels
- GGridStyle50: line style to be used for xx50 levels
- GridWidth50: line width to be used for xx50 levels
You can use the indicator with any Forex pair.
You can use the indicator with any time frame.
Other indicators for MT4:
We developed more than 60 indicators and utilities for Metatrader 4 and Metatrader 5.
Indicators for MT5:
All our indicators are developed both for MT4 and MT5.
List of all our indicators:
You can see the complete list of our indicators visiting our profile page.


Gracias por compartir el indicador, no he tenido ningún problema hasta ahora.