Supply and Demand Dashboard PRO

4.8
現在20%OFF!

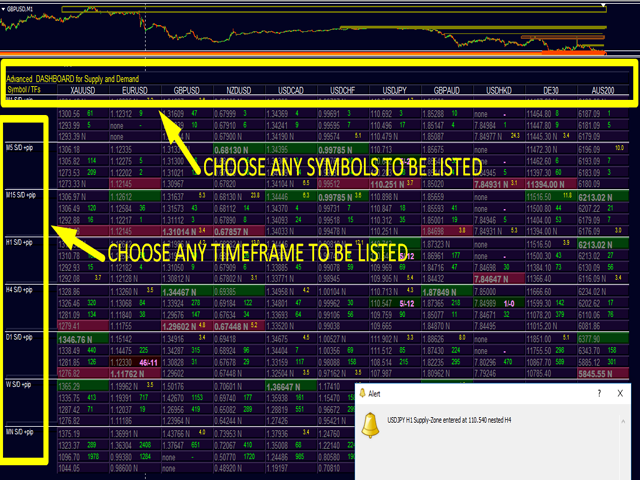
このダッシュボードは、複数のシンボルと最大9つのタイムフレームで動作するソフトウェアの非常に強力な部分です。
このソフトは、弊社のメインインジケーター(ベストレビュー:Advanced Supply Demand)をベースにしています。   Advanced Supply Demand

ダッシュボードは、素晴らしい概要を提供します。それは示しています。 
  1. ゾーン強度評価を含むフィルタリングされた需給値。
  2. ゾーン内/ゾーンへのPips距離。
  3. ネストされたゾーンがハイライトされます。
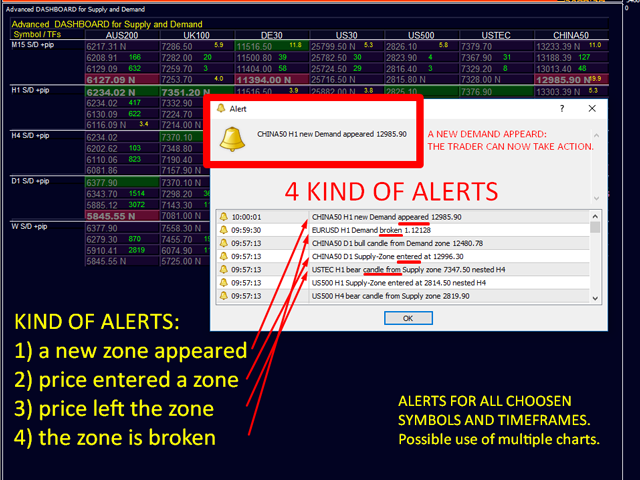
  4. 選択されたシンボルの4種類のアラートを全ての(9)時間枠で提供します。
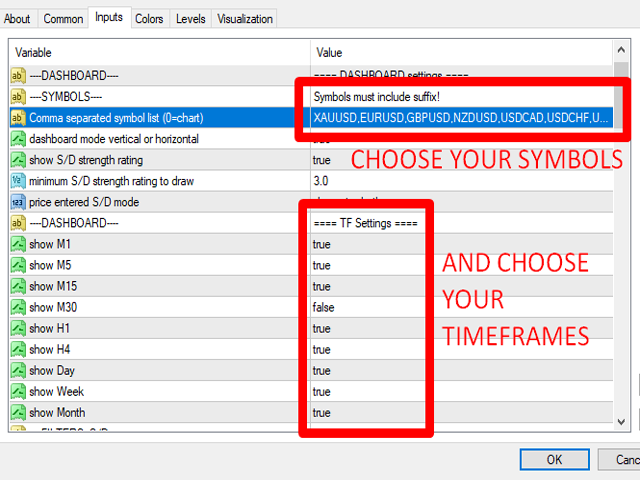
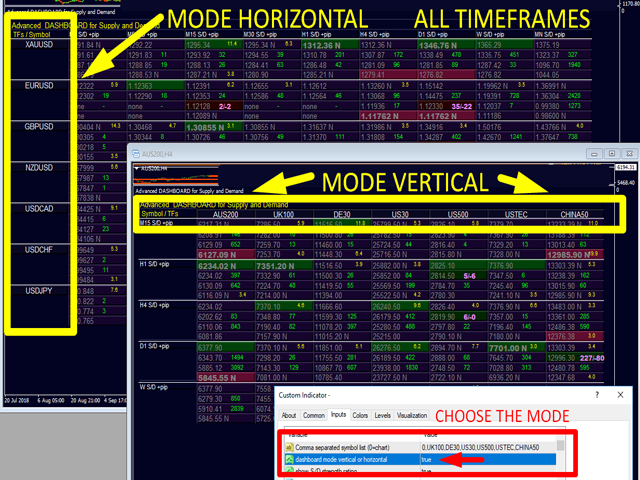
  5. それはあなたの個人的なニーズに合わせて高度に設定可能です。


あなたの利益!


すべてのトレーダーにとって最も重要な質問です。

市場に参入するのに最適なレベルはどこか?
成功のチャンスとリスク/リターンを得るために、強力な供給/需要ゾーン内またはその近くで取引を開始します。


損切りの最適な位置はどこですか?
最も安全なのは、強力な供給/需要ゾーンの下/上にストップを置くことです。


最適な利益目標は?
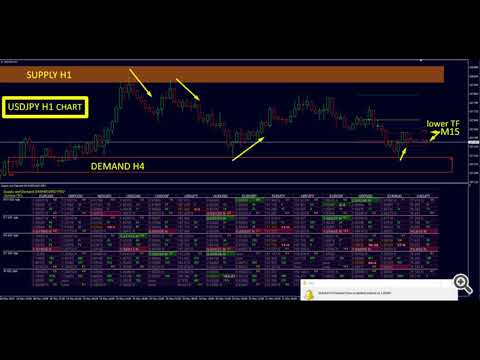
出口戦略はエントリーと同様に重要であり、より高い時間枠の画像を知ることはこの点で役に立ちます。買いの場合は次の供給ゾーンをターゲットに、売りの場合は次の需要ゾーンをターゲットにします。高い時間枠の需給に十分な利幅の余地があることを確認するために、需給のプルバックでエントリーすると、利益が増加します。


なぜ強いゾーンと弱いゾーンをフィルタリングするのか?
アンバランスが大きければ大きいほど、価格の動きも大きくなります。最も確率の高い価格水準は、買い手と売り手の間の不均衡が最も大きいものです。事前の警告もなく、その場で反転し、石のように落ちる-それが大きなアンバランスのあるエリアです。その価格で大量の売り手が市場に参入し、買い手を圧倒しているのです。また、突然の売りが出た場合、ちょうどその水準あたりでより多くの売り手が売りを待っていた可能性が高いのです。


重要な情報が明らかになった。

需給のポテンシャルを最大限に引き出すには、ユーザーマニュアルをご覧ください。    https://www.mql5.com/en/blogs/post/725584

需給取引に慣れていない方は、こちらのブログもお読みください。   blog

上級者向けの機能として、4つの特別なアラートがあります。
  • 新しいゾーンが出現しました。
  • 価格がゾーンに入った。
  • 価格がゾーンを離れました。
  • ゾーンが破壊された。


必要であれば、ネストされたゾーンのみに対してすべてのアラートをフィルタリングすることができます。
アラートされる時間枠を選択することができます。
アラートの対象からシンボルを除外することができます。
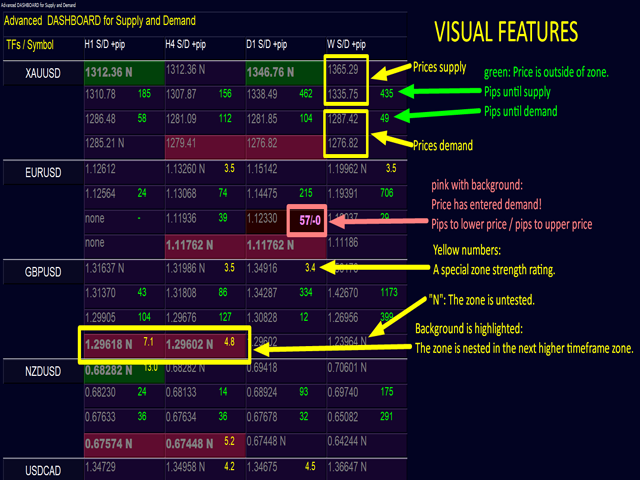


ダッシュボード上の視覚的な機能。
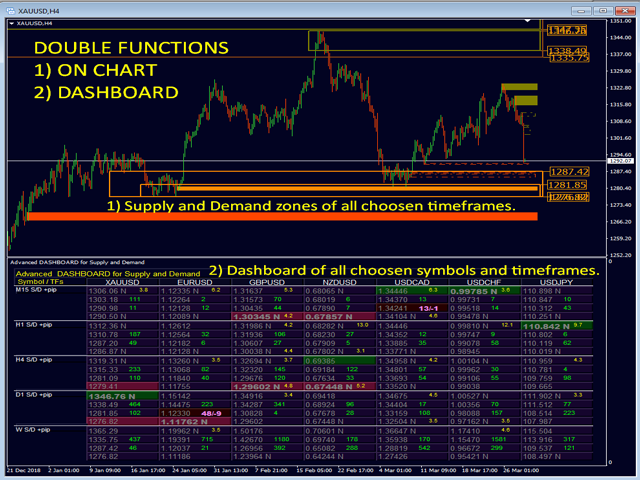
供給と需要の価格。(上段から下段へ:供給上限価格/供給下限価格/需要上限価格/需要下限価格)。
供給と需要までのピップス距離。価格がゾーンから遠い場合、緑色に表示されます。
需給の範囲内でPipsの距離。ピンクと太字は、価格がゾーンに入った場合です。(外側の価格までのpips / 内側の価格までのpips)
特別なゾーンの強さの評価。黄色の数字は、最小強度に達した場合。
新規またはテスト中:ゾーンがまだテストされていない、または新規の場合、価格に「N」が追加されます。
ネスティッド: ゾーンが上位の時間枠のゾーンにネストしている場合、背景がハイライトされる。
ネステッド・アンド・ニュー: 需要と供給のための価格が太字で表示されます。


チャート上の視覚的な機能。


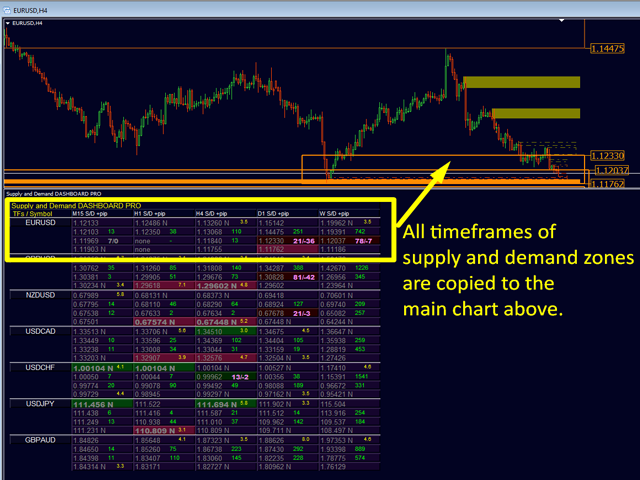
ダッシュボードのサブウィンドウをマウスで下にドラッグするだけで、実際のチャートが表示されます。シンボル名をクリックすると、シンボルが変更されます。
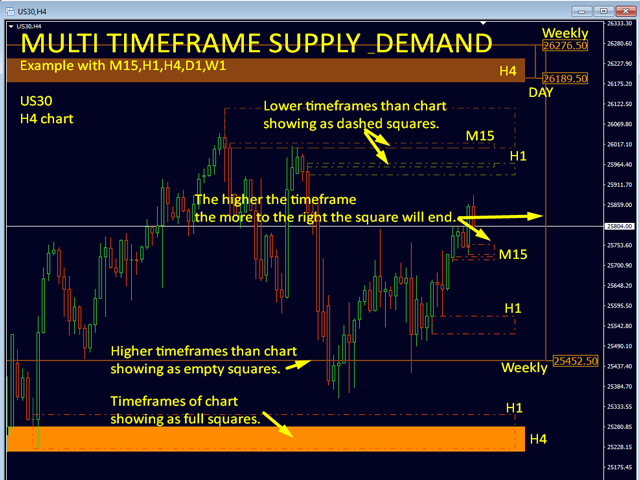
ダッシュボードに表示されている全ての時間枠がチャートに表示されます。
チャートより下位のタイムフレームは破線の四角形で表示されます。
チャートの実際のタイムフレームは四角で表示されます。
チャートより上位のタイムフレームは空白の四角で表示されます。
時間枠が高いほど、四角の端が右に寄っています。
カラーコードは、そのゾーンが新しいかテストされているかを示します。
価格はチャート上に表示することも、しないことも可能です。


価格はチャート上に表示することも、表示しないことも可能です。    https://www.mql5.com/en/blogs/post/725584


ストラテジーテスター
ご注意ください。マルチシンボル、マルチタイムフレームダッシュボードであるため、ストラテジーテスターでデモを動作させるには特別な設定が必要です。また、チャートデータの引用を準備する必要があります。プライベートメッセージを送ってください。(同じように動作するAdvanced Supply Demandのデモを代わりに試すこともできます。)


ヒント


ユーザーマニュアルをお読みください。ここをクリックしてください。    https://www.mql5.com/en/blogs/post/725584
特別です。MT4チャート履歴を更新するために、1つのサポートチャートが開かれます。この機能は無効にすることができます。
取引システムと取引例については、プロフィールの私のニュースやブログをチェックしてください。
インジケーターを手に入れたら、より多くの情報、リンク、テンプレートなどが入ったスターターパックメール(マニュアル)をリクエストしてください。私はあなたの成功を確認したい


自動的に翻訳されます 英語オリジナルはこちら https://www.mql5.com/en/market/product/37335
レビュー 24
Gabor Bocsak
3182
Gabor Bocsak 2023.05.23 18:42 
 

I really like the indicators! Actually i use 4 of them and they work really well together! I had a lot of questions as i use a bit different strategy.but i got all the help! Thank you!

Tyrena Booker
96
Tyrena Booker 2023.02.01 19:59 
 

The indicator is phenomenal!!! This indicator help me to know when pullbacks are happening.I enjoy the enhance features of this indicator because you can add any symbols see the whole market within seconds. I use this indicator with Currency Strength Exotics on the chart and let just say you will be counting PIPS. Bernhard will help with your question and answer each one in punctual time. I highly recommend this indicator to anyone. I appreciated your help Bernhard!!!

batukbhairava
206
batukbhairava 2022.08.10 19:13 
 

Similar to CS28 Dashboard this indicator is a great dashboard which provides the Supply & Demand zones of all 28 pairs in a single window. My only issue with this indicator is that I couldn't resize the windows properly. May be Bernhard could look into this in the next update can design a template which can be resized properly. Also adding & removing currency requires manually typing the currency pairs in the settings. Is it possible if we can use the "Check Box" from the list instead? That will save lot of time As usual great work from Bernhard Thanks and Happy trading to all.. :-)

おすすめのプロダクト
The Th3Eng PipFinite indicator is based on a very excellent analysis of the right trend direction with perfect custom algorithms. It show the true direction and the best point to start trading. With StopLoss point and Three Take Profit points. Also it show the right pivot of the price and small points to order to replace the dynamic support and resistance channel, Which surrounds the price. And Finally it draws a very helpful Box on the left side on the chart includes (take profits and Stop loss
Owl smart levels
Sergey Ermolov
4.24 (37)
MT5版  |   FAQ Owl Smart Levels Indicator   は、 Bill Williams   の高度なフラクタル、市場の正しい波構造を構築する Valable ZigZag、エントリの正確なレベルをマークする Fibonacci レベルなどの一般的な市場分析ツールを含む 1 つのインジケーター内の完全な取引システムです。 利益を得るために市場と場所に。 戦略の詳細な説明 インジケータを操作するための指示 顧問-取引助手 プライベートユーザーチャット ->購入後に私に書いて、私はプライベートチャットにあなたを追加し、あなたはそこにすべてのボーナスをダウンロードすることができます 力はシンプルさにあります! Owl Smart Levels   取引システムは非常に使いやすいので、専門家にも、市場を勉強し始めて自分で取引戦略を選択し始めたばかりの人にも適しています。 戦略と指標に秘密の数式や計算方法が隠されているわけではなく、すべての戦略指標は公開されています。 Owl Smart Levels を使用すると、取引を開始するためのシグナルをすばやく確認し、注
これは、キャンドルの終値を予測する指標です。 このインジケータは、主にD1チャートでの使用を目的としていますが. この指標は、従来の外国為替取引とバイナリオプション取引の両方に適しています。 インジケーターは、スタンドアロンのトレーディングシステムとして使用することも、既存のトレーディングシステムへの追加として機能させることもできます。 このインジケーターは、現在のキャンドルを分析し、キャンドル自体の内部の特定の強度係数と、前のキャンドルのパラメーターを計算します。 したがって、この指標は、市場の動きのさらなる方向性と現在のキャンドルの終値を予測します。 この方法のおかげで、この指標は、短期の日中取引だけでなく、中期および長期の取引にも適しています。 インジケーターを使用すると、市場の状況の分析中にインジケーターが生成する潜在的な信号の数を設定できます。 インジケーターの設定には、このための特別なパラメーターがあります。 また、インジケーターは、チャート上のメッセージの形式で、電子メールで、およびPUSH通知の形式で、新しい信号について通知することができます。 購入後は必ず私に書いて
This is a trend indicator without redrawing Developed instead of the binary options strategy (by the color of the Martingale candlestick) Also works well in forex trading When to open trades (binary options) A signal will appear in the place with a candle signaling the current candle It is recommended to open a deal for one candle of the current timeframe M1 and M5 When a blue dot appears, open a deal up When a red dot appears, open a trade down. How to open trades on Forex. When a signal is rec
「Auto FIBO Pro」Crypto_Forex インジケーターは、取引の補助ツールとして最適です。 - インジケーターは、フィボナッチ レベルとローカル トレンド ライン (赤色) を自動的に計算してチャート上に配置します。 - フィボナッチ レベルは、価格が反転する可能性のある重要な領域を示します。 - 最も重要なレベルは、23.6%、38.2%、50%、61.8% です。 - リバーサル スキャルピングやゾーン グリッド取引に使用できます。 - Auto FIBO Pro インジケーターを使用して、現在のシステムを改善する機会も多数あります。 - Info Spread Swap Display があり、接続されている外国為替ペアの現在のスプレッドとスワップを表示します。 - ディスプレイには、アカウントの残高、エクイティ、マージンも表示されます。 - Info Spread Swap Display は、チャートのどのコーナーにも配置できます。 0 - 左上コーナー、1 - 右上、2 - 左下、3 - 右下。 高品質のトレーディングロボットとインジケーターをご覧にな
Super Reversal Pattern Indicator Unlock the power of advanced pattern recognition with our Super Reversal Pattern Indicator. Designed for traders seeking precision and reliability, this indicator identifies one of the most effective reversal patterns in technical analysis, offering a significant edge in your trading strategy. Key Features: Non-Repainting Accuracy: Enjoy the confidence of non-repainting technology. Once a Super Reversal Pattern is detected, it remains static, providing consiste
Noize Absorption Index - is the manual trading system that measures the difference of pressure between bears forces and bulls forces. Green line - is a noize free index that showing curent situation. Zero value of index shows totally choppy/flat market.Values above zero level shows how powerfull bullish wave is and values below zero measures bearish forces.Up arrow appears on bearish market when it's ready to reverse, dn arrow appears on weak bullish market, as a result of reverse expectation. S
SMC Venom Model BPR インジケーターは、スマート マネー (SMC) コンセプトで取引するトレーダー向けのプロフェッショナル ツールです。価格チャート上の 2 つの主要なパターンを自動的に識別します。 FVG   (フェアバリューギャップ) は、3 本のローソク足の組み合わせで、最初のローソク足と 3 番目のローソク足の間にギャップがあります。ボリュームサポートのないレベル間のゾーンを形成し、価格修正につながることがよくあります。 BPR   (バランス価格範囲) は、2 つの FVG パターンの組み合わせで、「ブリッジ」を形成します。これは、価格がボリュームアクティビティの少ない動きで動くときに、ブレイクアウトしてレベルに戻るゾーンで、ローソク足の間にギャップを作成します。 これらのパターンは、大規模な市場プレーヤーと一般参加者の相互作用が発生するチャート上のボリュームと価格動向の分析に基づいて、トレーダーが主要なサポート/レジスタンス レベル、ブレイクアウト ゾーン、エントリ ポイントを識別するのに役立ちます。 インジケーターは、長方形と矢印の形でパターンを視
VR Cub
Vladimir Pastushak
VR Cub は、質の高いエントリーポイントを獲得するためのインジケーターです。このインジケーターは、数学的計算を容易にし、ポジションへのエントリーポイントの検索を簡素化するために開発されました。このインジケーターが作成されたトレーディング戦略は、長年にわたってその有効性が証明されてきました。取引戦略のシンプルさはその大きな利点であり、初心者のトレーダーでもうまく取引することができます。 VR Cub はポジション開始ポイントとテイクプロフィットとストップロスのターゲットレベルを計算し、効率と使いやすさを大幅に向上させます。取引の簡単なルールを理解するには、以下の戦略を使用した取引のスクリーンショットを見てください。 設定、設定ファイル、デモ版、説明書、問題解決方法は、以下から入手できます。 [ブログ] レビューを読んだり書いたりすることができます。 [リンク] のバージョン [MetaTrader 5] エントリーポイントの計算ルール ポジションをオープンする エントリーポイントを計算するには、VR Cub ツールを最後の高値から最後の安値までストレッチする必要があります。 最初
For sure, this indicator has become very popular amongst traders. Through coding this indicator will give you the most accurate levels possible for your trading analysis. We have also added in the ability for you to receive alerts when the price breaks above or below a Support or Resistance lines! HOW TO USE The red rectangles represent your resistance/supply zone. The green rectangles represent your support/demand zone.  BONUS FEATURES We coded this indicator with the ability to switch between
Indicator Description GOLD TITAN KING SIGNAL INDICATOR High-Precision Gold Scalping Buy/Sell Signals – Manual Trading Assistant Overview The Gold Titan King Signal Indicator is a manual trading assistant tool designed for high-frequency scalping on Gold (XAUUSD) and other major pairs. It generates clear BUY/SELL signals with precise entry levels, along with adjustable Stop Loss and Take Profit levels displayed directly on the chart. ️ This tool is NOT an EA. It does not execute trades
Wave WOLD MT4外国為替インジケータは、Wolf waveを検索し、取引端末の現在のウィンドウに表示するように設計されています。 取引でオオカミの波を使用するトレーダーのための優れた指標。 取引戦略への適用は、効率と収益性を大幅に向上させます。 指標に関する情報 他のWolf wave指標とは異なり、Wave WOLD MT4外国為替指標は、その有効性を大幅に高める多くの機能を備えています: 最初のものは開いているWindows5Pointパラメータ(真の値)情報サポートを提供します。つまり、Wolf waveが登場したチャートのウィンドウを展開します。 たとえば、EURUSD、AUDUSD、GBPUSDチャートが開いていて、それぞれにWave WOLD MT4インジケーターがインストールされている場合、ユーロモデルが検出されると、対応するチャートが自動的に他のチャートの上に前景に表示され、多数の商品を取引するときに非常に便利になります。  2番目の機能は、ユーザーが自分で選択できるパラメータ(デフォルト設定(12,26,9))であるmacd上の組み込みの発散分析です。
サポート線と抵抗線のプロットにうんざりしていませんか? サポートレジスタンス は、非常に興味深いひねりを加えてチャート内のサポートとレジスタンスラインを自動検出およびプロットするマルチタイムフレームインジケーターです。価格レベルは時間とともにテストされ、その重要性が高まるにつれて、ラインは太くなり、暗くなります。 [ インストールガイド | 更新ガイド | トラブルシューティング | よくある質問 | すべての製品 ] 一晩でテクニカル分析を強化 チャートを閲覧せずに重要な価格レベルを検出 一目ですべての価格レベルの相対的な強さを認識する すべての取引で最大30時間のプロットラインを節約 インジケーターは、すべての価格レベルの年齢を表示します インジケーターは再描画されていません 過去および現在の価格レベルは近接によって崩壊し、現在の市場行動に合わせて調整されます。動作は、必ずしもピークではない場所に線が引かれます。 価格レベルは、時間とともに拒否されるにつれて、より暗く、より広くなります ノイズを避けるために、重要でない価格レベルは定期的にクリアされます カスタマイズ可能な時間枠の
What are Heiken Ashi Candles? Heiken Ashi, derived from the Japanese term 'Heikin Ashi,' translates to average price bars. It's an indicator depicting price bars on a chart. Formula for Heiken Ashi candles: - Heiken Ashi opening price: (previous candle's opening + closing price) / 2 - Closing price Heiken Ashi: (opening + high + low + closing) / 4 - Heiken Ashi peak: Max of high, opening, or closing price - Heiken Ashi bottom price: Min of low, opening, or closing price How to Read Heiken A
Trade with Gann on your side!! MASTER CIRCLE 360 CIRCLE CHART, originally created by Gann admitted that this is “The Mother of all charts”. It is one of the last studies that this great trader left for us. The numeric tab le is apparently quite simple like all the tables and is based on square numbers, the SQUARE OF 12 and is by evolution, one of the most important square numbers. Here we can find CYCLE, PRICE AND TIME thanks to angles and grades, to show past and future support and resistance.
This is the FXTraderariel-TakeProfit - Stop Loss Indicator . It provides you 3 potential Take Profits and 1 Stop Loss. These potential targets are computed based on several methods . The indicator can be used on every time frame, but we advise to use it on H1, H4 and D1. Especially if you are a novice trader. Pro Traders can also you use it for scalping in smaller time frames (M1, M5 and M15). This indicator is not a complete trading system. It doesn't provide you a Signal nor can predict the m
The indicator shows the potential trend direction by cyclical-wave dependence. Thus, all the rays of the intersection will be optimal rays, in the direction of which the price is expected to move, taking into account the indicator period. Rays can be used as a direction for potential market movement. But we must not forget that the approach must be comprehensive, the indicator signals require additional information to enter the market.
Crypto_Forex MT4用インジケーター「 RSI SPEED 」は、優れた予測ツールで、リペイント機能はありません。 - このインジケーターの計算は物理学の方程式に基づいています。RSI SPEEDはRSI自体の1次導関数です。 - RSI SPEEDは、主要トレンドの方向にスキャルピングエントリーするのに適しています。 - 適切なトレンドインジケーター(例えばHTF MA(画像参照)など)と組み合わせて使用​​してください。 - RSI SPEEDインジケーターは、R​​SI自体がどれだけ速く方向転換するかを示します。非常に敏感です。 - モメンタムトレード戦略にはRSI SPEEDインジケーターの使用をお勧めします。RSI SPEEDインジケーターの値が0未満の場合は価格モメンタムが下降し、RSI SPEEDインジケーターの値が0を超える場合は価格モメンタムが上昇します。 - インジケーターにはモバイルとPCのアラートが組み込まれています。 高品質のトレーディングロボットとインジケーターをご覧になるにはここをクリックしてください! これは、このMQL5ウェブサイトで
Crypto_Forex MT4用インジケーター「WPRと2つの移動平均線」、リペイント機能なし。 - WPR自体はスキャルピングに最適なオシレーターの1つです。 - 「WPRと2つの移動平均線」インジケーターを使用すると、WPRオシレーターの高速移動平均線と低速移動平均線を確認できます。 - このインジケーターを使用すると、価格調整を早期に把握できます。 - このインジケーターはパラメータで簡単に設定でき、どの時間枠でも使用できます。 - 買いと売りのエントリー条件は画像で確認できます。 - 買いシグナルの条件を検討します。 (1) - 高速移動平均線が低速移動平均線を上向きにクロスし、WPR値が-50を下回っている場合:買いトレードを開きます。 (2) - WPR値が-20を超える買われすぎゾーンにある場合:買いトレードを終了します。 (3) - 売りトレードの場合はその逆です。 // 優れたトレーディングロボットとインジケーターは、こちらから入手できます: https://www.mql5.com/en/users/def1380/seller これは、このMQL5ウェブサ
トレンドオシレーターは、高度なカスタム Crypto_Forex インジケーター、効率的な取引ツールです! - 高度な新しい計算方法を使用 - パラメーター「計算価格」のオプションは 20 種類。 - これまで開発された中で最もスムーズなオシレーター。 - 上昇トレンドの場合は緑色、下降トレンドの場合は赤色。 - 売られすぎの値: 5 未満、買われすぎの値: 95 以上。 - このインジケーターを使用すると、標準戦略をアップグレードする機会が十分にあります。 - PC およびモバイルアラート付き。 高品質のトレーディングロボットとインジケーターをご覧になるにはここをクリックしてください! これは、この MQL5 Web サイトでのみ提供されるオリジナル製品です。
The indicator displays the data of the Stochastic oscillator from a higher timeframe on the chart. The main and signal lines are displayed in a separate window. The stepped response is not smoothed. The indicator is useful for practicing "manual" forex trading strategies, which use the data from several screens with different timeframes of a single symbol. The indicator uses the settings that are identical to the standard ones, and a drop-down list for selecting the timeframe. Indicator Paramet
TWO PAIRS SQUARE HEDGE METER INDICATOR Try this brilliant 2 pairs square indicator It draws a square wave of the relation between your two inputs symbols when square wave indicates -1 then it is very great opportunity to SELL pair1 and BUY Pair2 when square wave indicates +1 then it is very great opportunity to BUY pair1 and SELL Pair2 the inputs are : 2 pairs of symbols         then index value : i use 20 for M30 charts ( you can try other values : 40/50 for M15 , : 30 for M30 , : 10 for H1 ,
We present you the indicator "Candle closing counter", which will become your indispensable assistant in the world of trading. That’s why knowing when the candle will close can help: If you like to trade using candle patterns, you will know when the candle will be closed. This indicator will allow you to check if a known pattern has formed and if there is a possibility of trading. The indicator will help you to prepare for market opening and market closure. You can set a timer to create a pre
"The trend is your friend" is one of the best known sayings in investing, because capturing large trendy price movements can be extremely profitable. However, trading with the trend is often easier said than done, because many indicators are based on price reversals not trends. These aren't very effective at identifying trendy periods, or predicting whether trends will continue. We developed the Trendiness Index to help address this problem by indicating the strength and direction of price trend
Are you tired of the uncertainty that arises when your orders fail to stop at a specific line due to the spread? Look no further! Introducing our  indicator that plots candlesticks based on the Ask price instead of the traditional bid-based chart commonly used in MQL4. With this indicator, you can say goodbye to the frustrations caused by the bid-based chart, as it provides you with a more accurate representation of market movements. By utilizing the Ask price, which represents the price at whic
In the stock market technical analysis, support and resistance is a concept that the movement of the price of a security will tend to stop and reverse at certain predetermined price levels. Support and resistance levels can be identified on any timeframe. However, the most significant ones are found on the higher time frames, such as daily, weekly, and monthly. This indicator using the weekly OHLC data to identify the relevant levels. This is a support and resistance indicator and providing majo
[ZhiBiCCI]インディケータは全てのサイクル使用に適しており、そして全ての市場品種にも適しています。 [ZhiBiCCI]緑色の実線は強気の発散の逆転です。緑色の点線は古典的な強気の発散です。 [ZhiBiCCI]赤への実線は逆弱気の発散である。赤い点線は古典的な弱気の発散です。 [ZhiBiCCI]はパラメータ(アラート、メール送信、通知送信)で設定でき、(true)に設定するとインスタント信号をアラームウィンドウに送信し、Eメール、インスタントメッセージを送信できます。 パラメータ設定の説明 [displayAlert]:これはアラームスイッチで、trueに設定され、矢印が表示されればプロンプトに自動的に警告され、falseに設定されれば警告されません。 [sendmail_NO_OFF]:これはメールを送信するためのスイッチで、trueに設定します。矢印が表示されていればMT4で設定したメールボックスにメールを送信し、falseに設定されていればメールを送信しません。 [sendnotification_NO_OFF]:これはインスタントメッセージを送信するた
The Point61 indicator is the result of many years of monitoring of price behavior of currency pairs and metals. It is not a secret, that in times of uncertainty, traders are looking for possible levels of support and resistance - the point, where price should stop its movement. There are 2 possible scenarios at these points: 1. Reverse (correction) to the opposite direction; 2. Breakthrough to continue movement. Very often these points are used to set stop orders - TakeProfit or StopLoss
Rainbow Price Visualizer v1.21 See where the market really breathes. Turns your MT4 chart into an ultra-precise heatmap that highlights price zones favored by big players. Why it matters 300 price levels at 0.2‑pip resolution — microscopic detail. 8 visual themes (Rainbow, Fire, Ocean…) for instant readibility. Smart opacity: low noise fades, real zones pop. Lightweight rendering with automatic cleanup. Fully customizable: saturation, opacity, resolution, history depth. Bands project into the f
SimSim Arrow Momentum は標準的な「Momentum」インジケーターですが、矢印バージョンになっています。 MetaTrader 5用バージョン インジケータ パラメータは標準のパラメータと同様ですが、さらに 1 つの追加パラメータ Delta があります。 Delta = 0 - 100 100 値を基準とした偏差。 100インジケーターのレベル変更、プラス、マイナスが可能です。 このインジケーターは、価格がレベル ライン = 100 +- Delta を横切るとシグナルを生成します。 操作に対して「CONTROL DEAL」を有効にすると、インジケーター信号に基づいた取引が自動的に開始されます。 インジケーターは、信頼性の高い信号装置として本来の目的に沿って使用できます。 ただし、その二次的な目的は、「 CONTROL DEAL 」ユーティリティのシグナルプロバイダーとして機能することです。 インジケーターとこのユーティリティの共生により、シグナルを確認するだけでなく、それに従って取引を行うこともできます。 これらのシグナルを効果的に活用したい場合は、無
このプロダクトを購入した人は以下も購入しています
Meravith
Ivan Stefanov
5 (1)
このインジケーターは、各ポイントのボリュームを分析し、そのボリュームに対する市場の疲労レベルを計算します。 インジケーターは3本のラインで構成されています: 強気のボリューム疲労ライン 弱気のボリューム疲労ライン 市場のトレンドを示すライン。このラインは、市場が強気か弱気かに応じて色が変わります。 任意の開始点から市場を分析できます。一度ボリューム疲労ラインに達したら、次の分析を開始するための新しいポイントを設定してください。 トレンドや修正を分析できます。良いアプローチは、トレンドラインに達したときや、トップやボトムがヒットしたときにインジケーターを移動させることです。 トレンドラインとボリューム疲労ラインの距離が大きいほど、その方向のボリュームは大きくなります。 トレンドラインはオーダーを開く場所として使用でき、疲労ラインは利益を取るために使用されます。 このシステムは非常にユニークですが、非常に直感的でもあります。 市場には同様の製品はありません。 使用に制限はありません。すべての市場およびすべての時間枠で適用できます。 重要:MetaTrader4のテスターで確認する際は、紫色
Looking for a powerful yet lightweight swing detector that accurately identifies market structure turning points? Want clear, reliable buy and sell signals that work across any timeframe and any instrument? Buy Sell Arrow MT Swing is built exactly for that — precision swing detection made simple and effective. This indicator identifies Higher Highs (HH) , Higher Lows (HL) , Lower Highs (LH) , and Lower Lows (LL) with remarkable clarity. It is designed to help traders easily visualize market str
Dynamic Forex28 Navigator - 次世代の Forex 取引ツール。 現在 49% オフ。 Dynamic Forex28 Navigator は、長年人気のインジケーターを進化させたもので、3 つの機能を 1 つにまとめています。 Advanced Currency Strength28 インジケーター (レビュー 695 件)  + Advanced Currency IMPULSE with ALERT (レビュー 520 件) + CS28 コンボ シグナル (ボーナス)。 インジケーターの詳細 https://www.mql5.com/en/blogs/post/758844 次世代の Strength インジケーターが提供するもの  オリジナルで気に入っていたすべての機能が、新機能と精度の向上によって強化されました。 主な機能: 独自の通貨強度計算式。 すべての時間枠でスムーズかつ正確な強度ライン。 トレンドの特定と正確なエントリーに最適です。 ダイナミックマーケットフィボナッチレベル (マーケットフィボナッチ)。 このインジケーターに固有
「 Dynamic Scalper System 」インジケーターは、トレンド波の中でスキャルピング取引を行う手法のために設計されています。 主要通貨ペアと金でテスト済みで、他の取引商品との互換性があります。 トレンドに沿った短期的なポジションオープンのシグナルを提供し、追加の価格変動サポートも提供します。 インジケーターの原理 大きな矢印はトレンドの方向を決定します。 トレンド波の中では、小さな矢印の形でスキャルピングシグナルを生成するアルゴリズムが機能します。 赤い矢印は強気方向、青い矢印は弱気方向です。 トレンドの方向には敏感な価格変動ラインが描かれ、小さな矢印のシグナルと連動します。 シグナルは次のように機能します。適切なタイミングでラインが現れるとエントリーシグナルが形成され、ラインが開いている間はポジションが保持され、完了すると取引が終了します。 推奨される動作時間枠はM1~H4です。 矢印は現在のローソク足に形成され、次のローソク足が開いている場合は、前のローソク足の矢印は再描画されません。 入力パラメータ Trend Wave Period - トレンド方向
The Nihilist 5.0 Indicator includes Forexalien and Nihilist Easy Trend trading strategies and systems. It is composed of an MTF Dashboard where you can analyze the different input possibilities of each strategy at a glance. It has an alert system with different types of configurable filters. You can also configure which TF you want to be notified on your Metatrader 4 platform and Mobile application The indicator has the option to view how could be a TP and SL by using ATR or fixed points, even w
The BB Reversal Arrows technical trading system has been developed to predict reverse points for making retail decisions. The current market situation is analyzed by the indicator and structured for several criteria: the expectation of reversal moments, potential turning points, purchase and sale signals. The indicator does not contain excess information, has a visual understandable interface, allowing traders to make reasonable decisions. All arrows appear to close the candle, without redrawin
このインジケーターは実践的なトレードに最適な自動波動分析のインジケーターです! 場合... 注:   Tang Lun (Tang Zhong Shuo Zen) の命名規則の影響で、私は波のグレーディングに西洋の名前を使用することに慣れていません。基本的な波を ペン 、二次波のバンドを セグメント と名付けました。同時に、 セグメント にはトレンドの方向が指定されます (この命名方法は将来のノートで使用されます。最初に言っておきます)。ただし、アルゴリズムは曲がりくねった理論とはほとんど関係がないため、付けるべきではありません。これは、私の市場分析 によって要約された、絶えず変化する複雑な運用ルール を反映しています。 バンドは標準化され、人によって異なることがないよう定義されており、市場参入を厳密に分析する上で重要な役割を果たす人為的な干渉の描画方法が排除されています。 このインジケーターを使用することは、取引インターフェイスの美しさを改善することと同等であり、元の K ライン取引を放棄し、取引の新しいレベルに連れて行きます。また、宣伝の観点から顧客の認識も向上します。 イ
NAM Order Blocks
NAM TECH GROUP, CORP.
3.67 (3)
MT4マルチタイムフレームオーダーブロック検出インジケーター。 特徴 -チャートコントロールパネルで完全にカスタマイズ可能で、完全な相互作用を提供します。 -必要な場所でコントロールパネルを表示および非表示にします。 -複数の時間枠でOBを検出します。 -表示するOBの数量を選択します。 -さまざまなOBユーザーインターフェイス。 -OBのさまざまなフィルター。 -OB近接アラート。 -ADRの高線と低線。 -通知サービス(画面アラート|プッシュ通知)。 概要 注文ブロックは、金融機関や銀行からの注文収集を示す市場行動です。著名な金融機関と中央銀行が外国為替市場を牽引しています。したがって、トレーダーは市場で何をしているのかを知る必要があります。市場が注文ブロックを構築するとき、それは投資決定のほとんどが行われる範囲のように動きます。 注文の構築が完了すると、市場は上向きと下向きの両方に向かって急激に動きます。注文ブロック取引戦略の重要な用語は、機関投資家が行っていることを含むことです。それらは主要な価格ドライバーであるため、機関投資家の取引を含むあらゆる戦
OrderFlow Absorption – MT4用プロフェッショナル・デルタ&アブソープションシグナルインジケーター OrderFlow Absorptionで本物のオーダーフロー分析の力を解き放ちましょう。MetaTrader 4向けの究極のデルタヒストグラム&アブソープションシグナルインジケーターです。あらゆる価格変動の裏側で何が起きているのかを知りたいトレーダーのために設計されており、市場を動かす隠れた買い/売り圧力や吸収イベントを明らかにします。 特徴 デルタヒストグラムの可視化:   買い圧力・売り圧力を色分けされたヒストグラムで即座に表示。 アブソープションシグナル検出:   高度なロジックで強気・弱気の吸収イベントを特定し、反転の兆しを早期に通知。 チャートマーカー:   吸収シグナルをチャート上に直接マークし、視覚的に分かりやすく表示。 ポップアップアラート:   新しい吸収シグナルが出現した際にリアルタイムで通知。 カスタマイズ可能な閾値:   弱いシグナルを除外し、高確率のセットアップに集中。 リソース管理:   大きなチャートでも高速に動作する効率的な計算。
ゴールドラッシュ・トレンド・アロー・シグナル ゴールドラッシュ・トレンド・アロー・シグナル 指標は、XAU/USDにおける高速・短期スキャルパー向けに最適化された、正確でリアルタイムのトレンド分析を提供します。 1分足専用に設計されたこのツールは、明確なエントリーポイントを示す方向矢印を表示し、スキャルパーが変動の激しい市場状況でも自信を持って取引できるよう支援します。 この指標は、PRIMARY(主要)とSECONDARY(補助)のアラート矢印で構成されています。PRIMARYシグナルは、トレンドの方向転換を示す白と黒の方向矢印であり、SECONDARYシグナルは、PRIMARY矢印が示す方向を確認し、潜在的なエントリーポイントを示す青と赤の矢印です。 注意:トレンド方向の変化後にPRIMARYアラート矢印が1つだけ表示される場合、複数のSECONDARY青/赤矢印が表示される点に注意が必要です。SECONDARYシグナルは、シグナル基準を満たす任意のローソク足後に表示されます。したがって、長期的なトレンド移動の場合、画面に多くのSECONDARY矢印が表示されます(添付の
The Super Arrow Indicator provides non-repainting buy and sell signals with exceptional accuracy. Key Features No repainting – confirmed signals remain fixed Clear visual arrows: green for buy, red for sell Real-time alerts via pop-up, sound, and optional email Clean chart view with no unnecessary clutter Works on all markets: Forex, gold, oil, indices, crypto Adjustable Parameters TimeFrame Default: "current time frame" Function: Sets the time frame for indicator calculation Options: Can be set
収益性の高い取引機会を簡単に特定するのに役立つ強力な外国為替取引インジケーターをお探しですか?ビースト スーパー シグナル以外に探す必要はありません。 この使いやすいトレンドベースのインジケーターは、市場の状況を継続的に監視し、新しいトレンドを検索したり、既存のトレンドに飛びついたりします。ビースト スーパー シグナルは、すべての内部戦略が一致し、互いに 100% 合流したときに売買シグナルを発するため、追加の確認は不要です。シグナル矢印アラートを受け取ったら、単に売買します。 購入後、プライベート VIP グループに追加されるようにメッセージを送ってください! (完全な製品購入のみ)。 購入後、最新の最適化されたセット ファイルについてメッセージを送ってください。 MT5バージョンは こちらから入手できます。 Beast Super Signal EA は こちらから 入手できます。 コメント セクションをチェックして、最新の結果を確認してください。 ビースト スーパー シグナルは、1:1、1:2、または 1:3 のリスクと報酬の比率に基づいて、エントリー価格、ストッ
Elliott Wave Trend was designed for the scientific wave counting. This tool focuses to get rid of the vagueness of the classic Elliott Wave Counting using the guideline from the template and pattern approach. In doing so, firstly Elliott Wave Trend offers the template for your wave counting. Secondly, it offers Wave Structural Score to assist to identify accurate wave formation. It offers both impulse wave Structural Score and corrective wave Structure Score. Structural Score is the rating to sh
Algo Trading Indicaor  With this indicator , you’ll have zones and trends that hight probability the price will reverse from it. so will gives you all the help that you need  Why should you join us !?  1-This indicator is logical since it’s working in previous days movement , to predict the future movements. 2-Algo trading indicator will help you to draw trends which is special and are too strong than the basics trend , trends will change with the frame time that you work on . 3-We can use
素晴らしいバックテスト 、驚異的な数字を伴う ライブ口座実績の証明 、そして あらゆる場所での統計結果 を備えたトレーディングインジケーターを購入したにもかかわらず、使用後に 口座を破綻させてしまった 経験は何度ありますか? シグナルを単独で信用すべきではありません。なぜそのシグナルが最初に現れたのかを知る必要があります。そして、それがRelicusRoad Proが最も得意とすることです! ユーザーマニュアル + 戦略 + トレーニングビデオ + VIPアクセス付きプライベートグループ + モバイル版利用可能 市場を見る新しい方法 RelicusRoadは、FX、先物、暗号通貨、株式、指数向けの「 世界で最も強力で最高の取引インジケーター 」であり、トレーダーが 口座を成長させる ために必要なすべての情報とツールを提供します。「 テクニカル分析 」と「 取引計画 」を提供し、「 初心者 」から「 上級者 」まで、「 すべてのトレーダーの成功 」を支援します。 これは、将来の市場を「 予測 」するのに十分な情報を提供する「 主要な取引インジケーター 」です。意味をなさない複数の異な
まず第一に、この取引ツールはノンリペイント、ノンリドロー、ノンラグの指標であり、プロの取引に理想的ですことを強調する価値があります。 オンラインコース、ユーザーマニュアル、デモ。 スマートプライスアクションコンセプトインジケーターは、新米から経験豊富なトレーダーまで、非常 に強力なツールです。Inner Circle Trader AnalysisやSmart Money Concepts Trading Strategiesなど、20以上の有用な指標を1つに組み合わせています。このインジケーターはスマートマネーコンセプトに焦点を当て、大手機関の取引方法を提供し、彼らの動きを予測するのに役立ちます。 特に、流動性分析に優れており、機関がどのように取引しているかを理解しやすくしています。市場のトレンドを予測し、価格の動きを慎重に分析するのに優れています。機関の戦略とトレードを合わせることで、市場の動向についてより正確な予測ができます。このインジケーターは多目的であり、市場構造を分析し、重要な注文ブロックを特定し、さまざまなパターンを認識するのに優れています。 このインジケーターは
Product Description Rtc ML Ai Predictor — Futuristic Intelligence for Real-Time Market Decisions Bring robotic precision to your trading.   Rtc ML Ai Predictor   fuses   Machine Learning   with   SMA-shift dynamics   to forecast short-term momentum and trend inflection points with clarity. The model evaluates multi-factor market structure, assigns a   confidence score   to each signal, and lets you act only when conditions align with your rules. Why traders choose Rtc ML Ai Predictor AI-guided e
ECM Elite Channel is a volatility-based indicator, developed with a specific time algorithm, which consists of finding possible corrections in the market. This indicator shows two outer lines, an inner line (retracement line) and an arrow sign, where the channel theory is to help identify overbought and oversold conditions in the market. The market price will generally fall between the boundaries of the channel. If prices touch or move outside the channel, it's a trading opportunity. The ind
Introduction to Fractal Pattern Scanner Fractal Indicator refers to the technical indicator that makes use of the fractal geometry found in the financial market. Fractal Pattern Scanner is the advanced Fractal Indicator that brings the latest trading technology after the extensive research and development work in the fractal geometry in the financial market. The most important feature in Fractal Pattern Scanner is the ability to measure the turning point probability as well as the trend probabi
Introducing the Delta Volume Profile Indicator - Unleash the Power of Institutional Precision!  Technical Indicator: Are you ready to trade like the pros? The Delta Volume Profile Indicator is no ordinary tool. It’s a high-precision, cutting-edge indicator that puts the power of institutional-grade trading in your hands. This unique indicator analyses delta volume distribution in real-time, revealing the market's hidden buy/sell imbalances that the biggest financial institutions rely on to antic
アルティメット・アロー・インディケーター - トレーディング成功へのあなたのツール! 多くを約束し、少ししか提供しないツールに疲れましたか?MT4用の「アルティメット・アロー・インディケーター」は、あなたのトレーディングを次のレベルへと引き上げる最終的な解決策です。このインディケーターは、明確で信頼性の高い、妥協のないシグナルを提供するために精密に設計されました。なぜ「アルティメット・アロー・インディケーター」が経験豊富なトレーダーにも初心者にも最適な選択肢であるかをご紹介します: 素晴らしいパフォーマンス - 実績証明済み 1年間の詳細なバックテスト:勝率90%で、このインディケーターは利益を生み出すことに非常に信頼できることが証明されています。7,006個のシグナル中、6,242個が勝利し、シグナルごとに平均29ピップの利益を上げました。 損失率の最小化:生成されたシグナルのうち、わずか10%が負の結果となり、アルゴリズムの精度と品質を証明しています。 主な特徴 リペイントなし :一度生成されたシグナルは変更されません、透明性が保証されます。 遅延なし :リアルタイムで計算し、市
Supreme Commander
Ramon Sobrevals Arce
4.13 (8)
The indicator of the indicators. The Most Powerful Technique to Determine Forex Trend Strength in 2023. We have perfected Supreme Commander that it calculates an average of the selected indicators (up to 16) and the selected timeframe (all) with the result of a single trend that indicates the potential of buying and selling.  It includes the following indicators: Accelerator/Decelerator oscillator Average Directional Movement Index Awesome oscillator; Bulls and Bears  Commodity Channel Index; De
BinaryUniversal is a signal indicator for binary options and Forex. In its work, the indicator uses a complex algorithm for generating signals. Before forming a signal, the indicator analyzes volatility, candlestick patterns, important support and resistance levels. The indicator has the ability to adjust the accuracy of the signals, which makes it possible to apply this indicator for both aggressive and conservative trading. The indicator is set in the usual way, it works on any time period and
Introduction to X3 Chart Pattern Scanner X3 Cherart Pattern Scanner is the non-repainting and non-lagging indicator detecting X3 chart patterns including Harmonic pattern, Elliott Wave pattern, X3 patterns, and Japanese Candlestick patterns. Historical patterns match with signal patterns. Hence, you can readily develop the solid trading strategy in your chart. More importantly, this superb pattern scanner can detect the optimal pattern of its kind. In addition, you can switch on and off individu
"Dragon's Tail" is an integrated trading system, not just an indicator. This system analyzes each candle on a minute-by-minute basis, which is particularly effective in high market volatility conditions. The "Dragon's Tail" system identifies key market moments referred to as "bull and bear battles". Based on these "battles", the system gives trade direction recommendations. In the case of an arrow appearing on the chart, this signals the possibility of opening two trades in the indicated directi
An extremely convenient indicator that truly makes the process of making money on the exchange easy. It is based on the scientifically rigorous theory of the market developed by the author, the beginning of which is presented here .                The full algorithm of this indicator operation is presented in the article .               The indicator calculates the most probable price movement trajectory and displays it on the chart. Based on the predicted price movement trajectory
Super Signal – Skyblade Edition プロ仕様のノンリペイント / ノーラグ・トレンドシグナルシステム。卓越した勝率を実現 | MT4 / MT5 対応 主な特徴: Super Signal – Skyblade Edition は、トレンド取引に特化したスマートなシグナルシステムです。マルチレイヤーのフィルターロジックを用いて、明確な方向性と実際のモメンタムに支えられた強力なトレンドのみを検出します。 このシステムは 天井や底を予測するものではありません 。次の3つの条件がすべて満たされた場合にのみシグナルを発生させます: 明確なトレンド方向 モメンタムの増加 健全なボラティリティ構造 市場セッションに基づく流動性分析と組み合わせることで、シグナルの精度とタイミングがさらに向上します。 シグナルの特性: すべての矢印シグナルは 100% 非リペイント / 遅延なし 一度出現したシグナルは固定され、点滅・消失しません チャート上の矢印、情報パネル、ポップアップ通知、音声アラート、プッシュ通知に対応 EAとの統合が可能(バッファ出力対応)、自動売買やシグナル
ヒット率トップボトムシグナル ヒット率トップボトムシグナル ヒット率トップボトムシグナル は、完全に革新的なアプローチを提供します。 特定のTP-SLとPAIRS/TFで最も優れたパフォーマンスを発揮する方法を事前に評価したい方に理想的です。 ヒット率トップボトムシグナル 戦略は、 すべてのトレーダーとトレードスタイル にとって基本的なツールです。これは、 リペイントしない精度の高いシグナル を提供し、どのタイミングでどの方向に取引するかを明確に示すだけでなく、各通貨ペアとTFの ヒット率を詳細に記録 し、あらかじめ設定されたテイクプロフィット(TP)とストップロス(SL)を提供するためです。 これにより、シグナルの有効性の比率を事前に知ることができ 、リスク管理と正確な取引に非常に重要です。 この戦略の特徴は、全体的な動きではなく、インパルス内のリバーサルポイントの検出に焦点を当てている点で、従来のトップボトムよりも頻繁にシグナルが発生し、 市場の重要な各変動のキーとなる瞬間に焦点を当てています。 このシグナルの歴史的な効果を%で表示する SL/TP比率との組み合わせ により、こ
First time on MetaTrader, introducing IQ Star Lines - an original Vedic Astrology based indicator. IQ Star Lines, an unique astrological indicator purely based on   Vedic astrology   calculations, published for the   first time on Metatrader.  This unique tool plots dynamic planetary grid lines based on real-time stars, constellations, and celestial movements, which allows you to plot the power of the cosmos directly onto your trading charts. This indicator is specifically designed for scalpers
Gold Channel is a volatility-based indicator, developed with a specific timing algorithm for the XAUUSD pair, which consists of finding possible corrections in the market. This indicator shows two outer lines, an inner line (retracement line) and an arrow sign, where the theory of the channel is to help identify overbought and oversold conditions in the market. The market price will generally fall between the boundaries of the channel. If prices touch or move outside the channel it is a tradi
作者のその他のプロダクト
現在20%OFF! 初心者やエキスパートトレーダーのためのベストソリューション! このダッシュボードソフトウェアは、28の通貨ペアで動作しています。それは私達の主要な指標(高度な通貨の強さ28と高度な通貨インパルス)の2に基づいています。それは全体の外国為替市場の大きい概観を与えます。それは、すべての(9)時間枠で28の外国為替ペアのための高度な通貨の強さの値、通貨の動きの速度と信号を示しています。チャート上で1つのインディケータを使用して市場全体を観察し、トレンドやスキャルピングの機会をピンポイントで見つけることができたら、あなたのトレードがどのように改善されるか想像してみてください。 このインディケータには、強い通貨と弱い通貨の識別、潜在的な取引の識別と確認がより簡単になるような機能が搭載されています。このインディケータは、通貨の強さや弱さが増加しているか減少しているか、また、すべての時間枠でどのように機能しているかをグラフィカルに表示します。 新機能として、現在の市場環境の変化に適応するダイナミックなマーケットフィボナッチレベルが追加され、すでに当社のAdvanced
Advanced Supply Demand
Bernhard Schweigert
4.91 (296)
現在33%オフ 初心者にもエキスパートトレーダーにも最適なソリューション このインジケーターは独自の機能と新しい公式を多数内蔵しており、ユニークで高品質かつ手頃な取引ツールです。このアップデートでは、2つの時間枠ゾーンを表示できるようになります。より長いTFだけでなく、チャートTFとより長いTF(ネストゾーンを表示)の両方を表示できます。すべてのSupply Demandトレーダーの皆さんのお気に召すはずです。:) 重要情報の公開 Advanced Supply Demandの可能性を最大化するには、 https://www.mql5.com/ja/blogs/post/720245 にアクセスしてください。   エントリーまたはターゲットの正確なトリガーポイントを正確に特定できれば取引がどのように改善されるか想像してみてください。新しい基盤となるアルゴリズムに基づいて構築されているため、買い手と売り手の間の潜在的な不均衡をさらに簡単に特定できます。これは、最も強い需要と供給のゾーンと、過去のパフォーマンス(古いゾーンを表示)がグラフィカルに表現されるためです。これらの機能は、最適な
現在20%OFF! 初心者やエキスパートトレーダーに最適なソリューションです。 このインディケータは、エキゾチックペア・コモディティ・インデックス・先物など、あらゆるシンボルの通貨の強さを表示することに特化したインディケータです。金、銀、原油、DAX、US30、MXN、TRY、CNHなどの通貨の強さを表示するために、9行目にどのシンボルでも追加することができます。独自の機能を多数搭載し、新しい計算式を採用したため、ユニークで高品質、かつ手頃な価格のトレーディングツールとなっています。新しいトレンドやスキャルピングチャンスのトリガーポイントを正確に把握することができるため、あなたのトレードがどのように改善されるか想像してみてください。 ユーザーマニュアル:ここをクリック   https://www.mql5.com/en/blogs/post/708876 すべての時間枠に対応します。あなたはすぐにトレンドを見ることができるようになります! 新しいアルゴリズムに基づいて設計されているため、潜在的な取引の特定と確認がより簡単になります。これは、8つの主要通貨と1つのシンボルの強弱
Dynamic Forex28 Navigator - 次世代の Forex 取引ツール。 現在 49% オフ。 Dynamic Forex28 Navigator は、長年人気のインジケーターを進化させたもので、3 つの機能を 1 つにまとめています。 Advanced Currency Strength28 インジケーター (レビュー 695 件)  + Advanced Currency IMPULSE with ALERT (レビュー 520 件) + CS28 コンボ シグナル (ボーナス)。 インジケーターの詳細 https://www.mql5.com/en/blogs/post/758844 次世代の Strength インジケーターが提供するもの  オリジナルで気に入っていたすべての機能が、新機能と精度の向上によって強化されました。 主な機能: 独自の通貨強度計算式。 すべての時間枠でスムーズかつ正確な強度ライン。 トレンドの特定と正確なエントリーに最適です。 ダイナミックマーケットフィボナッチレベル (マーケットフィボナッチ)。 このインジケーターに固有
現在26%オフ 初心者やエキスパートトレーダーに最適なソリューション! このインジケーターは、独自の機能と新しい計算式を取り入れた、ユニークで高品質、かつ手頃な価格のトレーディングツールです。たった1枚のチャートで28の為替ペアの通貨強度を読み取ることができます。新しいトレンドやスキャルピングチャンスの引き金となるポイントを正確に特定することができるので、あなたのトレードがどのように改善されるか想像してみてください。 ユーザーマニュアルはこちら  https://www.mql5.com/en/blogs/post/697384 これが最初の1本、オリジナルだ! 価値のないクローンを買わないでください。 特別な サブウィンドウの矢印で強い通貨の勢いを表示 GAPがあなたのトレードを導く! 基準通貨や気配値が売られすぎ・買われすぎのゾーン(外相フィボナッチレベル)にあるとき、個別チャートのメインウィンドウに警告表示。 通貨がレンジの外側から反落した場合、プルバック/リバーサルのアラート。 クロスパターンの特別なアラート 複数の時間枠を選択可能で、トレンドを素早く確認できます
初心者やエキスパートトレーダーに最適なソリューション! このインジケーターは、独自の機能と新しい計算式を取り入れた、ユニークで高品質、かつ手頃な価格のトレーディングツールです。たった1枚のチャートで28の為替ペアの通貨強度を読み取ることができます。新しいトレンドやスキャルピングチャンスの引き金となるポイントを正確に特定することができるので、あなたのトレードがどのように改善されるか想像してみてください。 ユーザーマニュアルはこちら  https://www.mql5.com/en/blogs/post/697384 これが最初の1本、オリジナルだ! 価値のないクローンを買わないでください。 特別な サブウィンドウの矢印で強い通貨の勢いを表示 GAPがあなたのトレードを導く! 基準通貨や気配値が売られすぎ・買われすぎのゾーン(外相フィボナッチレベル)にあるとき、個別チャートのメインウィンドウに警告表示。 通貨がレンジの外側から反落した場合、プルバック/リバーサルのアラート。 クロスパターンの特別なアラート 複数の時間枠を選択可能で、トレンドを素早く確認できます。通貨強度のライン
現在31%オフ! 初心者やエキスパートトレーダーに最適なソリューション! このインジケータは、独自の機能と秘密の数式を組み込んだ、ユニークで高品質かつ手頃な価格のトレーディングツールです。たった1枚のチャートで28の通貨ペアのアラートを表示します。新しいトレンドやスキャルピングチャンスの引き金となるポイントを正確に把握することができるので、あなたのトレードがどのように改善されるか想像してみてください! 新しい基本的なアルゴリズムに基づいて構築されているため、潜在的な取引の特定と確認がより簡単になります。これは、通貨の強さや弱さが加速しているかどうかをグラフィカルに表示し、その加速のスピードを測定するためです。加速すると物事は明らかに速く進みますが、これはFX市場でも同じです。つまり、反対方向に加速している通貨をペアにすれば、利益を生む可能性のある取引を特定することができるのです。 通貨の勢いを示す縦の線と矢印は、あなたの取引の指針となるでしょう。 ダイナミックマーケットフィボナッチ23レベルはアラートトリガーとして使用され、市場の動きに適応します。もしインパルスが黄色のトリガ
現在33%オフ 初心者にもエキスパートトレーダーにも最適なソリューション このインジケーターは独自の機能と新しい公式を多数内蔵しており、ユニークで高品質かつ手頃な取引ツールです。このアップデートでは、2つの時間枠ゾーンを表示できるようになります。より長いTFだけでなく、チャートTFとより長いTF(ネストゾーンを表示)の両方を表示できます。すべてのSupply Demandトレーダーの皆さんのお気に召すはずです。:) 重要情報の公開 Advanced Supply Demandの可能性を最大化するには、 https://www.mql5.com/ja/blogs/post/720245 にアクセスしてください。   エントリーまたはターゲットの正確なトリガーポイントを正確に特定できれば取引がどのように改善されるか想像してみてください。新しい基盤となるアルゴリズムに基づいて構築されているため、買い手と売り手の間の潜在的な不均衡をさらに簡単に特定できます。これは、最も強い需要と供給のゾーンと、過去のパフォーマンス(古いゾーンを表示)がグラフィカルに表現されるためです。これらの機能は、最適な
初心者やエキスパートトレーダーに最適なソリューション! このインジケータは、独自の機能と秘密の数式を組み込んだ、ユニークで高品質かつ手頃な価格のトレーディングツールです。たった1枚のチャートで28の通貨ペアのアラートを表示します。新しいトレンドやスキャルピングチャンスの引き金となるポイントを正確に把握することができるので、あなたのトレードがどのように改善されるか想像してみてください! 新しい基本的なアルゴリズムに基づいて構築されているため、潜在的な取引の特定と確認がより簡単になります。これは、通貨の強さや弱さが加速しているかどうかをグラフィカルに表示し、その加速のスピードを測定するためです。加速すると物事は明らかに速く進みますが、これはFX市場でも同じです。つまり、反対方向に加速している通貨をペアにすれば、利益を生む可能性のある取引を特定することができるのです。 通貨の勢いを示す縦の線と矢印は、あなたの取引の指針となるでしょう。 ダイナミックマーケットフィボナッチ23レベルはアラートトリガーとして使用され、市場の動きに適応します。もしインパルスが黄色のトリガーラインに当たった場
GOLD Impulse with Alert
Bernhard Schweigert
4.64 (11)
このインディケータは、当社の2つの製品 Advanced Currency IMPULSE with ALERT  +   Currency Strength Exotics . のスーパーコンビネーションです。 このインジケーターは全ての時間枠で作動し、8つの主要通貨と1つのシンボルの強弱のインパルスをグラフで表示します。 このインジケータは、金、エキゾチックペア、商品、インデックス、先物など、あらゆるシンボルの通貨強度の加速度を表示することに特化されています。金、銀、原油、DAX、US30、MXN、TRY、CNHなどの通貨強度の加速度(インパルスまたは速度)を表示するために、任意のシンボルを9行目に追加できる、この種の最初のものです。 新しいアルゴリズムに基づいて構築され、潜在的な取引の特定と確認がさらに容易になりました。これは、通貨の強さや弱さが加速しているかどうかをグラフィカルに表示し、その加速の速度を測定するためです。加速すると物事は明らかに速く進みますが、これはFX市場でも同じです。つまり、反対方向に加速している通貨をペアリングすれば、潜在的に利益を生む取引を特定
Year-End Trading SALE – Save 50% While It Lasts! Advanced Trade Manager – The Ultimate All-in-One Solution for Faster, Smarter, and Safer Manual Trading. Transform your manual trading with NextGen Trade Manager AI – the professional on-chart panel that combines instant execution, visual trade planning, and powerful risk management into one intuitive tool. Execute orders, manage risk, and protect profits faster than ever before, all without leaving your chart. Perfect for all traders looking t
現在20%OFF! 初心者やエキスパートトレーダーに最適なソリューションです。 このインジケータは、新しいフォーミュラとともに多くの独自の機能を組み込んでいるため、手頃な価格のトレーディングツールとなっています。 アドバンスド・アキュムレーテッド・カレンシー・ボリューム・インディケーターは、主要28通貨ペアに特化し、すべての時間枠で機能します。1つのチャート上でAUD, CAD, CHF, EUR, GBP, JPY, NZD, USDのすべての通貨ボリューム(C-Volume)を抽出する新しい計算式です。これは、トレードにおいて大きなアドバンテージとなります。ボリュームトレーダーはその使い方を知っているはずです。もしあなたが初心者なら、極端な値を読む方法を学び、あなたの取引の武器に加えましょう。 C-Volumeを銃としてではなく、盾として考えてください。 メインチャートに警告サインが表示され、間違った取引に入ることを警告してくれます。 これは、一般的に使用されているペアの単純なVolumeではありません。外国為替市場をスキャンし、各通貨の出来高を抽出し、C-Volum
My Trades in Pips
Bernhard Schweigert
4.83 (18)
見逃せないトレーディングツールです。このインジケータは、チャート上のすべてのトレード/ディールを、そのシンボルが付いている状態で表示します。利益または損失が何ピップスかを表示します。選択により、より良い分析のためにサブウインドウを通して垂直線を印刷します。 プロバージョンはこちらです。マイトレード履歴PRO https://www.mql5.com/en/market/product/50206 また、入金通貨と合計pipsのトレードの合計結果についての情報も追加されます。 当日のトレードのみ、または指定された数のバー内のトレードのみを表示するよう選択できます。 マジックナンバーを指定したトレードを表示することができます。0を指定すると、すべての取引が表示されます。マジックナンバーを指定すると、そのEAの取引のみが表示されます。マウスオーバーすると、注文番号、コメント、マジックナンバーが表示されます。 このインジケータは、主に私の他の通貨強度の専門インジケータの1つと一緒に使用されます。 https://www.mql5.com/en/blogs/post/679077
FREE
現在26%OFF! このインディケータは、当社のメインインディケータ( Advanced Currency Strength 28   &  Advanced Currency IMPULSE with ALERT )の両方のスーパーコンビネーションです。28の外国為替ペアのTICK-UNITSとアラートシグナルの通貨強度の値を示しています。11種類のTick-Unitが使用可能です。1、2、3、4、5、6、10、12、15、20、30秒の11種類です。サブウィンドウのTick-Unitバーは、秒単位のタイマーに1ティック以上含まれる場合に表示され、左側にシフトされます。 たった1枚のチャートで、28のFXペアをスキャルピングできます。スキャルピングのチャンスとなるトリガーポイントを正確に把握することで、スキャルピングが上達することを想像してみてください。 1分足よりも短い期間で動作する市場初の通貨強度インジケーターです! このインジケータは、素早いインとアウトを行い、小さなピップを切り取ることを望む高速スキャルパーのためのものです。 ユーザーマニュアル: ここをクリック h
現在20%オフ! 初心者やエキスパートトレーダーのためのベストソリューション! トレードを見直すことは、成功するトレーダーへの第一歩です。 成功するトレーダーは、定期的に自分の取引パフォーマンスを見直す習慣があります。 このツールは、まさにそれを行うのに役立ちます。 このツールであなたの取引を追跡することで、レビュープロセスが最も効果的になります。 手動取引またはEAの取引を分析します。 3つの一般的なビューを使用してください。ボタンをクリックするだけで切り替えることができます。 クローズド・トレード オープントレード クローズ+オープントレード すべての取引は、各シンボルごとに表示されます。他のシンボルに移動するには、シンボル名のボタンをクリックします。 新規にオープンした取引とクローズした取引にはAlertを使用します。オープントレードを監視するのに非常に便利です。EA、シグナル、または手動で開始されるかもしれません。 利益またはPIPsの結果を切り替えるには、ボタンをクリックするだけです。 利益 PIPs 次に、3つの分析タイプを切り替えます。ボタンを
フィルタ:
kleinerbroker
42
kleinerbroker 2025.06.25 12:01 
 

ユーザーは評価に対して何もコメントを残しませんでした

MarcoEA
138
MarcoEA 2023.06.09 22:50 
 

ユーザーは評価に対して何もコメントを残しませんでした

Bernhard Schweigert
85707
開発者からの返信 Bernhard Schweigert 2023.06.25 12:01
Thank you for purchasing our dashboard. As a bonus, we invite you to join our exclusive community of traders by registering at www.CurrencyStrength28.com/forum . In our forum, you'll have access to valuable resources and discussions on successful trading strategies. The best part? It's completely free for our clients. Don't miss out on this opportunity to enhance your trading skills and connect with like-minded traders. If you have any further questions or need assistance, feel free to reach out. Happy trading!
Gabor Bocsak
3182
Gabor Bocsak 2023.05.23 18:42 
 

I really like the indicators! Actually i use 4 of them and they work really well together! I had a lot of questions as i use a bit different strategy.but i got all the help! Thank you!

Bernhard Schweigert
85707
開発者からの返信 Bernhard Schweigert 2023.06.09 15:01
Thank you, Gabor Bocsak, for your positive feedback. We truly appreciate it. We are glad to hear that you are enjoying the indicators and that they are working well in conjunction with your strategy. Our team is always ready to assist you and answer any questions you may have. We are committed to providing top-notch support and ensuring your success. 💖
Tyrena Booker
96
Tyrena Booker 2023.02.01 19:59 
 

The indicator is phenomenal!!! This indicator help me to know when pullbacks are happening.I enjoy the enhance features of this indicator because you can add any symbols see the whole market within seconds. I use this indicator with Currency Strength Exotics on the chart and let just say you will be counting PIPS. Bernhard will help with your question and answer each one in punctual time. I highly recommend this indicator to anyone. I appreciated your help Bernhard!!!

Bernhard Schweigert
85707
開発者からの返信 Bernhard Schweigert 2023.02.02 12:38
I appreciate your review with the phenomenal note.💖
batukbhairava
206
batukbhairava 2022.08.10 19:13 
 

Similar to CS28 Dashboard this indicator is a great dashboard which provides the Supply & Demand zones of all 28 pairs in a single window. My only issue with this indicator is that I couldn't resize the windows properly. May be Bernhard could look into this in the next update can design a template which can be resized properly. Also adding & removing currency requires manually typing the currency pairs in the settings. Is it possible if we can use the "Check Box" from the list instead? That will save lot of time As usual great work from Bernhard Thanks and Happy trading to all.. :-)

Bernhard Schweigert
85707
開発者からの返信 Bernhard Schweigert 2022.12.30 16:05
Thanks for sharing your great feedback. 🙏💖
New update: 2 buttons have been added to move the dashboard right/left or up/down. There may be symbols outside the visible chart if there are many symbols used. A click on the button will move the diagram by a number of rows or columns. Hope it helps.
najis080
134
najis080 2021.12.08 19:38 
 

Makes trading in zone much easier. I love this indicator.

Bernhard Schweigert
85707
開発者からの返信 Bernhard Schweigert 2022.02.02 09:07
Thanks for the review! 👍
Darryl Brown
313
Darryl Brown 2021.09.27 07:28 
 

I rented the indicator over the weekend and I plan on using this indicator along with cs28 and impulse for binary options trading. My first day so far I made 3k from $400 (5 wins 0 loss trades total) by following his rules of all 3 indicators. His system is by far superior and worth the money spent IMO. This indicator lets you know that all entries are not good entries. I love your other indicators Bernhard but this is by far my favorite one.

Bernhard Schweigert
85707
開発者からの返信 Bernhard Schweigert 2021.12.06 13:30
Thank you very much for your excellent review, friend! Wish you more success in your trading. 🙏👍
sudiang
222
sudiang 2021.09.06 15:00 
 

Personally, I like the stand alone version better. But this dashboard help me alot not to open many chart and stay all the time infront of laptop to monitor the opportunity. Just use it with the main trend and TF > 30, and it give low RR and many potential setup.

Bernhard Schweigert
85707
開発者からの返信 Bernhard Schweigert 2021.09.07 20:44
Thanks for the feedback! 🙏👍
George Palcau
21
George Palcau 2021.03.15 21:09 
 

Supply and demand zones are dissapearing all the time and it is confusing when it broke that resistance, i did not knew that from that begining and i can't use this indicator in my trading. When i contacted the seller about refund he recommended to buy another indicator that could go better with this one. Signals and alarms are also not triggering often. Overall bad experience and i did not received any refund.

Bernhard Schweigert
85707
開発者からの返信 Bernhard Schweigert 2021.03.16 13:52
It is the design of the dashboard to give a quick overview of the market. If you want to see broken zones, you need to use Advanced Supply Demand indicator version. The whole mql5 website does not support refunds. You can try the free demo before buying to know how it works. Besides, you rent only 1 month, which is only intended for a test.
Zachary David Cox
926
Zachary David Cox 2021.02.28 14:38 
 

I've used a couple of this authors products and have had success so I decided to try this one. My experience with the other products made setup and understanding very easy. It is a very powerful indicator!

Bernhard Schweigert
85707
開発者からの返信 Bernhard Schweigert 2022.10.01 17:21
Thanks for the honest review! 👍
Zafer Cakar
336
Zafer Cakar 2021.02.24 21:04 
 

Very strong indicator , incredible.

elthandoriancox
62
elthandoriancox 2020.09.18 14:11 
 

This indicator makes visually easy to determine where the buyers and sellers are in the market, thereby allowing you to see where the market will turn and or go too, impressive Bernhard !!!

a.hanson
226
a.hanson 2020.09.12 12:36 
 

I only have this indicator for 3 weeks but already I find it very useful in determining where to get out of a trade. Very good indicator, I am still getting used to it Bernhard's support is great like with all his other indicators, keep up the good job work.Thanks

Mark Taylor
2467
Mark Taylor 2020.08.27 11:30 
 

I have a few SD indicators and this one is by far the best, easy to read at a quick glance.

teapeak
80
teapeak 2020.08.05 13:21 
 

Best SD indicator I ever saw in Forex for Mt4. Hat off. Thank you.

SENMAO ZHANG
729
SENMAO ZHANG 2020.07.15 07:46 
 

This is the best support pressure indicator I've ever used, and it's my fifth Bernhard product.

stev18
136
stev18 2020.07.10 15:42 
 

I have been using some of the indicators from Bernhard. The quality of his products is very commendable. This indicator is a great tool. It plots accurate supply and demand zones on the chart and also displays them on a dashboard. With the dashboard, one can easily spot zones of interest, that can be traded with high probability of success. It also displays a lot of information that will help the trader make better trading decisions. I find it very useful. Thank you Bernhard and keep up the good work.

Oliver Henry
657
Oliver Henry 2020.06.16 13:01 
 

As a long time user of Bernhard's stand alone Supply and demand indicator I know just how accurate this indicator is. Being able to receive alerts for multiple pairs and monitor from a single dashboard is next level trading! Using this in conjunction with his other indicators makes for some very reliable signals. Many thanks

prestonmay3
215
prestonmay3 2020.02.22 20:19 
 

I have been using s/d as trade entry and exit now with a lot of success . The problem is that I spent most of my day looking for trades and charting . Instead of charting all 28 pairs , I use this to send me alerts , then I do technical analysis . Most free ones will only tell you when price enters a zone and not when it breaks and exit. I like this so much that I will purchase the Advance Standalone version and the Exotic ACS system. I have wasted 2000 on systems and indicators in the past year - This system paid for itself within the first week. The developer is an A plus guy also. Always answers questions in a fast manner .

valera123
172
valera123 2019.11.05 20:58 
 

Very good and high-quality product!

12
レビューに返信