NAM Divergences
- インディケータ
-
NAM TECH GROUP, CORP.
 NAM Techは、プロのトレーダーのニーズとプレミアム開発テクノロジーを統合する取り組みの中で生まれました。 長年の経験により、すべての製品で最高のユーザーエクスペリエンスを実現するために達成しました。
 - バージョン: 1.5
- アップデート済み: 16 5月 2021
- アクティベーション: 10
MT4マルチタイムフレームの発散と売られ過ぎ/売られ過ぎの検出インジケーター。
特徴
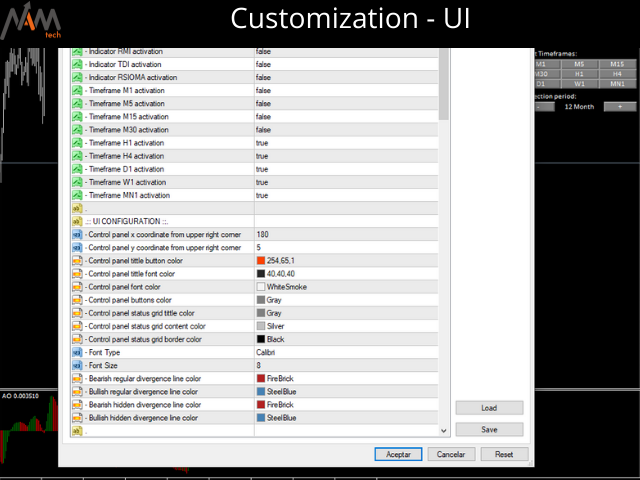
-チャートコントロールパネルで完全にカスタマイズ可能で、完全な相互作用を提供します。
-必要な場所でコントロールパネルを表示および非表示にします。
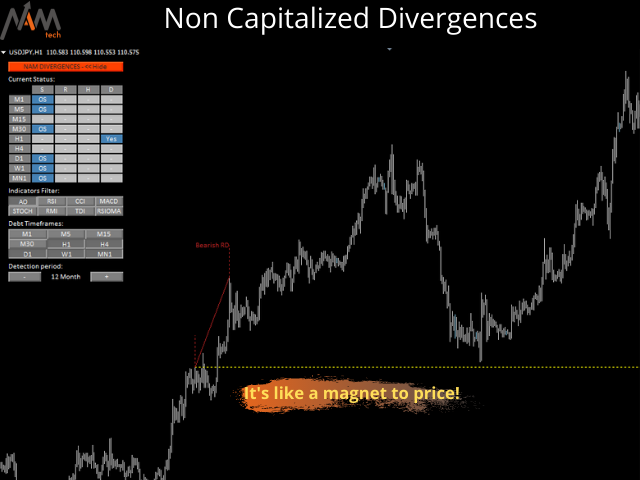
-資本化されていない発散に関するリアルタイムの情報。
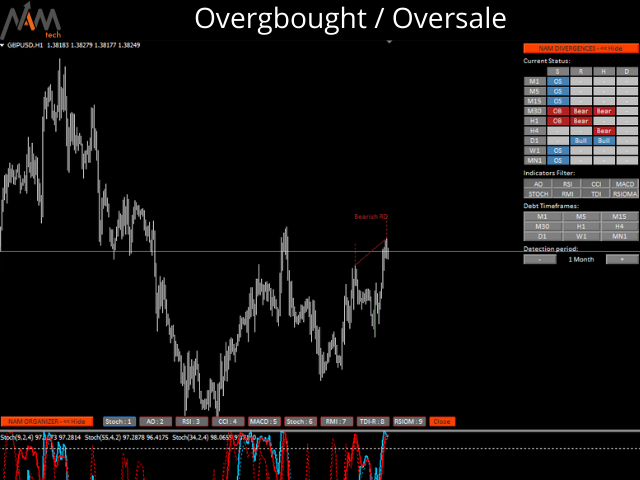
-売られ過ぎ/売られ過ぎの状況に関するリアルタイム情報。
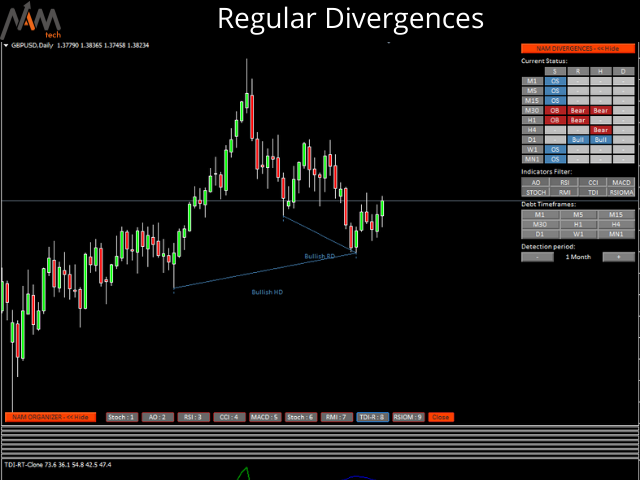
-定期的な発散に関するリアルタイムの情報。
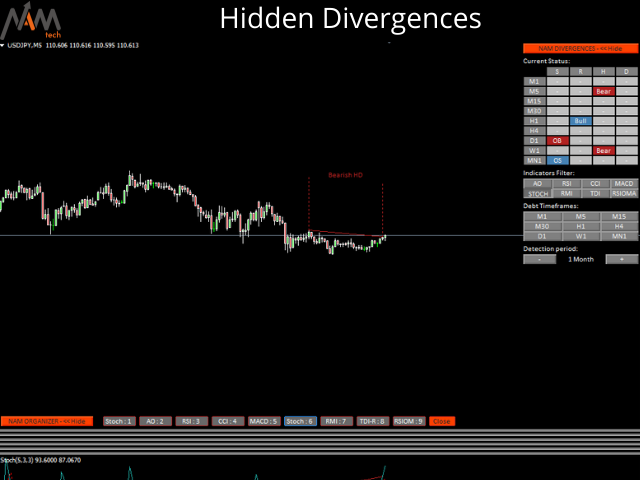
-隠れた発散に関するリアルタイム情報。
-発散検出に使用できる発振器:AO、RSI、CCI、MACD、STOCH、RMI、TDI、RSIOMA。
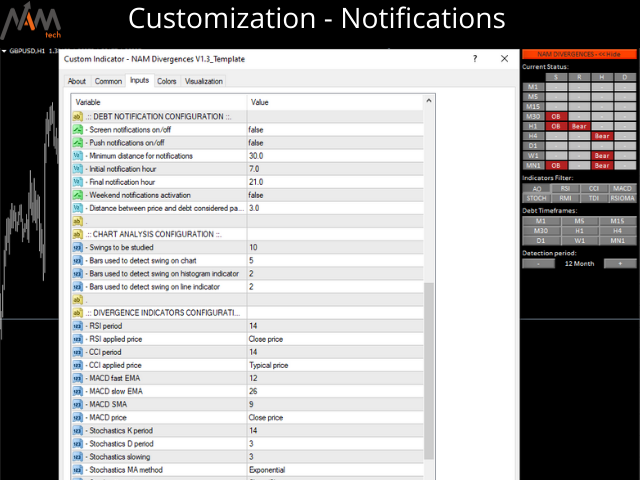
-通知サービス(画面アラート|プッシュ通知)。
概要
発散取引を使用すると、弱体化傾向や勢いの逆転を見つけるのに役立ちます。トレンドが続くためのシグナルとして使用できる場合もあります。私たちのツールは、チャートを可能な限りクリーンに保つために、表示と非表示の可能性を備えた驚くほど快適で直感的なコントロールパネルで、すべての時間枠で同時に発散検出を提供します。
選択した履歴期間に、買われ過ぎと売られ過ぎの状況、通常の相違、隠れた相違、および資本化されていない相違がリアルタイムで表示されます。
資本化されていない分岐については、MT4に画面上の通知があり、携帯電話に通知をプッシュします!

Muy completo y preciso... una pieza de relojería