Heiken Color Indicator for MT4
- インディケータ
-
Renaud Herve Francois Candel
 ITC SOFTWARE is a technology company based in the United States since 2010.
🟠🔴 The company develops financial software and indicators for different trading platforms:
-Metatrader 4 and Metatrader 5
-TradingView
-NinjaTrader - バージョン: 1.50
- アップデート済み: 4 7月 2023
- アクティベーション: 5
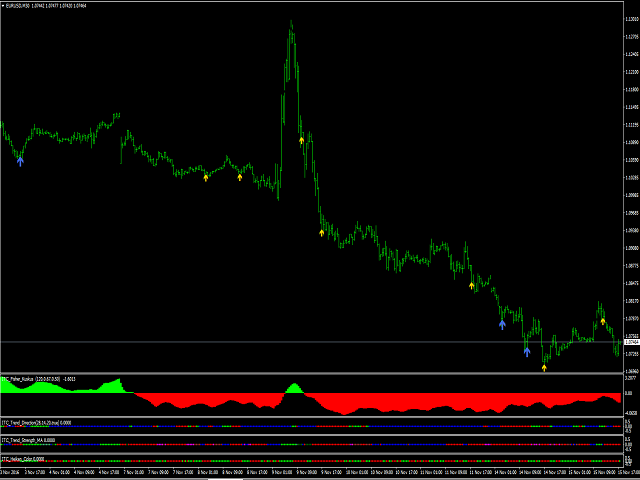
Heiken Color Indicator
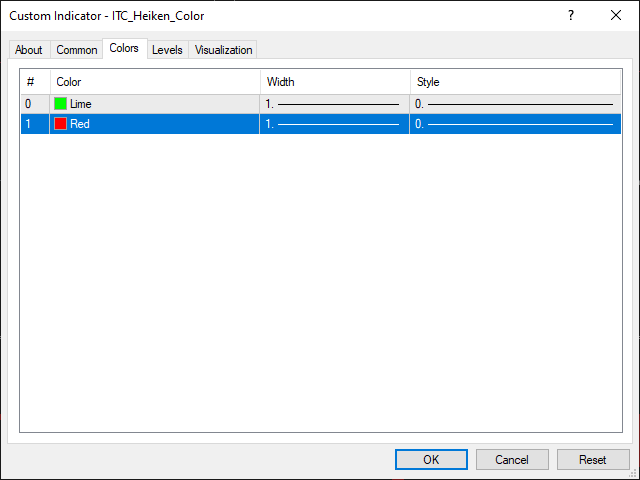
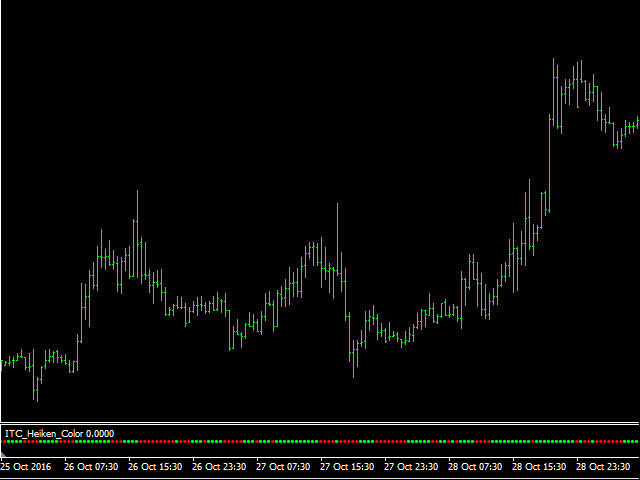
Heiken Color is a simple indicator showing Heiken Ashi candles color, not in your chart but rather in a separate window.
The indicator is useful if you want to use Heiken Ashi indicator without changing your chart display.
Heiken Ashi can be used to filter signals or spot better entry after another indicator gave you a signal.
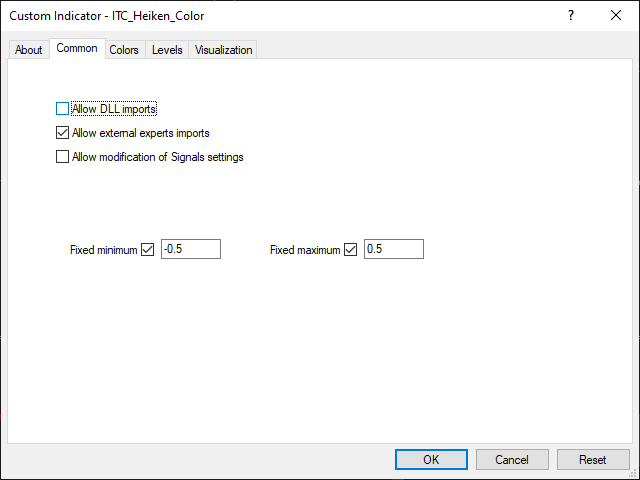
Heiken Color indicator has no inputs.
Heiken Color indicator can be used with any class of assets: Forex, Stocks, Indices, Futures, Commodities and Cryptos.
Heiken Color indicator can be used with any time frame.
Other indicators for MT4:
We developed more than 60 indicators and utilities for Metatrader 4 and Metatrader 5.
Indicators for MT5:
All our indicator are developed both for MT4 and MT5.
List of all our indicators:
You can see the complete list of our indicators visiting our profile page.