Dashboard Display indicator for MT4

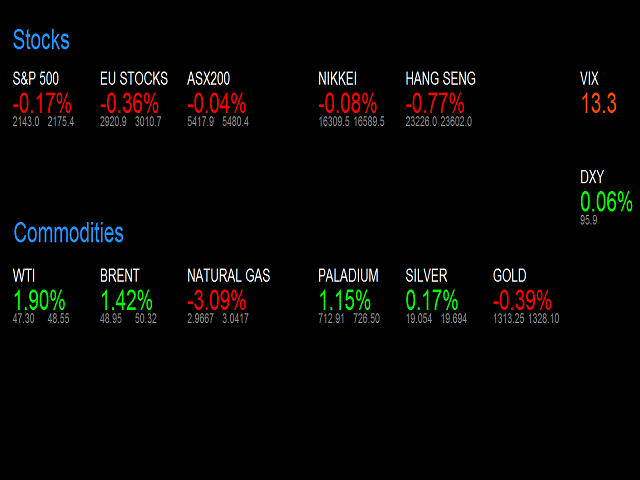
Dashboard Display Indicator

With the Dashboard Display indicator you can create a nice, customized and professional dashboard in a few minutes.
You can create your personal dashboard and have a look at a glance at real time data.
You can use the Dashboard Display indicator with any symbol of your platform.

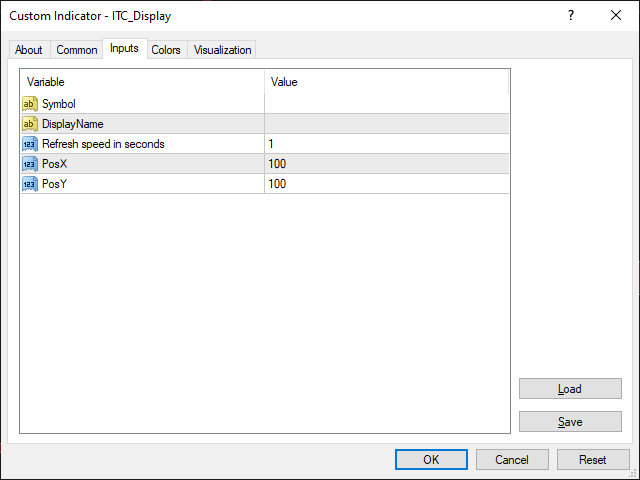
The inputs of the indicator are:
  • Symbol: symbol name as it appears in your platform (or VIX or DXY for specific symbols)
  • DisplayName: name of symbol as it should appear in the display
  • RefreshDelay: speed of data refresh in seconds
  • PosX: horizontal (from left) position in the screen (X coordinate) of the display
  • PosY: vertical (from top) position in the screen (Y coordinate) of the display
For each standard symbol, the indicator displays following information:
  • Display name
  • % increase/decrease since open of yesterday
  • high of the day
  • low of the day

Other indicators for MT4:
We developed more than 60 indicators and utilities for Metatrader 4 and Metatrader 5.
The most popular indicators for Metatrader 4 are:

Indicators for MT5:
All our indicator are developed both for MT4 and MT5.

List of all our indicators:
You can see the complete list of our indicators visiting our profile page.


おすすめのプロダクト
This Dashboard is free to download but is dependent on you owning the Gold Pro MT4   indicator.  Get the indicator here:  https://www.mql5.com/en/market/product/60430 The   Dashboard    will show you on a single chart all the timeframes (M1 to Monthly) with their own status for the indicator: Gold Pro MT4   all time frame and all symbol:  smart algorithm detects the trend, filters out market noise and gives entry signals!!! How to understand the status: Dashboard Show "Buy" - Buy Signal Das
FREE
Hello, This is an easy symbol change panel. The free version only can change major pairs which are "AUDUSD, EURUSD, GBPUSD, USDCHF, USDCAD, USDJPY, NZDUSD" The full version can add your symbols. FULL version here: https://www.mql5.com/en/market/product/71176?source=Site+Market+MT4+Indicator+New+Rating005 Also, can change the TimeFrame as well. Symbols must be active on your Market Watch list. Parameters: ratio - change the size LineNumber - you can set that how many symbols are displa
FREE
Knowledge of the strength and weakness of each currency is vital for every forex trader. Our   Currency Strength Meter indicator   measures the strength of eight major currencies (USD, EUR, GBP, CHF, JPY, CAD, AUD, NZD) by using the Relative Strength Index indicator, also known as RSI. The Currency Strength Meter indicator shows you, simply and quickly, when a currency is oversold, overbought, or in "normal area". This way, you can identify which currency is the strongest and the weakest. Our
Pin Bars
Yury Emeliyanov
5 (4)
主な目的:"ピンバー"は、自動的に金融市場チャート上のピンバーを検出するように設計されています。 ピンバーは、特徴的なボディと長いテールを持つキャンドルであり、トレンドの反転または修正を知らせることができます。 それがどのように機能するか:インジケーターはチャート上の各キャンドルを分析し、キャンドルの体、尾、鼻のサイズを決定します。 事前定義されたパラメータに対応するピンバーが検出されると、インジケータはピンバーの方向(強気または弱気)に応じて、上矢印または下矢印でチャート上に パラメータ: TailToBodyRatio-テールの長さとピンバーのボディサイズの最小比率を定義します。 NoseToTailRatio-ピンバーの「ノーズ」とテールの間の最大許容比を設定します。 ArrowSize-マークされたピンバーとチャート上のピンバーを指す矢印との間の距離を定義します。 適用:"ピン棒"の表示器が潜在的な傾向の逆転ポイントを識別し、市場か近い位置を書き入れる信号を発生させるのに使用することができます。 正しく使用され、他のテクニカル指標や分析方法と組み合わせると、指標は取引結果
FREE
Indicator measures strength of each currency in your list. Main idea: It simply iterates through all combinations of pairs and adds difference between open and close in percent. Parameters: List of currencies - what currencies will be calculated (maximum is 8) Calculation type - from which data will be strength calculated Calculation data input - used as input related to calculation type Symbol suffix - used in case of suffix on symbols, e.g: when your symbols look like EURUSDm, EURUSDmicro etc
FREE
Currency Strength Matrix (CSM) is an indicator that will show you the current strength of the major currencies in several timeframes allowing you to sort the currencies for strength and spot possible trading setups. This indicator is ideal for scalping and in all those events of sudden big moves. This DEMO only shows 4 currencies and 4 timeframes, for the full version please check https://www.mql5.com/en/market/product/24252 How does it work? The CSM compares the value of the current moving ave
FREE
Pip Movement Alert MT4で市場のモメンタムを先取りしましょう。この多通貨対応の汎用インジケーターは、複数のシンボルにおける正確なピップの動きを追跡し、トレーダーにアラートを提供するために設計されており、外国為替、株式、暗号通貨、商品取引に最適です。Forex FactoryやRedditのr/Forexなどのトレーディングコミュニティで称賛され、InvestopediaやTradingViewの議論でも急激な市場変動を検出する能力で注目されており、価格の急激な変動を活用しようとするトレーダーにとって必須のツールです。ユーザーは、ピップベースの重要な動き(例:10ピップ単位)を最大95%の信頼性で特定し、リアルタイムアラートを活用してボラティリティの急上昇を捉えることで、取引タイミングが20-30%改善したと報告しています。主な利点には、多通貨モニタリング、カスタマイズ可能なピップ閾値、チャートを常に分析せずに追跡を簡素化する軽量デザインが含まれ、スカルパー、デイトレーダー、スイングトレーダーに最適です。 Pip Movement Alert MT4は、ユーザー定義の
FREE
RQL Trend Board – Description RQL Trend Board   is a simple but powerful multi-timeframe trend dashboard. It shows the current market bias across several timeframes at the same time, using an internal trend-classification method. Each timeframe is displayed as a colored box:   Green   – bullish bias → look for   long   setups   Yellow   – ranging / unclear →   no trade zone   Red   – bearish bias → look for   short   setups The indicator gives a clear   overall picture   of where the
FREE
SX Supply Demand Zones accurately identifies and draws high-probability Supply and Demand zones using a sophisticated algorithm. Unlike traditional indicators that clutter your chart, this indicator is designed with a focus on performance and a clean user experience. New Unique Feature: Interactive Legend System What truly sets this indicator apart from everything else is the Interactive Control Legend. You have a professional dashboard directly on your chart that allows you to: Show/Hide: Ins
FREE
ReviewCandleChart is a unique product that can verify past price fluctuations using candlestick charts. This indicator accurately reproduces market price fluctuations in the past and can make trading decisions (entries, profits, loss cut) many times so that you can learn the trading faster. ReviewCandleCahrt is the best indicator to improve trading skills. ReviewCandleCahrt caters to both beginners and advanced traders. Advantages of the indicator This Indicator for verifying price fluctuation
FREE
FFx Force Index
Eric Venturi-Bloxs
5 (1)
The purpose of this new version of the MT4 standard indicator provided in your platform is to display in a sub-window multiple timeframes of the same indicator. See the example shown in the picture below. But the display isn’t like a simple MTF indicator. This is the real display of the indicator on its timeframe. Here's the options available in the FFx indicator: Select the timeframes to be displayed (M1 to Monthly) Define the width (number of bars) for each timeframe box Alert pop up/sound/ema
FREE
Attention, for the indicator to work correctly, you need to put the "MQL5" folder in your terminal folder, you can download it from the link below: https://disk.yandex.ru/d/DPyo0ntaevi_2A One of the best arrow indicators for Binary Options, which can also be used in the Forex market. Any time frame from M1 to MN, any currency pair, can also be used on stocks - the indicator is universal. Expiration from 1 to 5 candles. Displays traffic statistics on a graph. The indicator gives signals along th
FREE
This indicator help to mark the high and low of the session Asian,London,Newyork , with custom hour setting This indicator is set to count from minute candle so it will move with the current market and stop at the designated hour and create a accurate line for the day. below is the customization that you can adjust : Input Descriptions EnableAsian Enables or disables the display of Asian session high and low levels. EnableLondon Enables or disables the display of London session high and
FREE
R シルバー トレンド インジケーターは、Metatrader 4 アクティビティ チャートに現在のトレンドを直接表示するトレンド フォロー型取引インジケーターです。 2 種類のろうそくを描画します。 青は強気の値動きです。 弱気の価格変動の場合は赤。 R シルバー トレンド インジケーターを使用した取引は、まったくの初心者でも非常に簡単で、スキャルピング (M1、M5)、デイ トレード (M5、M15、M30)、スイング トレード (H1、H4、D1) の通貨に使用できます。 基本的な取引シグナル R シルバー トレンド インジケーターのシグナルは解釈しやすく、次のようになります。 買いシグナル: インジケーターがチャート上に青いろうそくを描いたときに買いポジションを開きます. 売りシグナル: インジケーターがチャート上に赤いろうそくを描いたときに売りポジションを開きます. 取引の終了: 反対のシグナルが表示されたら、開いている取引を終了するか、独自の取引終了方法を使用します。 ヒント R シルバー トレンド インジケーターを使用して下落して売る戦略をトレードするには
FREE
Free informative Indicator-helper. It'll be usefull for traders who trade many symbols or using grid systems (Averaging or Martingale). Indicator counts drawdown as percent and currency separate. It has a number of settings: Count deposite drawdown according equity value and send e-mail or notifications to user if DD more than set; Sending e-mail when max open orders reached; Shows price and remaining pips amount before MarginCall on current chart and Account generally; Display summary trade lot
FREE
Smart FVG インジケーター MT4 – MetaTrader 4 向け高度なフェアバリューギャップ検出 Smart FVG インジケーター MT4 は、MetaTrader 4 上で Fair Value Gap(FVG)をプロフェッショナルレベルで検出・監視し、アラートまで行うツールです。ATR ベースのフィルタリングと相場構造を考慮したロジックを組み合わせることで、ノイズを取り除き、流動性に応じて適応し、本当に重要な不均衡だけを残して精度の高い判断をサポートします。 主な特長 正確な FVG 検出:単なるローソク足のギャップではなく、市場の本質的な非効率を捉えます。 ATR ベースの精度:市場や時間軸が変わっても、低品質なシグナルを自動的にフィルタリング。 有効性のリアルタイム追跡:価格がゾーンを埋める/ブレイクすると、ゾーンが自動で延長・調整・削除されます。 カスタマイズ可能な表示:色・ラインスタイル・塗りつぶしを自由に設定し、どんなテンプレートにも合わせられます。 実用的なアラート:新規 FVG や、埋められた/無効化されたゾーンをリアルタイム通知。 パフォーマンス
FREE
FFx MACD
Eric Venturi-Bloxs
4.2 (5)
The purpose of this new version of the MT4 standard indicator provided in your platform is to display in a sub-window multiple timeframes of the same indicator. See the example shown in the picture below. But the display isn’t like a simple MTF indicator. This is the real display of the indicator on its timeframe. Here's the options available in the FFx indicator: Select the timeframes to be displayed (M1 to Monthly) Define the width (number of bars) for each timeframe box Alert pop up/sound/ema
FREE
The presented indicator draws the pivot points for different timeframes – 4 hours, day, week and month. Before you leave, download the demo version of this indicator, evaluate its performance. After all, this does not oblige you to anything. And then you will see that it has the best price to quality ratio, buy it now and receive updates for free. In the new version, an information panel with control buttons is displayed on the screen. The "Symbol properties" information panel shows: Symbol - na
SignalFusion 5 Total market view in one chart. Monitor multiple pairs in real time, convert data into clear decisions, and spot opportunities for scalping, day trading, and swing. Works with majors like EUR/USD and GBP/USD and also exotics. Adds immediate value to any trader’s toolkit. 5 integrated indicators. Combines five signals into a single optimized list and runs by default with 9 pairs . Switching symbols is direct from parameters. After purchase, download for MT4/MT5 and use instan
FREE
FFx RVI
Eric Venturi-Bloxs
5 (1)
The purpose of this new version of the MT4 standard indicator provided in your platform is to display in a sub-window multiple timeframes of the same indicator. See the example shown in the picture below. But the display isn’t like a simple MTF indicator. This is the real display of the indicator on its timeframe. Here's the options available in the FFx indicator: Select the timeframes to be displayed (M1 to Monthly) Define the width (number of bars) for each timeframe box Alert pop up/sound/ema
FREE
CrossRate
Stanislav Korotky
5 (1)
Ever wondered what is XAU/XAG rate or how Chinese Yuan is traded against Russian Ruble? This indicator gives the answers. It shows a cross rate between current chart symbol and other symbol specified in parameters. Both symbols must have a common currency. For example, in cases of XAUUSD and XAGUSD, or USDRUB and USDCHN, USD is the common currency. The indicator tries to determine the common part from symbols automatically. If it fails, the DefaultBase parameter is used. It is required for non-F
FREE
This indicator is one of the useful tools for traders who trade on currency pairs and based on the strength of each currency they can make a correct decision or confirmation in the positions.  It has been calculated for all the minor currency pairs supported by the broker and displays the values of the major currencies. These currencies are displayed horizontally or vertically according to the trader's config when executing the indicator. One of the trading strategies that can be used is to cho
FREE
Trade History for MT4  This indicator is specially developed for that traders want to display his trades on the charts. Shows history and current deals on the chart. Trades show on the chart with a dotted line, and profit will show realtime. Buy trades are displayed in bull color, Sell trades in bear color. Tip: The historical order displayed by the indicator is associated with the "Account History", so please set the historical order display in the "Account History" of MT software. If you a
FREE
Check out other great products from  https://www.mql5.com/en/users/augustinekamatu/seller   This indicator is the best so far at determining the currency strength of each pair. It provides stable values and is highly adaptive to market changes. It is a great tool to add to your arsenal to make sure you are on the right side of the trend at all times. No inputs required, it is simple plug and play. A Winning Trading Strategy This article describes the components and logic needed to develop a tra
FREE
Vanexio
Sayan Vandenhout
VANEXIO USES THE TREND WAVE INDICATOR AND IT CAN IDENTIFY THE BEGINNING AND THE END OF A NEW WAVE TREND MOVEMENT. AS AN OSCILLATOR, THE INDICATOR IDENTIFIES THE OVERBOUGHT AND OVERSOLD ZONES. IT WORKS GREAT TO CATCH THE SHORT TERM PRICE REVERSALS AND USES A MARTINGALE STRATEGY TO CLOSE ALL TRADES IN PROFIT. USE DEFAULT SETTINGS ON H1 OR HIGHER TIME FRAME ON ANY PAIR FOR MORE ACCURATE TRADES WHY THIS EA : Smart entries calculated by 5 great strategies The EA can be run on even a $20000 acco
FREE
インディケータは現在のクオートを作成し、これを過去のものと比較して、これに基づいて価格変動予測を行います。インジケータには、目的の日付にすばやく移動するためのテキスト フィールドがあります。 オプション: シンボル - インジケーターが表示するシンボルの選択; SymbolPeriod - 指標がデータを取る期間の選択; IndicatorColor - インジケータの色; HorisontalShift - 指定されたバー数だけインディケータによって描画されたクオートのシフト; Inverse - true は引用符を逆にします。false - 元のビュー。 ChartVerticalShiftStep - チャートを垂直方向にシフトします (キーボードの上下矢印)。 次は日付を入力できるテキストフィールドの設定で、「Enter」を押すとすぐにジャンプできます。
Price Volume Trend Oscillator
Rafi Anchukandan Koyamu Anchukandan
The Price Volume Trend Oscillator (PVTO) is a powerful technical analysis tool designed to provide insights into the relationship between price movements and trading volumes. This indicator offers a unique perspective on market trends, helping traders identify potential buying and selling opportunities. Parameters: EMA Short Period: Defines the short EMA period for calculating the PVTO. Default 3 EMA Long Period: Specifies the long EMA period for PVTO calculation. Default 10 EMA Signal Period: S
FREE
An indicator for analyzing different currency pairs simultaneously Forex is a complex market that requires several currency pairs to be analyzed simultaneously Determine the number of currency pairs yourself Determine the currency pair you want to analyze to analyze 4 of the most important and similar currency pairs at the same time. For direct and simple analysis, some currency pairs have changed (EURUSD>>>USDEUR) Do not doubt that to succeed in this market, you must analyze several currency pa
FREE
This is a Sharkfin Arrows Indicator. Detailed explanation and TDI extras: https://www.mql5.com/en/blogs/post/759138 This indicator will show only Arrows. It does not have TDI symbols on chart. Please get the extras from links above for TDI indicators. Sharkfin Scanner (paid): https://www.mql5.com/en/market/product/123566 TDI Scanner Dash (paid): https://www.mql5.com/en/market/product/41826 About: This Indicator finds the Shark Fin Pattern. It will show an arrow in the current bar if RSI sha
FREE
このプロダクトを購入した人は以下も購入しています
El indicador "MR BEAST ALERTAS DE LIQUIDEZ" es una herramienta avanzada diseñada para proporcionar señales y alertas sobre la liquidez del mercado basándose en una serie de indicadores técnicos y análisis de tendencias. Ideal para traders que buscan oportunidades de trading en función de la dinámica de precios y los niveles de volatilidad, este indicador ofrece una visualización clara y detallada en la ventana del gráfico de MetaTrader. Características Principales: Canal ATR Adaptativo: Calcula
Are you looking for a simple and reliable indicator that can help you spot market swing points easily? Do you want clear buy and sell signals that work on any timeframe and any trading instrument? Buy Sell Signal Pro is designed to do exactly that. It helps traders identify important market turning points and understand the current market structure in a clear and easy way. This indicator detects Higher Highs (HH), Higher Lows (HL), Lower Highs (LH), and Lower Lows (LL) so you can quickly see wh
このインジケーターは、反転ポイントと価格戻りゾーンを正確に表示します。     主要プレーヤー 。新たなトレンドが形成される場所を把握し、最大限の精度で意思決定を行い、すべての取引をコントロールします。 TREND LINES PRO インジケーターと組み合わせることで、その潜在能力を最大限に発揮します。 VERSION MT5 インジケーターが示す内容: 新しいトレンドの始まりに活性化する反転構造と反転レベル。 リスクと報酬の比率を最小限に抑えた利益 確定 と 損失停止の レベルの表示     RR 1:2   。 インテリジェントな削減ロジックによるストップロス。 指定されたインジケーターから 2 つのトレンド タイプの反転パターンを表示します。 指標: トレンドを追う   TREND LINES PRO   (世界的なトレンドの変化) TREND PRO   (クイックトレンド変更) シンプルで効果的   スキャナー   リアルタイムトレンド(新機能)。 マルチタイムフレームのインストゥルメント フィルタリング。 画面   利益     LOGIC AI信号の後。 当日プラス方
Miraculous Indicator – ガン・スクエア・オブ・ナインに基づく100%非リペイントのFXおよびバイナリーツール この動画では、FXおよびバイナリーオプションのトレーダー向けに特別に開発された、非常に正確で強力な取引ツールである Miraculous Indicator を紹介しています。このインジケーターがユニークなのは、伝説的な ガン・スクエア・オブ・ナイン と ガンの振動の法則 に基づいている点で、現代の取引で利用できる最も正確な予測ツールの一つとなっています。 Miraculous Indicatorは 完全に非リペイント であり、ローソク足が確定した後にシグナルが変化したり消えたりすることはありません。つまり、見たものがそのまま利用できます。これにより、トレーダーは自信を持ってエントリーおよびエグジットを行うための信頼性と一貫性のある根拠を得ることができます。 主な特徴: ガン・スクエア・オブ・ナインとガン理論に基づいて構築 100%非リペイントのシグナルシステム すべての時間枠(M1、M5、H1、H4、日足、週足)で機能 FXおよびバイナリーオプション取引
An exclusive indicator that utilizes an innovative algorithm to swiftly and accurately determine the market trend. The indicator automatically calculates opening, closing, and profit levels, providing detailed trading statistics. With these features, you can choose the most appropriate trading instrument for the current market conditions. Additionally, you can easily integrate your own arrow indicators into Scalper Inside Pro to quickly evaluate their statistics and profitability. Scalper Inside
トレンドラインプロ   市場の真の方向転換点を理解するのに役立ちます。この指標は、真のトレンド反転と主要プレーヤーが再び参入するポイントを示します。 分かりますか     BOSライン   複雑な設定や不要なノイズなしに、より長い時間足でのトレンドの変化と重要なレベルを把握できます。シグナルは再描画されず、バーが閉じた後もチャート上に残ります。 VERSION MT 5     -     RFI LEVELS PRO インジケーター と組み合わせることで、その潜在能力を最大限に発揮します。 インジケーターが示す内容: 本当の変化   トレンド(BOSライン) 一度シグナルが現れたら、それは有効です!これは、リペイント機能を持つインジケーターとの重要な違いです。リペイント機能を持つインジケーターは、シグナルを発した後、それを変更し、資金の損失につながる可能性があります。これにより、より高い確率と精度で市場に参入できます。また、矢印が現れた後、目標値(利益確定)に達するか、反転シグナルが現れるまで、ローソク足の色を変更する機能もあります。 繰り返しエントリ       主要プレーヤーの
Precautions for subscribing to indicator This indicator only supports the computer version of MT4 Does not support MT5, mobile phones, tablets The indicator only shows the day's entry arrow The previous history arrow will not be displayed (Live broadcast is for demonstration) The indicator is a trading aid Is not a EA automatic trading No copy trading function The indicator only indicates the entry position No exit (target profit)  The entry stop loss point is set at 30-50 PIPS Or the front hi
PairMaster Buy Sell Arrow Indicator for MT4 Trade Reversals Like a Pro — Catch Every Swing Point with Precision The PairMaster Buy Sell Arrow Indicator is a powerful MetaTrader 4 tool built to identify high-probability swing trading opportunities . Designed for traders who value accuracy, clarity, and simplicity, PairMaster detects key market turning points and plots intuitive buy and sell arrows directly on your chart. Key Features Accurate Swing Point Detection – Automatically identifies ma
Volatility Trend System - a trading system that gives signals for entries. The volatility system gives linear and point signals in the direction of the trend, as well as signals to exit it, without redrawing and delays. The trend indicator monitors the direction of the medium-term trend, shows the direction and its change. The signal indicator is based on changes in volatility and shows market entries. The indicator is equipped with several types of alerts. Can be applied to various trading ins
Dynamic Forex28 Navigator - 次世代の Forex 取引ツール。 現在 49% オフ。 Dynamic Forex28 Navigator は、長年人気のインジケーターを進化させたもので、3 つの機能を 1 つにまとめています。 Advanced Currency Strength28 インジケーター (レビュー 695 件)  + Advanced Currency IMPULSE with ALERT (レビュー 520 件) + CS28 コンボ シグナル (ボーナス)。 インジケーターの詳細 https://www.mql5.com/en/blogs/post/758844 次世代の Strength インジケーターが提供するもの  オリジナルで気に入っていたすべての機能が、新機能と精度の向上によって強化されました。 主な機能: 独自の通貨強度計算式。 すべての時間枠でスムーズかつ正確な強度ライン。 トレンドの特定と正確なエントリーに最適です。 ダイナミックマーケットフィボナッチレベル (マーケットフィボナッチ)。 このインジケーターに固有
Meravith
Ivan Stefanov
5 (3)
マーケットメーカーのためのツール。 Meravith は次の機能を提供します: すべての時間足を分析し、現在有効なトレンドを表示します。 強気と弱気の出来高が等しくなる流動性ゾーン(出来高均衡)を強調表示します。 異なる時間足のすべての流動性レベルをチャート上に直接表示します。 テキスト形式の市場分析を生成し、参考情報として表示します。 現在のトレンドに基づいて目標値、サポートレベル、ストップロスを計算します。 取引のリスクリワード比を算出します。 口座残高に基づいてポジションサイズを計算し、潜在的な利益を推定します。 また、市場に大きな変化があった場合には警告を表示します。 インジケーターの主要ライン: 強気/弱気の出来高エグゾーストライン ― 目標値として機能します。 市場のトレンドを示すライン。市場が強気か弱気かによって色が変わり、トレンドのサポートとして機能します。主にその色が市場センチメントを示します。 出来高均衡ライン(Eq)。Eq(Volume Equilibrium)ラインはシステムの中核です。これは買い手と売り手の出来高のバランスポイントを表します。市場の流動性を示し
GOLD Impulse with Alert
Bernhard Schweigert
4.64 (11)
このインディケータは、当社の2つの製品 Advanced Currency IMPULSE with ALERT  +   Currency Strength Exotics . のスーパーコンビネーションです。 このインジケーターは全ての時間枠で作動し、8つの主要通貨と1つのシンボルの強弱のインパルスをグラフで表示します。 このインジケータは、金、エキゾチックペア、商品、インデックス、先物など、あらゆるシンボルの通貨強度の加速度を表示することに特化されています。金、銀、原油、DAX、US30、MXN、TRY、CNHなどの通貨強度の加速度(インパルスまたは速度)を表示するために、任意のシンボルを9行目に追加できる、この種の最初のものです。 新しいアルゴリズムに基づいて構築され、潜在的な取引の特定と確認がさらに容易になりました。これは、通貨の強さや弱さが加速しているかどうかをグラフィカルに表示し、その加速の速度を測定するためです。加速すると物事は明らかに速く進みますが、これはFX市場でも同じです。つまり、反対方向に加速している通貨をペアリングすれば、潜在的に利益を生む取引を特定
KT Trend Trading Suite は、トレンドフォロー戦略と複数のブレイクアウトポイントを組み合わせた多機能インジケーターです。 新たなトレンドが形成されると、このインジケーターは複数のエントリーチャンスを提供し、トレンドにうまく乗ることが可能になります。あまり重要でないエントリーポイントを避けるために、プルバックの閾値が使用されます。 MT5 バージョンはこちらで入手可能です  https://www.mql5.com/en/market/product/46270 機能 市場のさまざまなダイナミクスを1つの方程式にまとめ、トレンドの全体像を明確に描写します。 エントリーシグナルに基づいて、局所的な高値と安値を視覚的に示す長方形を描画します。 シグナルの精度を自動的に測定し、パフォーマンス指標をシンプルに表示します。 複数時間足対応のダッシュボードを搭載し、すべての時間軸をスキャンして、それぞれのトレンド方向を表示します。 入力パラメータ History Bars:   過去のシグナル分析に使用する履歴バーの数。  Signals Period:   エントリ
現在40%OFF! 初心者やエキスパートトレーダーのためのベストソリューション! このダッシュボードソフトウェアは、28の通貨ペアで動作しています。それは私達の主要な指標(高度な通貨の強さ28と高度な通貨インパルス)の2に基づいています。それは全体の外国為替市場の大きい概観を与えます。それは、すべての(9)時間枠で28の外国為替ペアのための高度な通貨の強さの値、通貨の動きの速度と信号を示しています。チャート上で1つのインディケータを使用して市場全体を観察し、トレンドやスキャルピングの機会をピンポイントで見つけることができたら、あなたのトレードがどのように改善されるか想像してみてください。 このインディケータには、強い通貨と弱い通貨の識別、潜在的な取引の識別と確認がより簡単になるような機能が搭載されています。このインディケータは、通貨の強さや弱さが増加しているか減少しているか、また、すべての時間枠でどのように機能しているかをグラフィカルに表示します。 新機能として、現在の市場環境の変化に適応するダイナミックなマーケットフィボナッチレベルが追加され、すでに当社のAdvanced
現在20%OFF! 初心者やエキスパートトレーダーに最適なソリューションです。 このインディケータは、エキゾチックペア・コモディティ・インデックス・先物など、あらゆるシンボルの通貨の強さを表示することに特化したインディケータです。金、銀、原油、DAX、US30、MXN、TRY、CNHなどの通貨の強さを表示するために、9行目にどのシンボルでも追加することができます。独自の機能を多数搭載し、新しい計算式を採用したため、ユニークで高品質、かつ手頃な価格のトレーディングツールとなっています。新しいトレンドやスキャルピングチャンスのトリガーポイントを正確に把握することができるため、あなたのトレードがどのように改善されるか想像してみてください。 ユーザーマニュアル:ここをクリック   https://www.mql5.com/en/blogs/post/708876 すべての時間枠に対応します。あなたはすぐにトレンドを見ることができるようになります! 新しいアルゴリズムに基づいて設計されているため、潜在的な取引の特定と確認がより簡単になります。これは、8つの主要通貨と1つのシンボルの強弱
GM Arrows Pro
Guillaume Pierre Philippe Mesplont
Product Name: GM Arrows Pro – Signals & Alerts Short Description: GM Arrows Pro is a clean, reliable MT4 indicator showing BUY/SELL arrows on the chart with unique alerts at the moment the signal appears. Full Description: GM Arrows Pro is a professional MT4 indicator designed for traders who want clear, actionable signals: BUY and SELL arrows visible on the entire chart history Unique alerts when a new signal appears (no repeated alerts) Option to disable repetitive signals ( disable_repeatin
System Trend Pro - This is the best trend trading indicator!!! The indicator no repaint!!!  The indicator has   MTF   mode, which adds confidence to trading on the trend (   no repaint   ). How to trade? Everything is very simple, we wait for the first signal (big arrow), then wait for the second signal (small arrow) and enter the market in the direction of the arrow. (See screens 1 and 2.) Exit on the opposite signal or take 20-30 pips, close half of it, and keep the rest until the opposite
Candle Power Pro
Thushara Dissanayake
4.5 (8)
その   キャンドルパワープロ   は、解読するために設計された洗練された取引ツールです。     実ボリューム圧力、ティックデータの不均衡、機関投資家の注文フローのダイナミクス   測定することにより   強気相場と弱気相場の戦い   リアルタイムでこの指標は生の   ボリュームデータを実用的な洞察に 変換し、トレーダーが   スマートマネーの動き、流動性ハンティング、そして隠れた市場心理   各価格ローソク足の裏にあるものを分析することで   買い手/売り手の取引量の割合、乖離パターン、取引量に基づく確認など 、     価格行動とボリューム分析は 、トレーダーにとって非常に貴重です。       ICT、SMC、および機関投資家向け取引手法 。 従来のボリュームインジケーターとは異なり、     キャンドルパワープロ   焦点を当てる   ティックデータの粒度は 、各ローソク足の動きが基礎となる   強気/弱気の強さ   または潜在的な   マーケットメーカーの罠、反転、またはブレイクアウトの継続を 予測します。     セッションベースの戦略(ロンドン/ニューヨークのキルゾー
チャートを構成し、周期的な価格変動を識別するテクニカル指標。 どのチャートでも動作します。 いくつかの種類の通知。 グラフ自体に追加の矢印があります。 履歴を再描画せずに、キャンドルのクローズに取り組みます。 M5以上のTFを推奨します。 パラメータの使用と設定が簡単です。 異なるパラメータを持つ 2 つのインジケーターを使用する場合、他のインジケーターなしで使用できます。 入力パラメータは2つあります 周期性と信号持続時間 これら 2 つのパラメータは、チャート構造の処理を扱います。 Cyclicity - 反転サイクルが変化する頻度を調整し、サイクルを滑らかにします。 Signal duration - 最小数では価格変動の衝動を検出し、最大数では長期的なトレンドの動きを検出します。
発見が困難で頻度が少ないため、分岐は最も信頼できる取引シナリオの1つです。このインジケーターは、お気に入りのオシレーターを使用して、通常の隠れた分岐点を自動的に見つけてスキャンします。 [ インストールガイド | 更新ガイド | トラブルシューティング | よくある質問 | すべての製品 ] 取引が簡単 通常の隠れた発散を見つけます 多くのよく知られている発振器をサポート ブレイクアウトに基づいて取引シグナルを実装します 適切なストップロスおよび利益レベルを表示します 設定可能なオシレーターパラメーター カスタマイズ可能な色とサイズ バー単位でサイズ別に分岐をフィルタリング パフォーマンス統計を実装します 電子メール/音声/視覚アラートを実装します 幅広い市場の見通しを提供するために、異なるオシレーターを使用して、干渉なしで同じチャートにインジケーターを何度もロードできます。このインジケーターは、次のオシレーターをサポートしています。 RSI CCI MACD オスマ 確率的 勢い 素晴らしい発振器 加速器発振器 ウィリアムズパーセントレンジ 相対活力指数 特に外国為替市場では、
Advanced version of CyberZingFx Volume Plus, the ultimate MT4 indicator for traders seeking highly accurate buy and sell signals. With an additional strategy and price action dot signals that enhances its effectiveness, this indicator offers a superior trading experience for professionals and beginners alike. The CyberZingFx Volume Plus Advanced version combines the power of volume analysis and historical price data with an additional strategy, resulting in even more precise and reliable signals
現在40%OFF! このダッシュボードは、複数のシンボルと最大9つのタイムフレームで動作するソフトウェアの非常に強力な部分です。 このソフトは、弊社のメインインジケーター(ベストレビュー:Advanced Supply Demand)をベースにしています。    Advanced Supply Demand ダッシュボードは、素晴らしい概要を提供します。それは示しています。  ゾーン強度評価を含むフィルタリングされた需給値。 ゾーン内/ゾーンへのPips距離。 ネストされたゾーンがハイライトされます。 選択されたシンボルの4種類のアラートを全ての(9)時間枠で提供します。 それはあなたの個人的なニーズに合わせて高度に設定可能です。 あなたの利益! すべてのトレーダーにとって最も重要な質問です。 市場に参入するのに最適なレベルはどこか? 成功のチャンスとリスク/リターンを得るために、強力な供給/需要ゾーン内またはその近くで取引を開始します。 損切りの最適な位置はどこですか? 最も安全なのは、強力な供給/需要ゾーンの下/上にストップを置くことです。 最適な利益
Allows multiple indicators to be combined into a single indicator, both visually and in terms of an alert. Indicators can include standard indicators, e.g. RSI, CCI, etc., and also Custom Indicators, even those purchased through Market, or where just have the ex4 file. An early alert is provided, say when 4 out 5 indicators have lined up, and a confirmed alert when all are in agreement. A‌lso features a statistics panel reporting the success of the combined indicator by examining the current cha
まず第一に、この取引インジケーターは再描画されず、再描画されず、遅延しないことを強調する価値があります。これにより、手動取引とロボット取引の両方に理想的なものになります。 ユーザーマニュアル:設定、入力、戦略。 アトミックアナリストは、価格の強さとモメンタムを利用して市場でより良いエッジを見つけるためのPA価格アクションインジケーターです。ノイズや誤ったシグナルを除去し、取引ポテンシャルを高めるための高度なフィルターを備えています。複雑なインジケーターの複数のレイヤーを使用して、アトミックアナリストはチャートをスキャンし、複雑な数学的計算をシンプルなシグナルと色に変換します。これにより、どのような初心者トレーダーでも理解して使用し、一貫した取引の決定を行うことができます。 「アトミックアナリスト」は、新規および経験豊富なトレーダー向けにカスタマイズされた包括的な取引ソリューションです。プレミアムインジケーターとトップノッチの機能を1つの取引戦略に組み合わせ、すべてのタイプのトレーダーにとって汎用性のある選択肢にします。 デイリートレーディングとスキャルピング戦略:高速で正確な
Super Signal – Skyblade Edition プロ仕様のノンリペイント / ノーラグ・トレンドシグナルシステム。卓越した勝率を実現 | MT4 / MT5 対応 1分足、5分足、15分足などの低い時間足で最も効果を発揮します。 主な特徴: Super Signal – Skyblade Edition は、トレンド取引に特化したスマートなシグナルシステムです。マルチレイヤーのフィルターロジックを用いて、明確な方向性と実際のモメンタムに支えられた強力なトレンドのみを検出します。 このシステムは 天井や底を予測するものではありません 。次の3つの条件がすべて満たされた場合にのみシグナルを発生させます: 明確なトレンド方向 モメンタムの増加 健全なボラティリティ構造 市場セッションに基づく流動性分析と組み合わせることで、シグナルの精度とタイミングがさらに向上します。 シグナルの特性: すべての矢印シグナルは 100% 非リペイント / 遅延なし 一度出現したシグナルは固定され、点滅・消失しません チャート上の矢印、情報パネル、ポップアップ通知、音声アラート、プッシュ通知
NextCandlePredictor インジケーター NextCandlePredictorは、再描画しない、色が変わらない、動かない、消えない、遅延がないアラート付きのシグナルインジケーターです。あらゆるタイムフレームで次のキャンドルまたはその次のキャンドルの方向を識別するのに役立ちます。ニューヨーク、ロンドン、またはその両方の重なり合う高ボラティリティ市場に特にお勧めです。 主な特徴: タイムフレームの汎用性: M1からH1以上のあらゆるタイムフレームで迅速かつ正確なシグナルを提供します。 明確な買い/売りシグナル: ADXのDI+とDI-ラインを使用して明確な買いと売りのシグナルを生成し、最良のトレード判断を下せるようにします。 直感的な視覚化: シグナルはチャート上に緑色(買い)と赤色(売り)の矢印で直接表示され、迅速かつ簡単に読み取れます。 カスタマイズ可能な設定: 分析するバーの数とアラートオプションを好みとトレード戦略に応じて調整できます。使用するTFに応じた提案表を以下で確認してください。 即時およびオプションのキャンドル終了時アラート: デフォルトでは、ADX条件が
このインジケーターを購入すると、プロ仕様のトレードマネージャーを無料で差し上げます。 まず第一に、このトレーディングシステムがノンリペイント、ノンリドロー、ノンラグのインジケーターであることを強調する価値がある。これにより、手動取引とロボット取引の両方に理想的なものになっています。 オンラインコース、マニュアル、プリセットのダウンロード。 「スマートトレンドトレーディングシステム MT5」は、新規および経験豊富なトレーダー向けにカスタマイズされた包括的なトレーディングソリューションです。10以上のプレミアムインジケーターを組み合わせ、7つ以上の堅実なトレーディング戦略を備えており、多様な市場状況に対応する多目的な選択肢となっています。 トレンドフォロー戦略:トレンドを効果的に乗り越えるための正確なエントリーとストップロス管理を提供します。 リバーサル戦略:潜在的なトレンドの反転を特定し、トレーダーがレンジ相場を活用できるようにします。 スキャルピング戦略:高速で正確なデイトレードおよび短期取引のために設計されています。 安定性:すべてのインジケーターはノンリペイント、ノンリドロー、ノ
Trend Scanner PRO First of all, it’s worth emphasizing that this trading system is 100% Non-Repainting, Non-Redrawing, and Non-Lagging , which makes it ideal for both   manual   and   algorithmic   trading setups. Online course, user manual, and downloadable presets included. The Trend Scanner Dashboard is a professional   multi pair scanner   that analyzes multiple symbols and timeframes at once, giving you an instant   market scanner   view of the real trend direction. Instead of switching ch
Developed methods for trading collected in one indicator. In the form of arrows, it defines entries in the direction of the trend. It has 2 types of arrows - trend and signal guides, informing about the potential movement in the direction of the trend. Works without redrawing, ready for use on all symbols/tools. The most suitable time frames to use are M15, M30, H1, H4. How to use The indicator finds the direction of the trend in the form of a signal arrow, a graphic rectangle stretches along
This is Multiple Timeframe of Malaysia SNR Levels and Storyline. The single timeframe version   here Features: + Display level on multiple timeframe (higher or lower) + Turn on/off level on timeframe + Alert when price touch level 1. if high > resistance level but close of candle < resistance level , this level become unfresh - Name of level will have "(m)" meaning mitigated if   close of candle > resistance level , this level become invalid and can be removed in chart (there is setting for keep
作者のその他のプロダクト
Keltner Channel Indicator Keltner Channel is an oscillator like Bollinger Bands. Keltner Channel is a very good tool to time entries for your strategy. Keltner Channel displays a channel where price is supposed to stay unless we are in overbought or oversold situations. Various strategies use Keltner Channel indicator successfully to spot overbought / oversold situations and look for reversals. Keltner Channel indicator uses ATR to determine overbought and oversold situations. Inputs of the indi
Round Numbers Levels indicator for MT4 Round Numbers indicator is a simple but useful indicator to draw 00 and 50 price levels in your chart. These levels act as supports and resistances, and therefore should be taken into account when trading. These levels can be used as profit targets or entry points. Inputs of the indicator are: TGridColor00: color to be used for xx00 levels GridStyle00: line style to be used for xx00 levels GridWidth00: line width to be used for xx00 levels GridColor50:
FREE
Naked Forex Kangaroo Tail Indicator for MT4 Kangaroo Tail Indicator is a pattern recognition indicator for Forex, Stocks, Indices, Futures, Commodities and Cryptos. The Kangaroo Tail is a multi-bar pattern. The Kangaroo Tail pattern is very effective and is very simple to trade. The strategy that comes with the Kangaroo Tail is based on price action. The indicator does what it was designed for: displaying Kangaroo Tail patterns.   Don't expect to follow the up and down arrows and make money
Naked Forex Tweezer Pro Indicator Tweezer Pro Indicator is a pattern recognition indicator for Forex, Stocks, Indices, Futures, Commodities and Cryptos. The standard Tweezer is a two bar pattern. Our enhanced version is a multi-bar pattern. We filter the patterns for you so that you only get the   best and most effective patterns   and ignore the noise. The Tweezer pattern is a simple and effective pattern to trade. The strategy that comes with the Tweezer is based on price action. The Tweez
Naked Forex Tweezer Standard Indicator Tweezer Indicator is a pattern recognition indicator for Forex, Stocks, Indices, Futures, Commodities and Cryptos. The standard Tweezer is a two bar pattern. Our enhanced version is a multi-bar pattern. We filter the patterns for you so that you only get the     best and most effective patterns   and ignore the noise. The Tweezer pattern is a simple and effective pattern to trade. The strategy that comes with the Tweezer is based on price action. The i
Naked Forex Big Shadow IndicatorBig Shadow Indicator is a pattern recognition indicator for Forex, Stocks, Indices, Futures, Commodities and Cryptos. When you have a Big Shadow on your chart then this is a strong signal meaning that you might be ahead of a reversal. You can take other elements (momentum, trend, volatility, price action, fundamentals) to build a complete strategy and confirm your entries. Beware that you might not make money just following the arrows generated by the pattern reco
TTM Squeeze Indicator TTM Squeeze is an indicator to time entries based on volatility. TMM Squeeze might well be one of the best and most overlooked indicator. It was created by famous trader John Carter and is also used by many traders like Nathan Bear. Why is the TTM Squeeze indicator important? Because in trading correct timing entries might be more important than picking the right direction.   This is a concept that is not very well understood in the trading community. Most trader think th
Inside Bar Indicator Inside Bar is a very popular candlestick pattern. Inside Bar indicator can be used to trade Forex, Stocks, Indices, Futures, Commodities and Cryptos. The Inside Bar indicator will search for inside bar candles pattern in the chart and will generate display them. The indicator is also able to generate alerts in your screen or sent to your phone. Inputs of the indicator are: Symbol : type of char symbol to be displayed in the chart to show Inside Bar patterns CustomCode
Engulfing Bar IndicatorEngulfing Bar indicator is a pattern recognition indicator for Forex, Stocks, Indices, Futures, Commodities and Cryptos. The Engulfing Bar indicator is an enhanced pattern of the popular Engulfing Bar to  keep only the best patterns produced in the market. The strategy that comes with the Engulfing Bar is based on  price action. Inputs of the indicator are: Distance: distance in pixels relative to top or bottom of candle to display the arrow symbol UseAlerts (true/false):
Pin Bar Indicator The Pin Bar indicator is a pattern recognition indicator for Forex, Stocks, Indices, Futures, Commodities and Cryptos. The strategy that comes with the Pin Bar pattern is based on price action. Inputs of the indicator are: Distance : distance in pixels relative to top or bottom of candle to display the arrow symbol UseAlerts (true/false): enable alerts PopAlerts (true/false): enable alerts in the popup window EmailAlerts (true/false): enable email alerts PushAlerts (true/fa
Naked Forex Kangaroo Tail Pro Indicator Kangaroo Tail Pro Indicator is a pattern recognition indicator for Forex, Stocks, Indices, Futures, Commodities and Cryptos. The Kangaroo Tail is a multi-bar pattern. The Kangaroo Tail pattern is very effective and is very simple to trade. The strategy that comes with the Kangaroo Tail is based on price action. The indicator does what it was designed for: displaying Kangaroo Tail patterns.   Don't expect to follow the up and down arrows and make money
Bar Strength Divergence Indicator for MT4 BarStrength Indicator is an exclusive indicator to trade Forex, Stocks, Indices, Futures, Commodities and Cryptos. BarStrength Indicator shows the strength of each candle. The indicator shows in a separate windows candles relatively to 2 price levels representing resistance and support in the market. Once candle is near resistance it is highly probable that price movement will change direction and will go down in the next candles. Once candle is near
Fisher Kuskus Indicator Fisher Kuskus is an indicator used by scalpers on low time frames like M1. The Fisher Kuskus is now available for Metatrader platform. Inputs of the indicator are: Period : period to be used for calculation of the indicator PriceSmoothing : value of 0.0 to 0.99 IndexSmoothing : value of 0.0 to 0.99 The indicator can be used with any time frame. It can be used with any class of assets: Forex, Stocks, Indices, Futures, Commodities and Cryptos. Other indicators for MT4:
High Low indicator for MT4
Renaud Herve Francois Candel
5 (1)
HighLow Arrow Indicator HighLow Arrow is a simple indicator to be used to signal major lows and major highs in your chart. This indicator is not intended to be used to trade alone but more as an alert that a turning point might be forming.  In this case the HighLow Arrow indicator signals that a new high or a new low is forming and that traders can prepare for seeking new signals. The formation of the High or the Low is confirmed after 2 bars have been closed. In the meantime, the alert can b
Heiken Color Indicator Heiken Color is a simple indicator showing Heiken Ashi candles color, not in your chart but rather in a separate window. The indicator is useful if you want to use Heiken Ashi indicator without changing your chart display. Heiken Ashi can be used to filter signals or spot better entry after another indicator gave you a signal. Heiken Color indicator has no inputs. Heiken Color indicator can be used with any class of assets: Forex, Stocks, Indices, Futures, Commodities
FX Sniper Magenta Indicator FX Sniper Magenta is an exclusive and   leading indicator   to trade Forex with your Metatrader trading platform. FX Sniper Magenta is able to analyze market participants behavior and to predict changes in the price direction even before movement starts. Most indicators are lagging indicators and are useless. FX Sniper Magenta is a unique   leading indicator . The indicator displays arrows in your chart (please see screenshot attached) showing the probable directio
FX Sniper Yellow Indicator FX Sniper Yellow is an exclusive   leading indicator   to trade Forex with your Metatrader trading platform. FX Sniper Yellow is able to analyze market participants behavior and to predict changes in the price direction even before movement starts. Most indicators are lagging indicators and are useless. FX Sniper Yellow is a unique   leading indicator . The indicator displays arrows in your chart (please see screenshot attached) showing the probable direction of pri
FX Sniper Orange Indicator FX Sniper Orange is an exclusive indicator to spot situations where market has gone too far and market could reverse soon after. The indicator displays arrows in your chart indicating probable future price action (see screenshot attached). By default, it uses orange arrows. FX Sniper Orange never repaints. Once candle is closed signal is confirmed and arrow will never disappear. Users of the indicator can setup alerts when new arrows are displayed in the chart. In
VWAP indicator for MT4
Renaud Herve Francois Candel
Moving VWAP Indicator Moving VWAP is an important indicator drawing the Volume-Weighted Average Price (VWAP). The VWAP is a reference used by institutional traders and acts as a level of support / resistance. If price is above VWAP then means market is bullish. If price is below VWAP then means market is bearish. It can be used to enter in the market with low risk (near VWAP) and also identify the correct direction of the market. The Moving VWAP is as simple as a Simple Moving Average. The m
Normalized Volume 99% of indicators are based on price analysis. This indicator is based on volume. Volume is overlooked piece of information in most trading systems. And this is a big mistake since volume gives important information about market participants. Normalized Volume is an indicator that can be used to confirm reversal points. The indicator code volume with colors indicating high, normal and low volume. You could enhance dramatically your trading system using volume analysis. 
Fx Levels Premium Indicator Support and Resistance are important concepts in trading. Fx Levels Premium was created to easily draw important levels of support and resistance for the active trader. The indicator will give you all important levels (support/resistance) to watch for a wide range of assets. Trading without these levels on your chart is like driving a car for a long journey without a roadmap. You would be confused and blind. Support and resistance levels should be used as guideline
Breakout Impulse IndicatorBreakout Impulse Indicator is a pattern recognition indicator for Forex, Stocks, Indices, Futures, Commodities and Cryptos. The Breakout Impulse is a multi-bar pattern. The purpose of the pattern is to identify a fast change in momentum. This type of change can announce the start of a big directional move. Inputs of the indicator are: Distance: distance in pixel relative to top or bottom of candle to display the arrow symbol MaxBars: number of bars back used to calcula
Daily Pivots Multi Indicator Daily Pivots Multi is an exclusive indicator to draw your pivots levels and much more. Most indicators draw daily pivots for the day. Daily Pivots Multi is able to draw levels for different days. The indicator can do the calculation for unlimited number of days backward. It means that you can draw the levels for today but also for the past days. This is very useful if you want to study a strategy with Pivots levels over a period of time. Another problem is that e
Smart Moving Averages Indicator Smart Moving Averages is an exclusive indicator for Metatrader platform. Instead of calculating moving averages for the selected chart time frame, the Smart Moving Averages indicator gives you the opportunity to calculate moving averages independently from the chart time frame. For instance you can display a 200 days moving average in a H1 chart. Inputs of the indicator are: Timeframe : timeframe to be used for the calculation of the moving average Period : m
Market Momentum Alerter Market Momentum Alerter will inform you about danger to operate in the market. Imagine you see a very nice setup (Forex, Stocks, Indices) and you decide to place your trade... And you finally lose your trade and don't understand what happened. This can happen due to big operations in the market carried out by banks and big institutions. These operations are invisible for most people. Now with the Market Momentum Alerter you will be able to detect those operations...
Matrix Indicator Matrix Indicator is a simple but effective indicator. Matrix indicator displays usual oscillators indicators in a user friendly color coded indicator. This makes it easy to identify when all indicators are aligned and spot high probability entries. Inputs of indicator are: Indicator: RSI, Stochastic, CCI, Bollinger Bands Param1/Param2/Param3: usual settings for the indicator ValueMin: Oversold level for oscillator ValueMax: Overbought level for oscillator The indicator can
OBOS indicator OBOS Indicator is an exclusive indicator to spot entries based on price action. The OBOS Indicator is both effective and user friendly. Indicator uses simple color codes and levels to indicate Overbought and Oversold conditions. No more headache. The OBOS Indicator will only gives you indication when there are possible entries. Means you only get useful information. Inputs of the indicator are: MaxBars : number of bars to display in your chart Smoothing period : number of ba
Trend Direction ADX indicator for MT4 Trend Direction ADX is part of a series of indicators used to characterize market conditions. Almost any strategy only work under certain market conditions. Therefore it is important to be able to characterize market conditions at any time: trend direction, trend strength, volatility, etc.. Trend Direction ADX is an indicator to be used to characterize trend direction: trending up trending down ranging Trend Direction ADX is based on ADX standard indicator
Trend Strength MA indicator Trend Strength MA is a part of a series of indicators used to characterize market conditions. Almost any strategy only works under certain market conditions. Therefore, it is important to be able to characterize market conditions at any time: trend direction, trend strength, volatility, etc. Trend Strength MA is an indicator to be used to characterize trend strength: Up extremely strong Up very strong Up strong No trend Down strong Down very strong Down extremely stro
Trend Direction Up Down indicator Trend Direction Up Down is part of a series of indicators used to characterize market conditions. Almost any strategy only works under certain market conditions. Therefore it is important to be able to characterize market conditions at any time: trend direction, trend strength, volatility. Trend Direction Up Down is an indicator to be used to characterize trend direction (medium term trend): trending up trending down ranging Trend Direction Up Down is based
フィルタ:
レビューなし
レビューに返信