Multi Symbol Bollinger Bands
- インディケータ
- バージョン: 1.0
- アクティベーション: 20

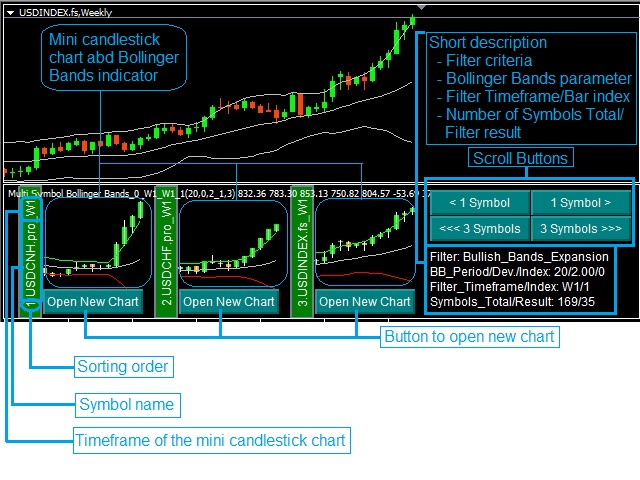
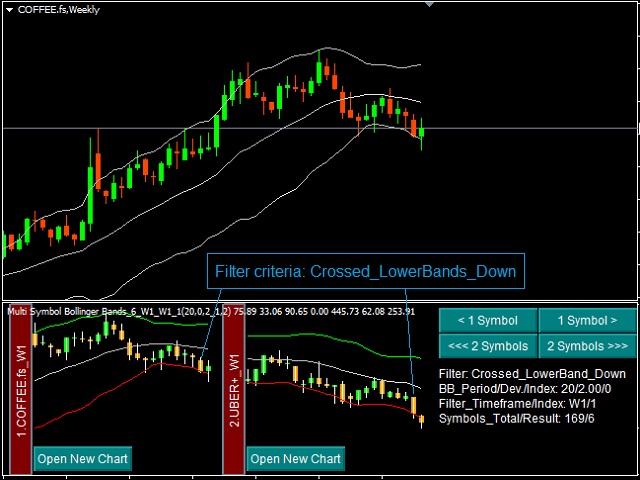
This indicator will display mini candlestick chart with Bollinger Bands indicator of the symbols that pass a filter criteria in the indicator subwindow from 1 to 10 symbols per subwindow.
Feature:
- Button to scroll 1 symbol, click to scroll the displaying symbols back and forth 1 symbol per click
- Button to scroll 1 page, click to scroll the displaying symbols back and forth 1 page(number of symbols per subwindow) per click
- Button to open new chart, click to force mt4 terminal to open a new chart for the displaying symbol
Filter:
The indicator used all symbols in mt4's market watch as a source data to filter with the following criteria;
| Filter Criteria | Character of Target Symbols | Interpretation |
|---|---|---|
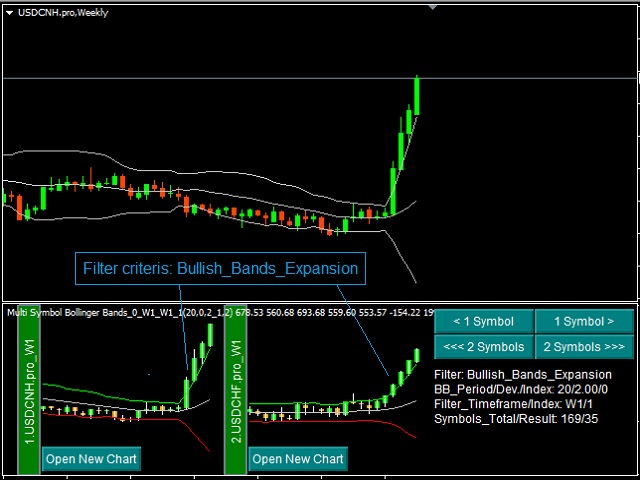
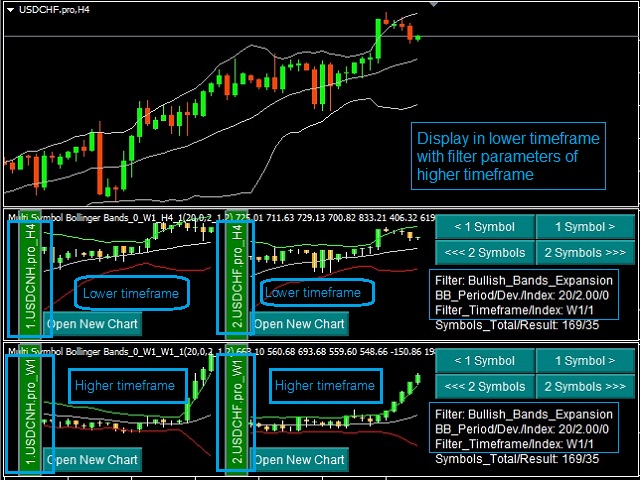
| Bullish_Bands_Expansion | Distance between the upper and lower bands is widening and prices are trading above the middle band(main line) | Volatility in uptrend direction is increasing, the uptrend still having strength |
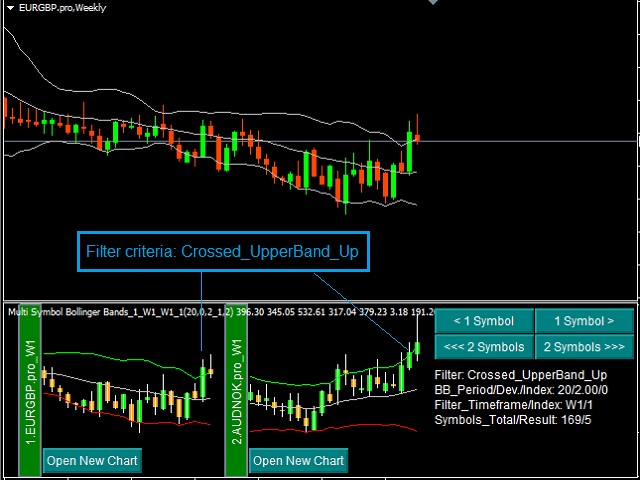
| Crossed_UpperBand_Up | Price of the filter index closed above the upper band from below and prices of the previous index were traded below the upper band | A sign of a beginning or continuation of an uptrend |
| First_Down_From_UpperBand | The filter index is the first candlestick from above that opened and closed below the upper band | A sign of a pause(correction) or weakening of an uptrend strength |
| First_Up_From_MiddleBand | The filter index is the first candlestick from below that opened and closed above the middle band | A confirmation that a buying force is greater than a selling force |
| Crossed_MiddleBand_Up | Price of the filter index closed above the middle band from below and prices of the previous index were traded below the middle band | The first time a buying force wins a selling force |
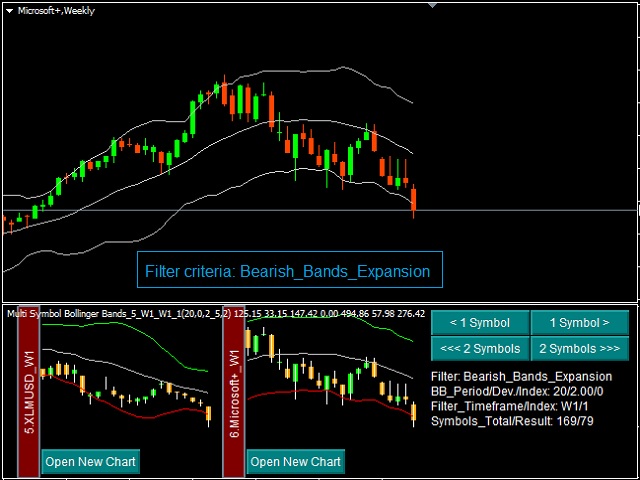
| Bearish_Bands_Expansion | Distance between the upper and lower bands is widening and prices are trading above the middle band | Volatility in downtrend direction is increasing, the downtrend still having strength |
| Crossed_LowerBand_Down | Price of the filter index closed below the lower band from above and prices of the previous index were traded above the lower band | A sign of a beginning or continuation of a downtrend |
| First_Up_From_LowerBand | The filter index is the first candlestick from below that opened and closed above the lower band | A sign of a pause(correction) or weakening of a downtrend strength |
| First_Down_From_MiddleBand | The filter index is the first candlestick from above that opened and closed below the middle band | A confirmation that a selling force is the winner |
| Crossed_MiddleBand_Down | Price of the filter index closed below the middle band from above and prices of the previous index were traded above the middle band | The first time a selling force wins a buying force |
| Bands_Contraction | The upper and lower bands move toward each other | Volatility is decreasing, a sign of weakening of the dominant trend |
| Bands_Width | No filter, sort by distance between upper and lower bands from minimal to maximal | A narrow bands width indicates a long period of consolidation and price breakouts may occur soon |
Parameter:
- Bollinger Bands parameters
- Bands period, set Bollinger Bands period
- Bands shift, set Bollinger Bands shift
- Bands deviations, set Bollinger Bands deviations
- Filter parameters
- Filter timeframe, select data timeframe to apply filter criteria
- Filter shift, set data index for filter
- Filter criteria, select filter criteria from the list
- Display options
- Display timeframe, select timeframe for mini candlestick chart in subwindow
- Symbols per subwindow(max 10), set number of symbols to display per subwindow
- Start from symbol number, set sorting order of the first symbol to be drawn
- Text options
- Text lines space, set linespace for text
- Text size, set overalls font size
- Text color, select overalls font color
- Button property
- Button width, set overalls button width
- Button height, set overalls button height
- Button color,select overalls button color
Recommendation:
For trend following trading strategies select 'Bullish_Bands_Expansion' or 'Bearish_Bands_Expasion' in 'Filter criteria' to find the strong trend symbols in higher timeframe and trade in a lower timeframe.