• 概要
  • レビュー
  • コメント

Fourteen plus nine TD Sequential

Fourteen plus nine

What is it for?

Applying Tom DeMark’s TD Sequential serves the purpose of identifying a price point where an uptrend or a downtrend exhausts itself and reverses.
.
What are the main components of TD Sequential?
TD Sequential has two parts – TD Setup and TD Countdown. The first phase of TD Sequential starts with a TD Setup and is completed with a 9 count. When the 9 count is completed, it is at that point, a price pause, price pullback, or reversal is likely. It is also at that point where TD Sequential starts the second phase with TD Countdown and is completed with a 13 count. When the 13 count is recorded, it is at that point, a price pause, price pullback, or a reversal is likely.
.
Just 9 and 13. Is it really that simple?
Absolutely not. Other DeMark indicators and other technical analysis indicators should align with TD Sequential’s ability to pinpoint potential reversals. For example, if a leading indicator identifies a condition for a market reversal is likely in the near future, the job of TD Sequential is to provide the “when” for the reversal is likely to take place.
.
What is TD Buy Setup, TD Sell Setup, TD Buy Countdown, and TD Sell Countdown?
TD Buy Setup is the name for a TD Setup when the DeMark counts are recorded as prices are trending lower. Conversely, TD Sell Setup is the name for a TD Setup when the DeMark counts are recorded as prices are trending higher. The same goes for TD Countdown. A TD Buy Countdown is the name for TD Countdown when the DeMark counts are recorded as prices are trending lower and a TD Sell Countdown is the name of TD Countdown when the DeMark counts are trending higher.
.
Are the rules of TD Sequential flexible?
Yes. There are many variations floating out there and modifications and filters can be experimented with.
.
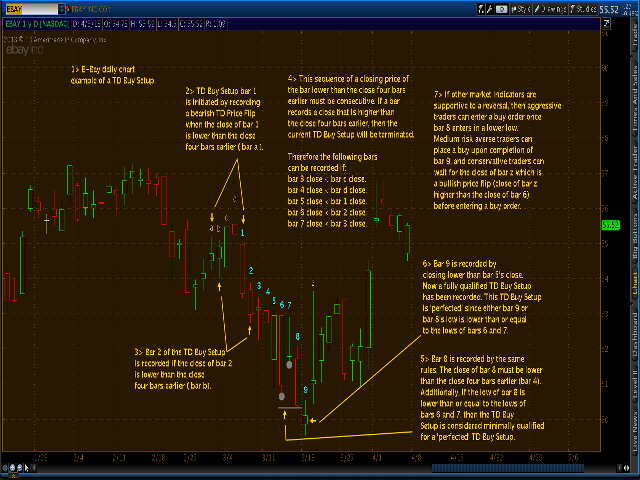
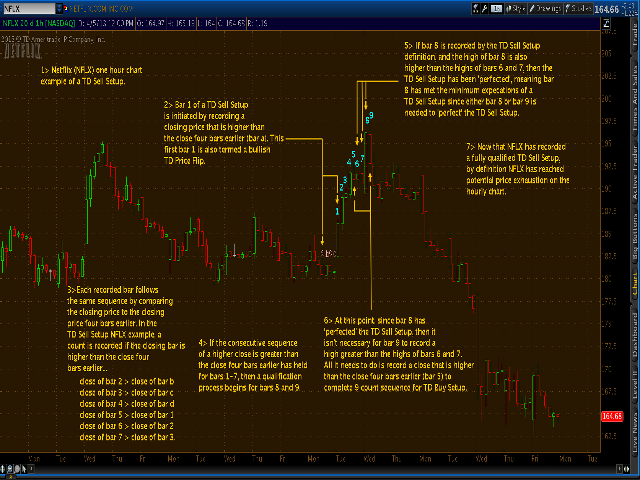
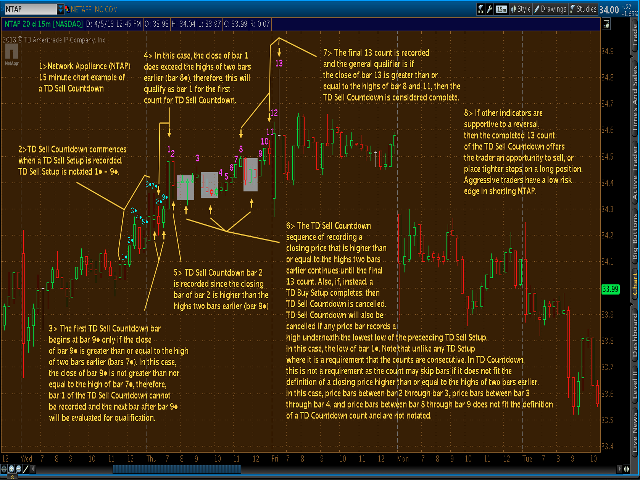
Below are four visual examples in describing the components of TD Sequential.
TD Buy Setup for  Ebay (EBAY)
TD Buy Countdown for  Zynga (ZNGA)
TD Sell Setup for  Netflix (NFLX)
TD Sell Countdown for  Network Appliance (NTAP)
The written explanation of each example is numbered in order.
おすすめのプロダクト
VR Cub
Vladimir Pastushak
VR Cub は、質の高いエントリーポイントを獲得するためのインジケーターです。このインジケーターは、数学的計算を容易にし、ポジションへのエントリーポイントの検索を簡素化するために開発されました。このインジケーターが作成されたトレーディング戦略は、長年にわたってその有効性が証明されてきました。取引戦略のシンプルさはその大きな利点であり、初心者のトレーダーでもうまく取引することができます。 VR Cub はポジション開始ポイントとテイクプロフィットとストップロスのターゲットレベルを計算し、効率と使いやすさを大幅に向上させます。取引の簡単なルールを理解するには、以下の戦略を使用した取引のスクリーンショットを見てください。 設定、設定ファイル、デモ版、説明書、問題解決方法は、以下から入手できます。 [ブログ] レビューを読んだり書いたりすることができます。 [リンク] のバージョン [MetaTrader 5] エントリーポイントの計算ルール ポジションをオープンする エントリーポイントを計算するには、VR Cub ツールを最後の高値から最後の安値までストレッチする必要があります。
This is a trend indicator without redrawing Developed instead of the binary options strategy (by the color of the Martingale candlestick) Also works well in forex trading When to open trades (binary options) A signal will appear in the place with a candle signaling the current candle It is recommended to open a deal for one candle of the current timeframe M1 and M5 When a blue dot appears, open a deal up When a red dot appears, open a trade down. How to open trades on Forex. When a signal is rec
Owl smart levels
Sergey Ermolov
4.62 (53)
MT5版  |   FAQ Owl Smart Levels Indicator   は、 Bill Williams   の高度なフラクタル、市場の正しい波構造を構築する Valable ZigZag、エントリの正確なレベルをマークする Fibonacci レベルなどの一般的な市場分析ツールを含む 1 つのインジケーター内の完全な取引システムです。 利益を得るために市場と場所に。 戦略の詳細な説明 インジケータを操作するための指示 顧問-取引助手 プライベートユーザーチャット ->購入後に私に書いて、私はプライベートチャットにあなたを追加し、あなたはそこにすべてのボーナスをダウンロードすることができます 力はシンプルさにあります! Owl Smart Levels   取引システムは非常に使いやすいので、専門家にも、市場を勉強し始めて自分で取引戦略を選択し始めたばかりの人にも適しています。 戦略と指標に秘密の数式や計算方法が隠されているわけではなく、すべての戦略指標は公開されています。 Owl Smart Levels を使用すると、取引を開始するためのシグナルをすばやく確認し、
"The trend is your friend" is one of the best known sayings in investing, because capturing large trendy price movements can be extremely profitable. However, trading with the trend is often easier said than done, because many indicators are based on price reversals not trends. These aren't very effective at identifying trendy periods, or predicting whether trends will continue. We developed the Trendiness Index to help address this problem by indicating the strength and direction of price trend
これは、キャンドルの終値を予測する指標です。 このインジケータは、主にD1チャートでの使用を目的としていますが. この指標は、従来の外国為替取引とバイナリオプション取引の両方に適しています。 インジケーターは、スタンドアロンのトレーディングシステムとして使用することも、既存のトレーディングシステムへの追加として機能させることもできます。 このインジケーターは、現在のキャンドルを分析し、キャンドル自体の内部の特定の強度係数と、前のキャンドルのパラメーターを計算します。 したがって、この指標は、市場の動きのさらなる方向性と現在のキャンドルの終値を予測します。 この方法のおかげで、この指標は、短期の日中取引だけでなく、中期および長期の取引にも適しています。 インジケーターを使用すると、市場の状況の分析中にインジケーターが生成する潜在的な信号の数を設定できます。 インジケーターの設定には、このための特別なパラメーターがあります。 また、インジケーターは、チャート上のメッセージの形式で、電子メールで、およびPUSH通知の形式で、新しい信号について通知することができます。 購入後は必ず私に書いて
Advanced Trend Regime
Shellard Securities (Pty) Ltd
The indicator has been designed to function on any time-frame and any pair.   This regime filter will help the trader better evaluate whether the current market is trending, and in which direction. It quickly reacts to changes in market dynamics using a series of advanced calculations. The user is able to select whether the calculation remains standard, or if a further filter constraint is added to the calculation.   A Yellow moving average of the signal has been included for the trader to smoot
The Th3Eng PipFinite indicator is based on a very excellent analysis of the right trend direction with perfect custom algorithms. It show the true direction and the best point to start trading. With StopLoss point and Three Take Profit points. Also it show the right pivot of the price and small points to order to replace the dynamic support and resistance channel, Which surrounds the price. And Finally it draws a very helpful Box on the left side on the chart includes (take profits and Stop loss
トレンドトレーディング は、タイミングのプルバックとブレイクアウトにより、市場で起こっているトレンドから可能な限り利益を得るように設計された指標です。確立されたトレンドの中で価格が何をしているかを分析することにより、取引の機会を見つけます。 [ インストールガイド | 更新ガイド | トラブルシューティング | よくある質問 | すべての製品 ] 自信を持って効率的に金融市場を取引する むち打ちにならずに確立されたトレンドから利益を得る 収益性の高いプルバック、ブレイクアウト、早期の逆転を認識する この指標は、独自の品質とパフォーマンスを分析します 複数時間枠のダッシュボードを実装します インジケーターは再描画されていません 電子メール/音声/視覚アラートを実装します 確立されたトレンドは多くの取引機会を提供しますが、ほとんどのトレンド指標はそれらを完全に無視しています。インジケーターの解釈はかなり簡単です: (1) トレンドの変化 (2) トレンドの方向への後退 (3) トレンドの方向へのブレイクアウト 赤いダッシュ は下降トレンド中の修正です 青いダッシュ は上昇ト
Chart Patterns Detect 15 patterns (Ascending Triangle, Descending Triangle, Rising Wedge, Falling Wedge, Bullish Flag, Bearish Flag, Bullish Rectangle, Bearish Rectangle Symmetrical triangle, Head and Shoulders, Inverted Head and Shoulders, Triple top, Triple Bottom, Double Top, Double Bottom) Use historical data to calculate the probability of each pattern to succeed (possibility to filter notification according to the chance of success) gives graphic indication about the invalidation level and
Power Renko is an indicator which plots Renko bricks underneath the chart using a histogram. You can select the brick size and the timeframe of the Renko bricks as well as whether or not to use the close price or the high/low price of the candles. Renko bricks are based on price alone, not time, therefor the Renko bricks will not be aligned with the chart's time. They are extremely useful for trend trading and many different strategies can be formed from them. Buffers are provided allowing you t
This indicator displays Stochastic osc signals on the price chart and allows the user to receive notifications of such signals. The Stochastic indicator is a classic and proven indicator of the technical analysis of the markets. Despite its age, it is still relevant today. Depending on the settings, the indicator allows you to work effectively on various TFs and any markets. Signals are given on fully formed bars and are not redrawn. Custom Parameters: Stochastic_Price (0-1) - The applied pric
[ZhiBiCCI]インディケータは全てのサイクル使用に適しており、そして全ての市場品種にも適しています。 [ZhiBiCCI]緑色の実線は強気の発散の逆転です。緑色の点線は古典的な強気の発散です。 [ZhiBiCCI]赤への実線は逆弱気の発散である。赤い点線は古典的な弱気の発散です。 [ZhiBiCCI]はパラメータ(アラート、メール送信、通知送信)で設定でき、(true)に設定するとインスタント信号をアラームウィンドウに送信し、Eメール、インスタントメッセージを送信できます。 パラメータ設定の説明 [displayAlert]:これはアラームスイッチで、trueに設定され、矢印が表示されればプロンプトに自動的に警告され、falseに設定されれば警告されません。 [sendmail_NO_OFF]:これはメールを送信するためのスイッチで、trueに設定します。矢印が表示されていればMT4で設定したメールボックスにメールを送信し、falseに設定されていればメールを送信しません。 [sendnotification_NO_OFF]:これはインスタントメッセー
Super Gator
Agustinus Biotamalo Lumbantoruan
This indi shows the following 1. Supertrend 2. Alligator (Not a regular alligator) 3. ZigZag 4. Moving Average 5. Trend Continuation/Mini correction Signal (plotted in X) (See screenshots in green background color 6. Early Signal Detection (See screenshots in green background color) You may treat Alligator as the lagging indicator The leading indicator is the supertrend. The zig zag is based on the leading indicator where it gets plotted when the leading indicator got broken to the opposite.
PipFinite Trend PRO
Karlo Wilson Vendiola
4.9 (2775)
Breakthrough Solution For Trend Trading And Filtering With All Important Features Built Inside One Tool! Trend PRO's smart algorithm detects the trend, filters out market noise and gives entry signals with exit levels. The new features with enhanced rules for statistical calculation improved the overall performance of this indicator. Important Information Revealed Maximize the potential of Trend Pro, please visit www.mql5.com/en/blogs/post/713938 The Powerful Expert Advisor Version Automa
Trade with Gann on your side!! MASTER CIRCLE 360 CIRCLE CHART, originally created by Gann admitted that this is “The Mother of all charts”. It is one of the last studies that this great trader left for us. The numeric tab le is apparently quite simple like all the tables and is based on square numbers, the SQUARE OF 12 and is by evolution, one of the most important square numbers. Here we can find CYCLE, PRICE AND TIME thanks to angles and grades, to show past and future support and resistance.
The main idea of this indicator is rates analysis and prediction by Fourier transform. Indicator decomposes exchange rates into main harmonics and calculates their product in future. You may use the indicator as a standalone product, but for better prediction accuracy there is another related indicator - FreqoMaster - which uses FreqoMeterForecast as a backend engine and combines several instances of FreqoMeterForecast for different frequency bands. Parameters: iPeriod - number of bars in the ma
無限からの通貨の強さを測定するためのこの革新的な指標は、長い間取引されているダフ屋やトレーダーにとって不可欠な助手です。 通貨の強さ/弱さを分析するためのシステムは、世界の主要なトレーダーによって市場で長い間知られており、使用されてきました。 任意の裁定取引は、この分析なしでは完全ではありません。 私たちの指標は、互いに関連して基本通貨の強さを簡単に決定します。 これは、インスタント分析を可能にし、最強のエントリポイントを検索し、すべてまたは現在の通貨ペアの折れ線グラフが表示されます。 インジケータは直感的で、すぐに見つけて任意のペアに切り替えることができ、地下室とメインチャートの両方に配置できるモバイルパネルがあります。 通貨の強さの変化の通知のタイマーモードは、トレーダーに電話で通知を受け取る機会を与えます。  通貨パワーメーターインフィニティ指標を使用するためのいくつかの戦略: 1. 通貨の強さの線形表示のチャートを使用して、交差点を新興トレンドの信号として検索します 2. トレンド反転信号が表示された後、強い通貨の方向に頭皮 3. 通貨の強さの発散分析を使用して、
Insider Scalper Binary This tool is designed to trade binary options. for short temporary spends. to make a deal is worth the moment of receiving the signal and only 1 candle if it is m1 then only for a minute and so in accordance with the timeframe. for better results, you need to select well-volatile charts.... recommended currency pairs eur | usd, usd | jpy .... the indicator is already configured, you just have to add it to the chart and trade .... The indicator signals the next can
Noize Absorption Index - is the manual trading system that measures the difference of pressure between bears forces and bulls forces. Green line - is a noize free index that showing curent situation. Zero value of index shows totally choppy/flat market.Values above zero level shows how powerfull bullish wave is and values below zero measures bearish forces.Up arrow appears on bearish market when it's ready to reverse, dn arrow appears on weak bullish market, as a result of reverse expectation. S
The LineMagnit Indicator for MT4 is a highly precise tool that builds support and resistance levels which magnetically attract prices. This feature allows traders to easily determine the most probable entry and exit points in the market, as well as identify the market's directional forces, as levels are based on capital inflows into the instrument. Equipped with an intuitively understandable graphical interface, the LineMagnit Indicator enables users to quickly locate and analyze support and res
フィボナッチリトレースと拡張ラインツール DiNapoliポイント取引方法とゴールデンセクション取引を使用するトレーダーにとって理想的なMT4プラットフォームのフィボナッチリトレースと拡張ラインツール 主な特長: あなたはフィボナッチリトレースメントの複数のセットを直接描くことができ、重要なリターンポイント間の関係は一目瞭然です。 2.フィボナッチ拡張を描画することができます。 3.フィボナッチフォールドバックとラインの延長は、簡単な観察と数値表示のために左右に動かすことができます。 4.チャートは非常に爽やかな 5.数字キーでサイクルを切り替えることができます。 ファンクションキー: 1。 [戻るを押す、要求に応じて描画する、最大8つのグループにする 2。拡張]を描くには[押す] 3。 \を押すと、現在のサイクルの下にあるすべての拡張機能と折り畳みが削除されます 4。フォールドバックを移動して削除して展開する (1)最初のフォールドバックセットのF5行をクリックします。 一度クリックすると(黄色に変わります)、キーボードのDel
Candle GAP
Thushara Dissanayake
ローソク足ギャップ インジケーターは、曜日ごとのローソク足ギャップを自動的に識別するため、 ギャップ取引戦略を 利用するトレーダーにとって不可欠なツールです。ギャップとは、連続する 2 日間の終値と始値の間の価格レベルの差を指します。このインジケーターは、共通、離脱、継続、枯渇の 4 種類のギャップ パターンを認識します。このインジケーターをチャートに組み込むことで、トレーダーはシグナルを検証し、取引の意思決定を強化できます。 ローソク足 GAP インジケーターの重要な特徴の 1 つは、D1 (日次) の下の任意の時間枠および任意のシンボルまたは商品に対して使用できる多用途性です。使いやすいパラメータを提供し、あらゆる経験レベルのトレーダーが利用できるようになります。このインジケーターはチャート上にギャップ パターンを迅速に描画し、迅速な分析と意思決定を可能にします。そのシンプルさにより使いやすさが向上し、簡単で効率的な取引体験が保証されます。 インジケーターのデータ表示パラメーターを使用すると、トレーダーはギャップ情報の外観をカスタマイズできます。ユーザーは、各曜日に関連付けられたテ
This is an arrow indicator without a future function,developed based on the most advanced profit trading algorithms.It has the most innovative and advanced dual trend analysis module, as well as the latest and highly effective market trend prediction algorithm.Trends are your friends, and following larger trends can earn the maximum profit in foreign exchange. This indicator helps traders identify current trends and track them. Someone once made a profit of 10 times in a week by relying on it.No
For sure, this indicator has become very popular amongst traders. Through coding this indicator will give you the most accurate levels possible for your trading analysis. We have also added in the ability for you to receive alerts when the price breaks above or below a Support or Resistance lines! HOW TO USE The red rectangles represent your resistance/supply zone. The green rectangles represent your support/demand zone.  BONUS FEATURES We coded this indicator with the ability to switch between
The Stepping Trend Indicator     The Steppi ng Trend indicator uses the  average true range  (ATR indicator) in its calculation. This gives you control to set your own average true range period, I set the Default as 10.   Indicator Details. Green Arrow Up: This means you are at the starting point of a new bullish trend, it’s time to buy.   Red  Arrow  Down : This means you are at the starting point of a new  bearish  trend, it’ s time to sell .   What if you miss the Arrow Signal?   No
The main idea of this indicator is rates analysis and prediction by Fourier transform. The indicator decomposes exchange rates into main harmonics and calculates their product in future. The indicator shows 2 price marks in history, depicting price range in the past, and 2 price marks in future with price movement forecast. Buy or sell decision and take profit size are displayed in a text label in the indicator window. The indicator uses another indicator as an engine for calculations - FreqoMet
The Chaikin Oscillator is a technical indicator developed by Marc Chaikin that combines price and volume data to measure the accumulation and distribution of a financial instrument. It aims to identify potential buying and selling opportunities in the market. The Chaikin Oscillator is calculated by subtracting a 10-day exponential moving average of the Accumulation Distribution Line (ADL) from a 3-day exponential moving average of the ADL. Here's how to use the Chaikin Oscillator indicator in tr
Gvs Undefeated Trend   indicator is designed for trend and signal trading. This indicator generates trend signals.  It uses many algorithms and indicators to generate this signal. It tries to generate a signal from the points with the highest trend potential. This indicator is a complete trading product. This indicator does not need any additional indicators.  You can only trade with this indicator. The generated signals are displayed on the graphical screen.  Thanks to the alert features you ca
The indicator displays the data of the Stochastic oscillator from a higher timeframe on the chart. The main and signal lines are displayed in a separate window. The stepped response is not smoothed. The indicator is useful for practicing "manual" forex trading strategies, which use the data from several screens with different timeframes of a single symbol. The indicator uses the settings that are identical to the standard ones, and a drop-down list for selecting the timeframe. Indicator Parame
このプロダクトを購入した人は以下も購入しています
TrendMaestro
Stefano Frisetti
5 (2)
note: this indicator is for METATRADER4, if you want the version for METATRADER5 this is the link: TRENDMAESTRO recognizes a new TREND in the bud, he never makes mistakes. The certainty of identifying a new TREND is priceless. DESCRIPTION TRENDMAESTRO identifies a new TREND in the bud, this indicator examines the volatility, volumes and momentum to identify the moment in which there is an explosion of one or more of these data and therefore the moment in which prices have strong probability of f
This indicator is based on the mathematics of the great trader W.D. Ganna. With its help, you can easily find strong levels by analyzing swings to find the optimal entry point. The indicator works on all instruments and all timeframes. The indicator is fully manual and has control buttons. All you need to do is press the NEW button, a segment will appear, which you can place on any movement, swing or even 1 candle that you want to analyze. By placing the segment, press the OK button. A grid (th
Weis Wave with Alert
Trade The Volume Waves Single Member P.C.
4.79 (19)
Rental/Lifetime Package Options and Privileges' * For optimum results the yearly or lifetime package is suggested due to live training and Discord  channel trading with the  creator! Rent Monthly Six Months   Yearly/Lifetime Weis Wave with Speed with Alert+Speed Index x x x Manual  x x x Quick Set up Video x x x Blog x x x Lifetime Updates x x x Setup and Training Material x x Free Rectangle Break Alert Tool      x Discord Access Channel "The SI traders" x 2-hour live methodology traini
The indicator is designed to work on any trading platform. The program is based on proprietary algorithms and W.D.Ganna's mathematics, allowing you to calculate target levels of price movement based on three points with the highest degree of certainty. It is a great tool for stock trading. The indicator has three buttons: NEW - call up a triangle for calculation. DEL - delete the selected triangle. DELS - completely remove all constructions. The probability of achieving the goals is more than 80
How to use Pair Trading Station Pair Trading Station is recommended for H1 time frame and you can use it for any currency pairs. To generate buy and sell signal, follow few steps below to apply Pair Trading Station to your MetaTrader terminal. When you load Pair Trading Station on your chart, Pair Trading station will assess available historical data in your MetaTrader platforms for each currency pair. On your chart, the amount of historical data available will be displayed for each currency pai
This indicator identifies and displays zones, as it were areas of strength, where the price will unfold. The indicator can work on any chart, any instrument, at any timeframe. The indicator has two modes. The indicator is equipped with a control panel with buttons for convenience and split into two modes. Manual mode: To work with manual mode, you need to press the NEW button, a segment will appear. This segment is stretched over the movement and the LVL button is pressed. The level is displayed
フルSTOインジケータ(3つのSTOインジケータのすべてのバージョンを含む:プレミアム、ゴールド、シルバー) - STABLE TRADE OPTIONは、自動バイナリーオプション取引のために設計されています。 注意深くお読みください! 重要 1つのターミナルで、異なる有効期限を持つ2つのテンプレートを作成します。18:01、18:02のテンプレートは有効期限が1~15分、22:00のテンプレートは有効期限が10~20分です。 勝率:過去5年間で71 資金管理: 預金から0.3 このバージョンのインジケータは、モスクワ時間18:01、18:02、22:00の取引にのみ設定され、有効期限は銀と金が1~15分、プレミアムバージョンは10~20分です。シグナルはローソク足の内側に表示され、すぐに取引を開始します。 インジケータは完全に設定されているので、自分で何かを変更する必要はありません。インストールして取引してください! 実際の口座でstoの全バージョンをチェックし、結果を確認するのに2年以上かかりました。長年のテストの結果、最適なパラメータが選択さ
Full Forex Market View Dashboard
Opengates Success International
5 (2)
FULL FOREX MARKET VIEWダッシュボードインジケーター これは、トレーダーが市場で何が起こっているかを完全に把握できるようにするために作成されたカスタム指標です。 リアルタイム データを使用して市場にアクセスし、取引を成功させるために必要なあらゆる情報を表示します。 インストール: このインジケーターをウィンドウ チャートに添付する前に、MT4 のマーケット ウォッチ パネルに移動し、不要な通貨ペアまたは取引しないすべての通貨ペアを非表示にして、残りをそこに残します。 その理由は、FFMV ダッシュボードが MT4 の気配値表示に表示されるすべての通貨ペアを表示するためです。 最大 30 通貨ペア以下を表示できます。 MT4 の気配値表示でそれ以上だと、FFMV ダッシュボードのフォントと画像がぼやけて変形します。 正しく表示されません。 使用法:      個人取引の場合      バスケット取引の場合 (方法についてはスクリーンショットを参照してください)      複数注文取引にも使用可能      独自の取引システムなどから
"Dragon's Tail" is an integrated trading system, not just an indicator. This system analyzes each candle on a minute-by-minute basis, which is particularly effective in high market volatility conditions. The "Dragon's Tail" system identifies key market moments referred to as "bull and bear battles". Based on these "battles", the system gives trade direction recommendations. In the case of an arrow appearing on the chart, this signals the possibility of opening two trades in the indicated directi
Trend Flasher Trend is your friend is the age old saying quote in trading arena, there are though many ways to gauge the trend and its direction, more scientific measure and logically meaningful will be an ATR break outs to identify and spot the trend and its acceleration, so we created this easy to use trend identification panel and optimized super trend based multi time frame panel entry system to aid and help the traders to make their trading decision. Unique Features of Trend Flasher 1
(Nhaa Momo Oscillator indicator)  —  Title: Navigating Forex Markets with Precision: The Stochastic Indicator  Precision and insight are paramount. Enter the Nhaa Momo Stochastic Indicator Dashboard—a beacon of clarity amidst the complexity of market fluctuations. This ingenious tool empowers traders to harness the power of RSI and Stochastic indicators, seamlessly navigating trends across various timeframes with unparalleled accuracy. Picture this: a sleek dashboard at your fingertips, offeri
DESCRIPTION The CHAOS INDICATOR has been developed to be used for the TRADING STRATEGY OF CHAOS, as described in the book. The book is in italian language only and can be obtained only on my website indicated below. DATAS COLLECTED AND SHOWN ON GRAPHS The CHAOS INDICATOR apply easily to any graph and any asset, and it is a TRADING FACILITATOR, as it identify immediately the following items on any graph: - The GP (= RIGHT PRICE) i.e. the price to which the asset should be attracted within 24
信頼性の低いバイナリオプションのインジケーターにうんざりしていませんか?偽のシグナルを出して損失や失望を招くこともありますよね?それなら、CLOCK INDICATORを探す必要はありません。これはMT4トレーディングプラットフォームで利用できる最高のバイナリオプションのインジケーターです。 高度なアルゴリズムと強力なテクニカル分析ツールを備えたCLOCK INDICATORは、初心者から経験豊富なトレーダーまで、究極のトレーディングツールです。市場のトレンドを正確に予測し、利益を生むトレードの機会を特定し、利益を最大化し、損失を最小限に抑えるのに役立ちます。 他の複雑で使いにくいバイナリオプションのインジケーターとは異なり、CLOCK INDICATORは簡単にインストールしてカスタマイズできます。設定を個別の取引の好みに合わせることができ、すべての主要な通貨ペアと時間枠でシームレスに動作します。 CLOCK INDICATORの特筆すべき特徴の1つは、再描画されない性質です。シグナルが生成されると、チャート上に表示されるため、正確な情報に基づいて的確な取引決定をするこ
MT4インジケーター「イーグルアイ」でバイナリーオプション取引の可能性を引き出す MetaTrader 4(MT4)用の「イーグルアイインジケーター」を使って、バイナリーオプション取引の世界に革命を起こしましょう。この革新的なツールは、レーザーのような精度と比類のない収益性をもたらし、あなたのトレーディング体験を変える準備ができています。 ポテンシャルの境界が崩れ、利益が最大化される世界に飛び込んでください。イーグルアイインジケーターの比類のない精度と揺るぎない信頼性によって、市場の隠された秘密が明らかにされます。細部への緻密な注意を払って設計されたこの先進的なインジケーターは、先進的なアルゴリズム、入念なテクニカル分析、リアルタイムの市場データを組み合わせ、並外れたトレーディングの優位性を提供します。 イーグルアイインジケーターは市場のポイントを的確に把握し、迅速な意思決定をサポートします。直感的なインターフェースと使いやすいデザインにより、初心者のトレーダーでもバイナリーオプションの複雑な世界をスムーズにナビゲートし、その強力な力を最大限に活用することができます。 過去の推測や感情
これはほぼ間違いなく、MetaTraderプラットフォームで見つけることができる最も完全な調和価格形成自動認識インジケーターです。 19種類のパターンを検出し、フィボナッチプロジェクションをあなたと同じように真剣に受け止め、潜在的逆転ゾーン(PRZ)を表示し、適切なストップロスとテイクプロフィットレベルを見つけます。 [ インストールガイド | 更新ガイド | トラブルシューティング | よくある質問 | すべての製品 ] 19の異なる調和価格形成を検出します プライマリ、派生および補完フィボナッチ投影(PRZ)をプロットします 過去の価格行動を評価し、過去のすべてのパターンを表示します この指標は、独自の品質とパフォーマンスを分析します 適切なストップロスとテイクプロフィットのレベルを表示します ブレイクアウトを使用して適切な取引を通知します すべてのパターン比をグラフにプロットします 電子メール/音声/視覚アラートを実装します スコット・M・カーニーの本に着想を得て、この指標は最も純粋で急を要するトレーダーのニーズを満たすように設計されています。ただし、トレードを
A. A2SR とは何ですか ?   * 先行テクニカル指標です (塗り直しなし、ラグなし)。   * Special event :  https://c.mql5.com/1/263/A2SR_Discount_35_percent_in_August_2023.png -- ガイダンス : -- https://www.mql5.com/en/blogs/post/734748/page4#comment_16532516 -- そして https://www.mql5.com/en/users/yohana/blog A2SR には、サポート (需要) とレジスタンス (供給) のレベルを決定する特別な手法があります。 ネットで見かける通常の方法とは異なり、A2SR は実際の SR レベルを決定する独自のコンセプトを持っています。 元の手法はインターネットから取得されたものではなく、インターネット上で公開されたこともありません。 A2SR は、取引スタイルに応じて SR レベルを自動選択します。 時間枠を変更しても、SR レベルはその位置にとどまります。 実際
EZTトレンドインジケーターは、トレンド、プルバック、エントリーの機会を示します。 オプションのフィルタリングとあらゆるタイプのアラートが利用可能です。 電子メールおよびプッシュ通知アラートが追加されます。 また、このインジケーターに基づいた EA も開発中であり、間もなく利用可能になる予定です。 2色のヒストグラムとラインで構成される多機能インジケーターです。 これはトレンドの方向と強さを視覚的に表現したもので、ラインまたはヒストグラム上で発散が何度も見つかります。 このインジケーターは自動パラメーター設定とうまく連携します。 これらは特定の時間枠に対して事前に決定されており、その設定でインジケーターを使用することをお勧めします。 手動モードでは、独自のパラメータを設定できます。 これはマルチタイムフレーム(MTF)インジケーターです。 このインジケーターは、MTF rsi、MTF cci、MACD pro などの他のインジケーターの組み合わせとうまく機能します。 取引される商品の変動が大きいほど、最適なエントリーを見つけるために使用する必要がある時間枠は短くなりま
This is a trend Predictor. Honestly I have to give some credit to some few developers I know personally because they helped pulled this off.  The trend indicator uses special optics to direct the flow of price . it detects where the trend is moving into  It uses price action and a few other embedded custom indicator. You can use it in all timeframes and will be available at a much cooler price.  Please test this Indicator before buying to make sure you like what you see. I can't guarantee th
インジケーターを 1 つしか使用しないためにトレードで頻繁に負ける場合は、この取引ツールを試してください。 この取引ツールは複数のインジケーターを使用します。 私はRSIインジケーターのみを使用するトレーダーをよく観察します。 市場は売られすぎているのにまだ下落している、または市場は買われすぎているのにまだ上昇していることがよくあります。 このため、複数のインジケーターを使用する必要があります。 新しいバージョン V 3.40 MTF PPAAF の紹介: マルチ タイム フレームの正確なプライス アクション矢印フィルター。 この取引ツールは、市場の動きの方向性を強化するためにさまざまな指標を使用します。 この取引ツールで使用される最初の指標はデュアル ストキャスティクスです。 ここでは、ファスト ストキャスティクスとスロー ストキャスティクスという 2 つのストキャスティクスを使用します。 ファストストキャスティクスには、ファストストキャスティクスメインラインとファストストキャスティクスシグナルラインがあります。 同様に、スロー ストキャスティックには、スロー ストキャスティッ
An automatic trend indicator that uses an algorithm to determine impulse signals for scalping and intraday trading. The trend-following indicator automatically calculates potential entry and exit points for trades. The indicator contains a trend line and a target channel for following signals, changing color depending on the direction. Main characteristics Signal colored candles and arrows: blue - downward direction, red - upward direction. Yellow dots for exiting trades are located along
PYTHONFX INCEPTION TRADING SYSTEM THE BROKERS WORST NIGHTMARE... IMPORTANT! After the purchase please send me a private message to receive the installation manual and the setup instructions. We proudly introduce the PYTHONFX ROYAL CIRCLE Inception trading system, your key to financial freedom.   This is the brokers worst nightmare. Seriously! Modern market conditions require modern solutions & if you are still struggling to analyse the charts and struggling to find consistency in the
タイトル: "Daotradingfx - 7年の経験を活かしたウェーブトレーディングの完璧な鍵" 外国為替取引は決して簡単ではありませんが、daotradingfxインジケーターを使用することで、私はウェーブトレーディングでの成功への扉を開ける頼もしいパートナーを見つけました。私の7年の取引経験に基づいて構築されたこのインジケーターは、単なるツールではなく、市場理解とトレーディングの利便性の包括的なキャンバスです。 Daotradingfxは、複数の時間枠を使用する能力で注目されており、これは市場の傾向や異なる視点からの市場のダイナミクスをより深く理解するのに役立つ重要な機能です。複数の時間枠を同時にモニタリングすることで、より正確なトレーディングの意思決定が可能となり、任意の戦略の成功の可能性が高まります。 Daotradingfxのもう一つの大きな利点は、複数の通貨ペアを追跡する柔軟性です。この多様性により、1つの通貨ペアに焦点を当てるだけでなく、市場観察の範囲を広げ、取引の機会を発見する可能性が増します。 特に、Daotradingfxはウェーブトレーディング
Cyclical indicator for trading and predicting the direction of the market. Shows the cyclical behavior of the price in the form of an oscillator. Gives signals for opening deals when rebounding from the upper and lower boundaries of the oscillator. In the form of a histogram, it shows the smoothed strength of the trend. Will complement any trading strategy, from scalping to intraday. The indicator does not redraw. Suitable for use on all symbols/instruments. Suitable time frames for short-term
Fibonacci Retracements Pro The Fibonacci Retracements Pro is a powerful yet easy to use indicator. It automatically plots all the important Fibonacci retracement and extension levels for you. FRP is dynamic powerful and seamlessly adjusts to whatever timeframe you are analyzing. Fibonacci Retracement Pro is optimized for ALL timeframes and ALL Currency pairs, Indices, Commodities, and Cryptocurrency pairs. Trade with improved confidence and maximize your success rate. Benefits Dynamic and Power
The Stochastic Basket Currency Strenght  brings the Stochastic indicator to a new level.  Expanding the boundaries of TimeFrames and mono-currency analysis, the SBCS take the movements of each currency that composes the cross and confront them in the whole basket of 7 crosses.  The indicator works with any combination of AUD, CAD, CHF, EUR, GBP, JPY, NZD, USD pairs and with full automation takes in account every stochastic value (main line) for the selected Time Frame.  After that, the indicator
IMPORTANT; Price is subject to rise at any time from now! Do not miss this offer! Dear trader I am glad to introduce my new tool called Trend Analyser Dashboard to you. The design, style, and settings of this indicator  have been made simple to make its users not take too much time in understanding the indicator itself.   The purpose is to help traders in analysing the direction of the major trend and the status of the trend whether in weak trend or its strong trend. The indicator will also prov
Cluster indicator working in the price channel. For operation, the indicator builds a channel line - (dashed line). Inside the channel, cluster sections are determined that determine the direction of the price movement - (histograms in two directions), start with large arrows. Small arrows are plotted above / below each histogram - indicator increase volatility. The indicator does not redraw the values. Works on any tools and timeframes. Entrances are made when large arrows appear, inside s
Introducing the "Magic Trades" for MetaTrader 4 – your ultimate tool for precision trading in dynamic markets. This innovative indicator revolutionizes the way you perceive market trends by harnessing the power of advanced analysis to detect subtle changes in character, paving the way for optimal trading opportunities. The Magic Trades Indicator is designed to empower traders with insightful entry points and well-defined risk management levels. Through its sophisticated algorithm, this indica
The system resembles the Italian flag and is simple for ordinary people to understand. Any trader with any experience will be able to use it. The Italy trading system generates 3 types of market conditions. Green zone - consider only buy trades. Red zone - consider only sell trades. Empty zone - flat, do nothing. Buy signal: Green zone + a blue arrow appears. Close all positions when an opposite signal (arrow) appears. Sell signal: Red zone + a red arrow appears. Close all positions when an oppo
Dear Onis, This Indicator is used for   GBPUSD, US30 and GOLD on 1-Min Chart . For US30 , Depending on your broker, Minimum Lot Size will differ from 0.01 to 1.0 lots. My Current Account is trading at 1.0 lots at $1 per point . Please check with your Broker what's the Margin Required for your Minimum lot sizes before you trade on your Real account. I have Forward Tested the indicator for around 6 months before releasing it to the public. ( No Demo is available for the Indicator, Strategy
作者のその他のプロダクト
Aikido
MOHAMMED IMAD HUSSEIN BASSEE
This indicator gives you the strength of currencies according to multiple frames With this indicator, you can know the true direction of the currency pair This indicator gives you good advice to bet on the best fighter If you know how to use this indicator, you do not need any other indicators This indicator is suitable for working on long-term, short or medium-term trades. This indicator is your loyal friend
Daenerys Targaryn
MOHAMMED IMAD HUSSEIN BASSEE
This gives you many opportunities and gives you beautiful goals in a short time that you can see for yourself and this indicator depends on the foundations and rules of special knowledge It also gives you entry and exit areas with very good and profitable goals This is an indicator that I have been training on for a long time The results were more than impressive
Gray Wurm
MOHAMMED IMAD HUSSEIN BASSEE
Grey worm  This indicator is a group of indicators combined Volatility and saturation give us buying and selling and many more things Use this indicator with your technical analysis or strategy Do not use it alone and it will give you very good results It is valid to work on all pairs, metals and instruments If you have any question, I will be happy to answer it Please do not forget to rate the good and the positive comment
フィルタ:
レビューなし
レビューに返信