Breakout Impulse indicator for MT4
- インディケータ
-
Renaud Herve Francois Candel
 ITC SOFTWARE is a technology company based in the United States since 2010.
🟠🔴 The company develops financial software and indicators for different trading platforms:
-Metatrader 4 and Metatrader 5
-TradingView
-NinjaTrader - バージョン: 1.30
- アップデート済み: 4 7月 2023
- アクティベーション: 5
Breakout Impulse IndicatorBreakout Impulse Indicator is a pattern recognition indicator for Forex, Stocks, Indices, Futures, Commodities and Cryptos.
The Breakout Impulse is a multi-bar pattern.
The purpose of the pattern is to identify a fast change in momentum.
This type of change can announce the start of a big directional move.
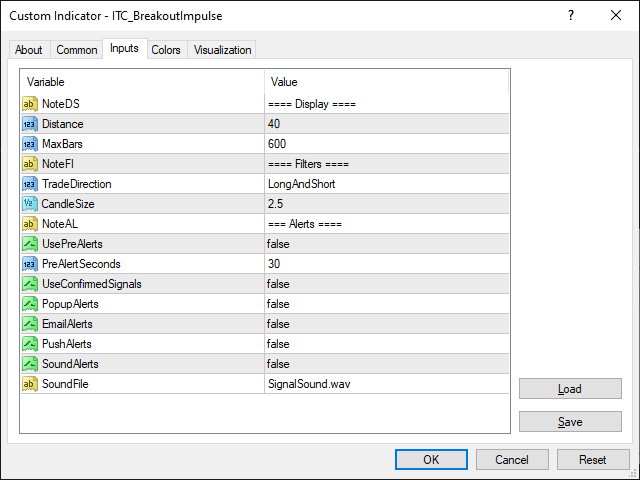
Inputs of the indicator are:
The Breakout Impulse is a multi-bar pattern.
The purpose of the pattern is to identify a fast change in momentum.
This type of change can announce the start of a big directional move.
Inputs of the indicator are:
- Distance: distance in pixel relative to top or bottom of candle to display the arrow symbol
- MaxBars: number of bars back used to calculate the indicator
- TradeDirection (Long/Short/LongAndShort): filter signals for BUY and SELL
- CandleSize: minimum size of candle (2.0 to 4.0 recommended range of values, 2.0 means big candle, 4.0 huge candle)
- UsePreAlerts (true/false): to enable pre-alerts
- PreAlertsSeconds (30): time in seconds before the close of the candle when pre-alerts will be activated (pre-alerts can disappear)
- UseConfirmedSignals (true/false): generate alerts for confirmed signals (at the close of the bar). It is required to set this value to true if you want to receive confirmed signals alerts.
- PopAlerts (true/false): to enable alerts of type Popup window
- EmailAlerts (true/false): to enable alerts of type Email
- PushAlerts (true/false): to enable alerts of type Push Notification
- SoundAlerts (true/false): to enable alerts of type Sound
- SoundFile: file to be used for sound alerts
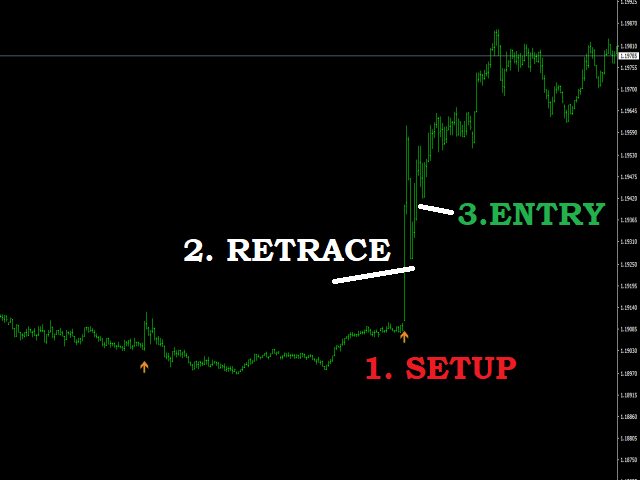
Trading rules:
- For BUY: wait for a bullish Breakout Impulse to print. Wait for a few bars and look at price action after the setup bar. If price does not retrace more than 50% of the setup bar then you can search for an entry like an engulfing bar to confirm (or other entry pattern of your choice). Stop Loss should be placed below the recent low after the setup bar.
- For SELL: wait for a bearish Breakout Impulse to print. Wait for a few bars and look at price action after the setup bar. If price does not retrace more than 50% of the setup bar then you can search for an entry like an engulfing bar to confirm (or other entry pattern of your choice). Stop Loss should be placed above the high of the recent high after the setup bar.
The Breakout Impulse indicator can be used with any time frame.
The Breakout Impulse indicator can be used with any class of assets: Forex, Stocks, Indices, Futures, Commodities and Cryptos.
Other products:
You might also be interested in following products:
- Kangaroo Tail Pro indicator
- Big Shadow indicator
- Fx Levels indicator to draw important support and resistance levels
Other indicators for MT4:
We developed more than 60 indicators and utilities for Metatrader 4 and Metatrader 5.
Indicators for MT5:
All our indicator are developed both for MT4 and MT5.
You can see the complete list of our indicators visiting our profile page.