Fisher Kuskus indicator for MT4
- インディケータ
-
Renaud Herve Francois Candel
 ITC SOFTWARE is a technology company based in the United States since 2010.
🟠🔴 The company develops financial software and indicators for different trading platforms:
-Metatrader 4 and Metatrader 5
-TradingView
-NinjaTrader - バージョン: 2.50
- アップデート済み: 2 7月 2023
- アクティベーション: 5
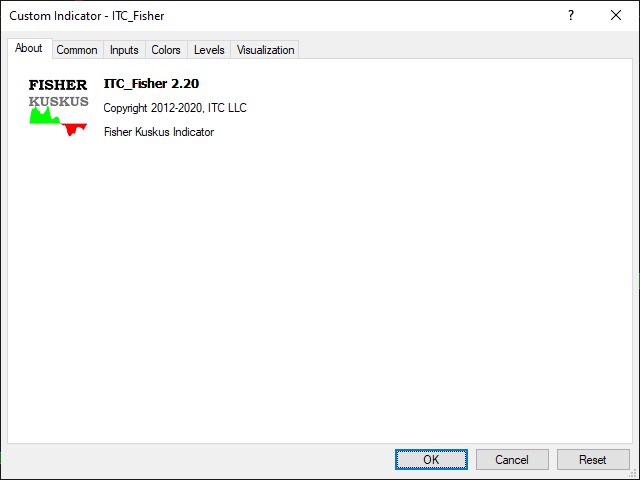
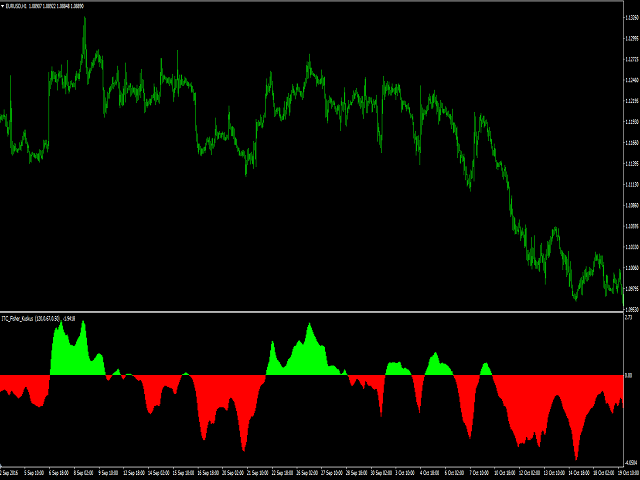
Fisher Kuskus Indicator
Fisher Kuskus is an indicator used by scalpers on low time frames like M1.The Fisher Kuskus is now available for Metatrader platform.
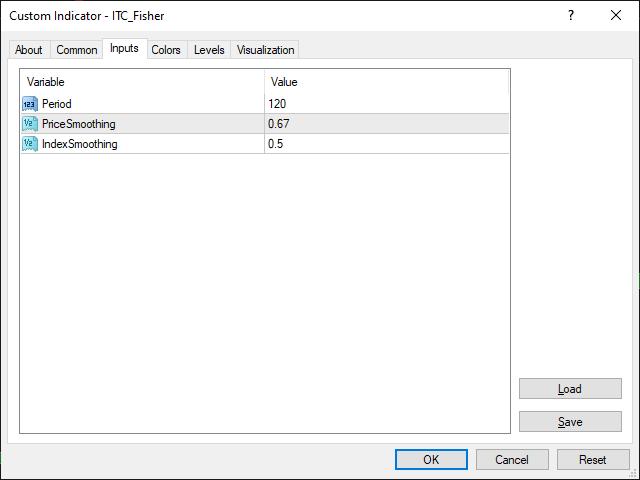
Inputs of the indicator are:
- Period: period to be used for calculation of the indicator
- PriceSmoothing: value of 0.0 to 0.99
- IndexSmoothing: value of 0.0 to 0.99
The indicator can be used with any time frame.
It can be used with any class of assets: Forex, Stocks, Indices, Futures, Commodities and Cryptos.
Other indicators for MT4:
We developed more than 60 indicators and utilities for Metatrader 4 and Metatrader 5.
Indicators for MT5:
All our indicator are developed both for MT4 and MT5.
List of all our indicators:
👉 You can get the complete list of our indicators visiting our profile page.