Inside Bar indicator for MT4
- インディケータ
-
Renaud Herve Francois Candel
 ITC SOFTWARE is a technology company based in the United States since 2010.
🟠🔴 The company develops financial software and indicators for different trading platforms:
-Metatrader 4 and Metatrader 5
-TradingView
-NinjaTrader - バージョン: 1.60
- アップデート済み: 4 7月 2023
- アクティベーション: 5
Inside Bar Indicator
Inside Bar is a very popular candlestick pattern.Inside Bar indicator can be used to trade Forex, Stocks, Indices, Futures, Commodities and Cryptos.
The Inside Bar indicator will search for inside bar candles pattern in the chart and will generate display them.
The indicator is also able to generate alerts in your screen or sent to your phone.
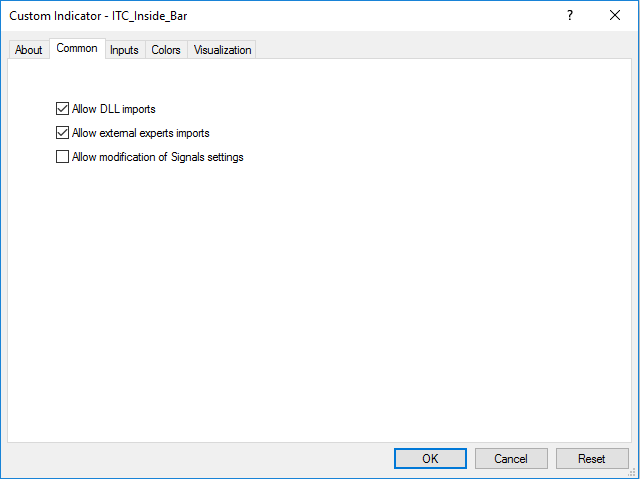
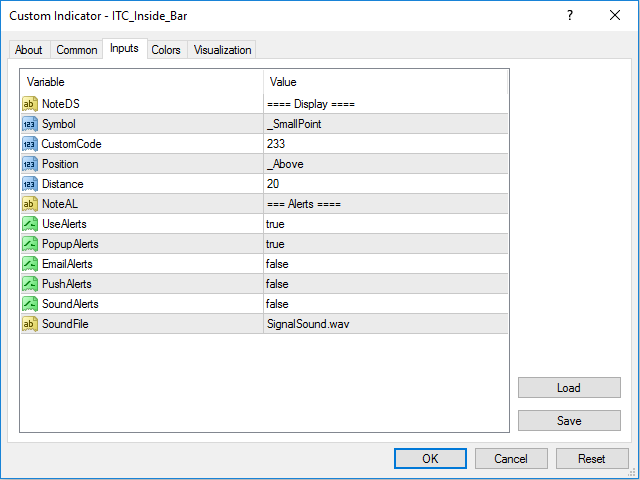
Inputs of the indicator are:
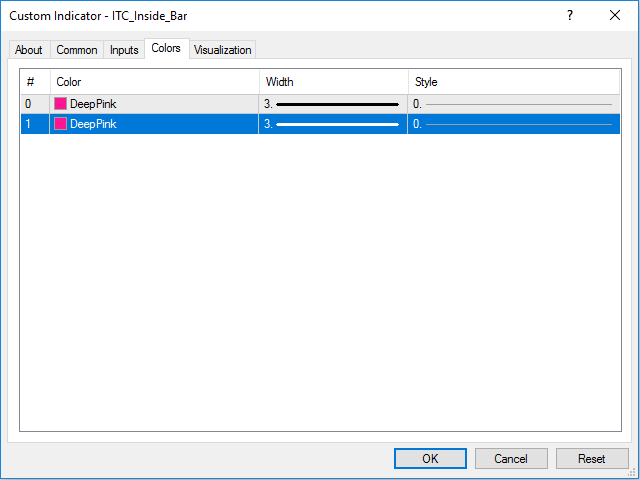
- Symbol: type of char symbol to be displayed in the chart to show Inside Bar patterns
- CustomCode: char code to be used as custom char symbol (works only with Symbol=_Custom)
- Position: position of symbol relative to the candle (above or below the candle)
- Distance: distance in pixel relative to top or bottom of candle to display the char symbol
- UseAlerts (true/false): to enable alerts ( if set to false no alerts will be generated)
- PopAlerts (true/false): to enable alerts of type Popup window
- EmailAlerts (true/false): to enable alerts of type Email
- PushAlerts (true/false): to enable alerts of type Push Notification
- SoundAlerts (true/false): to enable alerts of type Sound
- SoundFile: file to be used for sound alerts
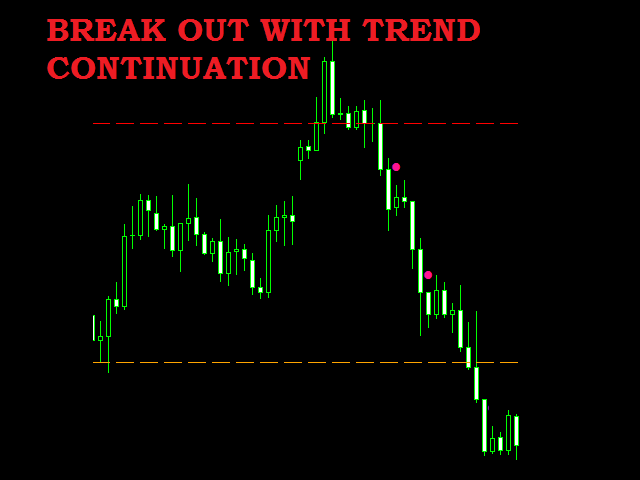
Trading rules
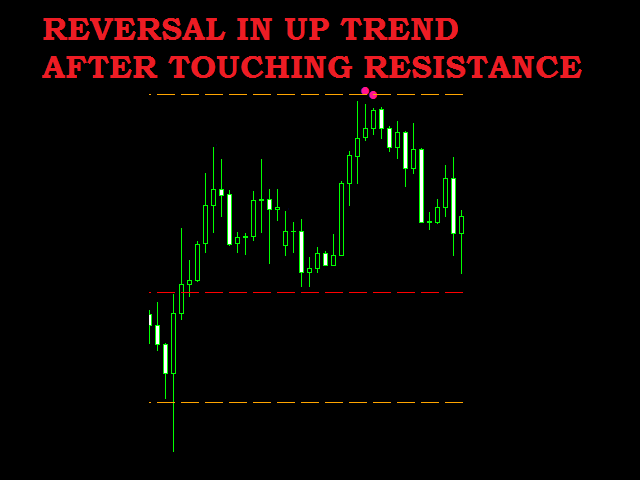
Inside Bar can be traded as reversal or as break out.
Reversals can be traded after an up trend (or down trend) when price reaches resistance level (or support level). Once Inside Bar appears you can enter trade when low of the previous bar (high of the previous bar) is broken. You can place stop on the top of the previous bar (on the low of the previous bar)
For breakouts, Inside Bar can appear in an up trend (or down trend). You can enter in the trade once the high of the previous bar (low of the previous bar) is broken. You can place stop at the low of the previous bar (at the high of the previous bar).
Inside Bar Indicator can be used with any class of asset and with any time frame.
Other indicators for MT4:
We developed more than 60 indicators and utilities for Metatrader 4 and Metatrader 5.
Indicators for MT5:
All our indicator are developed both for MT4 and MT5.
List of all our indicators:
You can see the complete list of our indicators visiting our profile page.