Miraculous Indicator Binary and Forex

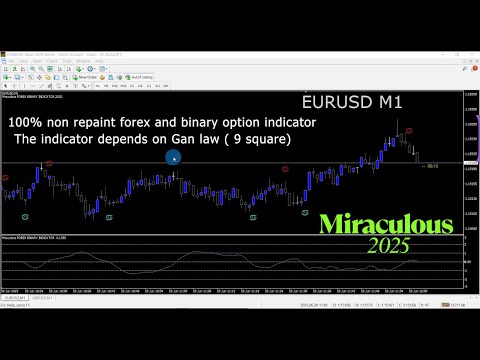
Miraculous Indicator – ガン・スクエア・オブ・ナインに基づく100%非リペイントのFXおよびバイナリーツール

この動画では、FXおよびバイナリーオプションのトレーダー向けに特別に開発された、非常に正確で強力な取引ツールであるMiraculous Indicatorを紹介しています。このインジケーターがユニークなのは、伝説的なガン・スクエア・オブ・ナインガンの振動の法則に基づいている点で、現代の取引で利用できる最も正確な予測ツールの一つとなっています。

Miraculous Indicatorは完全に非リペイントであり、ローソク足が確定した後にシグナルが変化したり消えたりすることはありません。つまり、見たものがそのまま利用できます。これにより、トレーダーは自信を持ってエントリーおよびエグジットを行うための信頼性と一貫性のある根拠を得ることができます。

主な特徴:

  • ガン・スクエア・オブ・ナインとガン理論に基づいて構築
  • 100%非リペイントのシグナルシステム
  • すべての時間枠(M1、M5、H1、H4、日足、週足)で機能
  • FXおよびバイナリーオプション取引の両方に適応
  • 高い精度で明確な売買シグナルを提供
  • スキャルピング、デイトレード、スイングトレードに利用可能
  • ほとんどのMT4プラットフォームと互換性あり

このツールは、初心者からプロのトレーダーまで、より良い情報に基づいた意思決定を支援するように設計されています。通貨、指数、バイナリーオプションのいずれを取引している場合でも、Miraculous Indicatorは市場で優位に立つために必要な「エッジ」を提供します


おすすめのプロダクト
Was: $299  Now: $99   Supply Demand uses previous price action to identify potential imbalances between buyers and sellers. The key is to identify the better odds zones, not just the untouched ones. Blahtech Supply Demand indicator delivers functionality previously unavailable on any trading platform. This 4-in-1 indicator not only highlights the higher probability zones using a multi-criteria strength engine, but also combines it with multi-timeframe trend analysis, previously confirmed swings
Was: $249  Now: $99   Market Profile defines a number of day types that can help the trader to determine market behaviour. A key feature is the Value Area, representing the range of price action where 70% of trading took place. Understanding the Value Area can give traders valuable insight into market direction and establish the higher odds trade. It is an excellent addition to any system you may be using. Blahtech Limited presents their Market Profile indicator for the MetaTrader community. Ins
これはほぼ間違いなく、MetaTraderプラットフォームで見つけることができる最も完全な調和価格形成自動認識インジケーターです。 19種類のパターンを検出し、フィボナッチプロジェクションをあなたと同じように真剣に受け止め、潜在的逆転ゾーン(PRZ)を表示し、適切なストップロスとテイクプロフィットレベルを見つけます。 [ インストールガイド | 更新ガイド | トラブルシューティング | よくある質問 | すべての製品 ] 19の異なる調和価格形成を検出します プライマリ、派生および補完フィボナッチ投影(PRZ)をプロットします 過去の価格行動を評価し、過去のすべてのパターンを表示します この指標は、独自の品質とパフォーマンスを分析します 適切なストップロスとテイクプロフィットのレベルを表示します ブレイクアウトを使用して適切な取引を通知します すべてのパターン比をグラフにプロットします 電子メール/音声/視覚アラートを実装します スコット・M・カーニーの本に着想を得て、この指標は最も純粋で急を要するトレーダーのニーズを満たすように設計されています。ただし、トレードを容易にする
This indicator is, without a doubt, the best variation of the Gann Angles among others. It allows traders using Gann methods to automatically calculate the Gann angles for the traded instrument. The scale is automatically calculated when the indicator is attached to the chart. When switching timeframes, the indicator recalculates the scale for the current timeframe. Additionally, you can enter your own scales for the Gann angles. You can enter your own scales either for both vectors or for each
The   Visual Volatility Clustering   indicator clusters the market based on volatility. The indicator does not redraw and gives accurate data, does not use closing prices. Uses the opening prices or the highs or lows of the previous completed bar. Therefore, all information will be clear and unambiguous. The essence of the indicator is to divide the price market into certain areas according to a similar type of volatility. This can be done in any way. In this example, the indicator is configure
プロトレーダーおよび評価型アカウント(Prop)向けリスク管理・制限監視インジケーター 本ツールは、リスク管理と各種リミットに関する情報をチャート上に表示するのみで、より集中した意思決定をサポートします。インジケーターはポジションの新規/決済/変更を行わず、エキスパートアドバイザー(EA)と干渉しません. 機能 日次および累計ドローダウンの監視 残高(Balance)または有効証拠金(Equity)を基準に日次/累計DDを計算・表示(設定可能)。 設定したリミットまでの残り割合を表示。 チャート上のクリーンでプロフェッショナルなパネル サマリー表:Balance、Equity、現在のP/L、日次/累計DD、アラート閾値。 判断に集中できる読みやすいUI。 リスクに基づくポジションサイズ パーセンテージ/固定金額のリスクと設定したストップロスに基づき概算ロットを算出。 R:R(リスクリワード)比とエントリー、SL、TPをチャートに表示。 アラートと通知 日次/累計DDの閾値に近づいた際にアラート(閾値は設定可能)。 価格がSL/TPに到達、またはその他の定義済みイベント発生時に通知。
インジケータは、指定された係数に基づいて、低、高、極端なボリュームを検索し、指定された色でそれらをペイントします。 Metatraderターミナルの標準ボリューム描画機能に置き換えられます。 キャンドルは、ボリュームの色で着色することもできます。 極端なボリュームを持つローソク足では、最大水平ボリューム(クラスタ/POC)が決定されます。 その位置(押す、中立、停止)に応じて、クラスターにも独自の色があります。 クラスターが影の中にあり、ろうそくが極端なボリュームを持っている場合、反転のための矢印が得られます。 設定でアラートを有効にすることができます。 さらに、インジケーターには、クラスターをシャドウで表示する別のオプションがあります。 入力パラメータ 。 (色と視覚的な設定に関連するいくつかはスキップされます) 。 基本設定 。 Bars Count – 指標が機能する履歴バーの数 。 Data Source - 見積期間の選択。 あなたが切り捨てられ、不完全なように過去の歴史を見ると思われる場合は、あなたが勉強している楽器のためのより多くのM1引用符をダウンロー 。 Ver
Advance Currency Meter is a currency meter that detects strong market trends. This indicator is good for scalping, intraday trading and swing trading. The indicator will detect short term to long term market trends. This will give you good insight which currencies are best to trade as of the moment. Note : Kindly contact me before you make any purchases. This won't work on your account without my permission. Note :   Works well with my MACD Currency Strength Meter
If you are using volume spread analysis, whether your are a beginner or an expert, this system will give you a lot of features and help in your analysis. Please watch the video to see all the features. Features With one click you will find all the VSA patterns on your chart . Bars without opening price. Easy to read volume indicator. Bar reader (Bar type - Close type - Volume type - Spread type). Daily and weekly levels (Pivot - Camarilla - Fibo). Very light on the trading platform and moving b
****** Easy to understand, correct Trade direction indicator, quick and easy to visualize******* BING Proper Path Indicator(BPP) will show BUY/SELL signals on-screen in an easy-to-understand 'Traffic Light' format. Provides a final 'reassurance' and 'peace of mind' for taking an educated, high probability, low-risk, trade decision. In the same way, you use a rearview mirror for instantaneous information while taking a driving decision, the same way BING Proper Path Indicator(BPP) will help you
M & W Pattern Pro is an advanced scanner for M and W patters , it uses extra filters to ensure scanned patterns are profitable. The indicator can be used with all symbols and time frames. The indicator is a non repaint indicator with accurate statistics calculations. To use , simply scan the most profitable pair using the statistics dashboard accuracy , then enter trades on signal arrow and exit at the TP and SL levels. STATISTICS : Accuracy 1 : This is the percentage of the times price hits TP
AWキャンドルパターンインジケーターは、強力なキャンドルパターンスキャナーと組み合わせた高度なトレンドインジケーターの組み合わせです。これは、最も信頼性の高い30のローソク足パターンを認識して強調表示するための便利なツールです。さらに、それは色付きのバーに基づく現在の傾向分析器です。     サイズ変更と配置が可能なプラグインマルチタイムフレームトレンドパネル。トレンドフィルタリングに応じてパターンの表示を調整する独自の機能。 利点: キャンドルパターンを簡単に識別 結果を再描画しません 内蔵のマルチタイムトレンドパネル 無効なパターンタイプ(1、2、3キャンドル) パターン表示時のトレンドフィルタリングの調整 MT5 version - >   HERE   / Instructions and description  -> HERE 表示されるパターンのリスト: ハンマーパターン ピンアップ/ピンダウン 弱気なハラミ/強気なハラミ 弱気のハラミクロス/強気のハラミクロス ピボットポイント反転アップ/ピボットポイント反転ダウン ダブルバーローとハイクローズ/ダブルバーローとロークロ
BoxChart MT4
Evgeny Shevtsov
4.4 (5)
The market is unfair if only because 10% of participants manage 90% of funds. An ordinary trader has slim changes to stand against these "vultures". This problem can be solved. You just need to be among these 10%, learn to predict their intentions and move with them. Volume is the only preemptive factor that faultlessly works on any timeframe and symbol. First, the volume appears and is accumulated, and only then the price moves. The price moves from one volume to another. Areas of volume accumu
SMC Venom Model BPR インジケーターは、スマート マネー (SMC) コンセプトで取引するトレーダー向けのプロフェッショナル ツールです。価格チャート上の 2 つの主要なパターンを自動的に識別します。 FVG   (フェアバリューギャップ) は、3 本のローソク足の組み合わせで、最初のローソク足と 3 番目のローソク足の間にギャップがあります。ボリュームサポートのないレベル間のゾーンを形成し、価格修正につながることがよくあります。 BPR   (バランス価格範囲) は、2 つの FVG パターンの組み合わせで、「ブリッジ」を形成します。これは、価格がボリュームアクティビティの少ない動きで動くときに、ブレイクアウトしてレベルに戻るゾーンで、ローソク足の間にギャップを作成します。 これらのパターンは、大規模な市場プレーヤーと一般参加者の相互作用が発生するチャート上のボリュームと価格動向の分析に基づいて、トレーダーが主要なサポート/レジスタンス レベル、ブレイクアウト ゾーン、エントリ ポイントを識別するのに役立ちます。 インジケーターは、長方形と矢印の形でパターンを視
Indicator Description GOLD TITAN KING SIGNAL INDICATOR High-Precision Gold Scalping Buy/Sell Signals – Manual Trading Assistant Overview The Gold Titan King Signal Indicator is a manual trading assistant tool designed for high-frequency scalping on Gold (XAUUSD) and other major pairs. It generates clear BUY/SELL signals with precise entry levels, along with adjustable Stop Loss and Take Profit levels displayed directly on the chart. ️ This tool is NOT an EA. It does not execute trades
ナイト ゴースト - バイナリ オプションの矢印インジケーター。 これからのあなたの頼もしいアシスタントです! 11 - チャートの再描画なし - すべての通貨ペアで大活躍! -インジケータの精度は最大 90% (特に夜間) ・長時間の設定不要(バイナリーオプションに最適な設定) - 信号が遅れない - 現在のローソク足でのシグナルの出現 ・M1期にピッタリ(No More!) ・目に優しいキャンドルカラー(赤・青) -インストールされたアラート それを扱う: - 青い矢印は信号アップを示します -赤い下向き矢印 M1 以上のインジケーターをチャートに配置しないでください. シグナルの精度が低下します! インジケーターのスクリーンショットとビデオを見る
SX Supply Demand Zones accurately identifies and draws high-probability Supply and Demand zones using a sophisticated algorithm. Unlike traditional indicators that clutter your chart, this indicator is designed with a focus on performance and a clean user experience. New Unique Feature: Interactive Legend System What truly sets this indicator apart from everything else is the Interactive Control Legend. You have a professional dashboard directly on your chart that allows you to: Show/Hide: Ins
FREE
Synchronize objects from one chart to multiple charts. Synchronize objects from one chart to multiple charts. 1. Allows automatic synchronization of new and edited objects to other charts. 2. Allows synchronization of all objects on the chart to other charts at the current time. 3. Allows setting the charts to synchronize based on the position of the chart in the MT4 window. Version 1.2: Allow set list of object names that you don't want to sync (Separated by commas ",") Allow set 5 types of o
FREE
This indicator displays in a separate window the difference between the number of points which increased the price, and the number of points that decreased the price during the time interval specified in the settings. The time interval for calculation is expressed as the number of bars of the chart the indicator is attached to. This approach allows you to evaluate the movement direction (growth or fall) of the instrument's price, the strength of the movement and the size of the movement in point
Overview Harmonic Patterns MT4 is a technical analysis indicator designed for the MetaTrader 5 platform. It identifies and displays harmonic price patterns, such as Butterfly, Cypher, Crab, Bat, Shark, and Gartley, in both bullish and bearish directions. The indicator calculates key price levels, including entry, stop loss, and three take-profit levels, to assist traders in analyzing market movements. Visual elements and customizable alerts enhance usability on the chart. Features Detects six ha
KT Renko Patterns MT4
KEENBASE SOFTWARE SOLUTIONS
2.33 (3)
KT Renko Patterns は、レンコチャートの各レンガをスキャンしながら、さまざまな金融市場でトレーダーによく使用されている有名なチャートパターンを検出します。 時間ベースのチャートと比較して、レンコチャートは視認性が高くシンプルなため、パターンベースのトレードがより簡単かつ明確になります。 KT Renko Patterns は複数のレンコパターンを搭載しており、その多くは Prashant Shah 氏の著書『Profitable Trading with Renko Charts』でも詳しく解説されています。 KT Renko Patterns インジケーターに基づいた 100% 自動化された EA は、こちらからご利用いただけます - KT Renko Patterns EA 。 機能一覧 最大8種類の明確なレンコパターンを表示し、あいまいさなく取引をサポートします。 完全な客観性を保つため、すべてのパターンにストップロスとフィボナッチターゲットが設定されています。 KT Renko Patterns は各パターンの精度を継続的に測定し、重要な統計情報をチャート
We present you the indicator "Candle closing counter", which will become your indispensable assistant in the world of trading. That’s why knowing when the candle will close can help: If you like to trade using candle patterns, you will know when the candle will be closed. This indicator will allow you to check if a known pattern has formed and if there is a possibility of trading. The indicator will help you to prepare for market opening and market closure. You can set a timer to create a pre
Most professional traders declare strict compliance with risk management. This simple tool allows quick calculation of trading lot size in accordance with the following basic risk management rules: The maximum allowable risk is set as a fixed percentage of the account deposit (for example, 1-2%). The risk is measured as a distance in points between the order opening level and the stop loss level. It is always difficult for beginners to calculate trade lot based on the risk value, so this indicat
QuantumEdge Trader v1.0 AI-Powered Precision Signals for Serious Traders QuantumEdge Trader is a smart and reliable indicator that delivers accurate BUY and SELL signals using advanced market analysis and trend detection. Designed for M1 to M60 timeframes, it's ideal for scalping and intraday strategies. --- Key Features: No Repaint – Signals never change after appearing Smart trend filters to reduce noise Adjustable sensitivity and alerts Perfect for XAUUSD, EURUSD, and m
Price Magnet — Price Density and Attraction Levels Indicator Price Magnet is a professional analytical tool designed to identify key support and resistance levels based on statistical Price Density. The indicator analyzes a specified historical period and detects price levels where the market spent the most time. These zones act as “magnets,” attracting price action or forming a structural base for potential reversals. Unlike traditional Volume Profile tools, Price Magnet focuses on price-time d
Mean Reversion Supply Demand Indicator Mean Reversion Supply Demand is the indicator to detect the important supply demand zone in your chart. The concept of supply demand trading relies on the quantity mismatching between buying and selling volumes in the financial market. Typically, supply demand zone serves to predict the turning point. The wave pattern, for any supply demand zone to work as an successful trade, looks like the price must touch the base zone, move away and then return to zone
Forex Gump
Andrey Kozak
2.4 (5)
Forex Gump is a fully finished semi-automatic trading system. In the form of arrows, signals are displayed on the screen for opening and closing deals. All you need is to follow the instructions of the indicator. When the indicator shows a blue arrow, you need to open a buy order. When the indicator shows a red arrow, you need to open a sell order. Close orders when the indicator draws a yellow cross. In order to get the most effective result, we recommend using the timeframes H1, H4, D1. There
The indicator provides a superior alternative to price action analysis. It enables the identification of normalized patterns, which are then transformed into a graphical representation to forecast future steps within a time series. In the top-left corner, you'll find information regarding the expected prediction accuracy, determined through a complex MSQE calculation. You have the flexibility to adjust the time window, making it easy to validate the indicator's performance. Additionally, you can
Monster Harmonics Indicator is a harmonic pattern indicator. It recognizes Gartley, Bat, Crab, Butterfly, Cypher, White Swan, Black Swan, Shark and several other patterns. Projected patterns that are not yet completed are recognized, too. Monster even shows the PRZ (Potential Reversal Zone). Users can add their own user defined patterns to Monster. Besides the current pattern, Monster also shows all patterns in the symbols history. Monster will provide alerts for developing patterns. Introduced
インディケータは現在のクオートを作成し、これを過去のものと比較して、これに基づいて価格変動予測を行います。インジケータには、目的の日付にすばやく移動するためのテキスト フィールドがあります。 オプション: シンボル - インジケーターが表示するシンボルの選択; SymbolPeriod - 指標がデータを取る期間の選択; IndicatorColor - インジケータの色; HorisontalShift - 指定されたバー数だけインディケータによって描画されたクオートのシフト; Inverse - true は引用符を逆にします。false - 元のビュー。 ChartVerticalShiftStep - チャートを垂直方向にシフトします (キーボードの上下矢印)。 次は日付を入力できるテキストフィールドの設定で、「Enter」を押すとすぐにジャンプできます。
このプロダクトを購入した人は以下も購入しています
Precautions for subscribing to indicator This indicator only supports the computer version of MT4 Does not support MT5, mobile phones, tablets The indicator only shows the day's entry arrow The previous history arrow will not be displayed (Live broadcast is for demonstration) The indicator is a trading aid Is not a EA automatic trading No copy trading function The indicator only indicates the entry position No exit (target profit)  The entry stop loss point is set at 30-50 PIPS Or the front hi
FFx Engulfing Setup Alerter gives trade suggestions with Entry, Target 1, Target 2 and StopLoss. Below are the different options available: Entry suggestion - pips to be added over the break for the entry 3 different options to calculate the SL - by pips, by ATR multiplier or at the pattern High/Low 3 different options to calculate the 2 TPs - by pips, by ATR multiplier or at Risk/Reward Offset the dashboard - any place on the chart Remove the suggestion once the price reached the SL line Lines
FFx InsideBar Setup Alerter gives trade suggestions with Entry, Target 1, Target 2 and StopLoss. Below are the different options available: Entry suggestion - pips to be added over the break for the entry Minimum candle size - to avoid too close buy/sell entry suggestions 3 different options to calculate the SL - by pips, by ATR multiplier or at the pattern High/Low 3 different options to calculate the 2 TPs - by pips, by ATR multiplier or at Risk/Reward Offset the dashboard - any place on the c
FFx OutsideBar Setup Alerter gives trade suggestions with Entry, Target 1, Target 2 and StopLoss. Below are the different options available: Entry suggestion - pips to be added over the break for the entry. 3 different options to calculate the SL - by pips, by ATR multiplier or at the pattern High/Low. 3 different options to calculate the 2 TPs - by pips, by ATR multiplier or at Risk/Reward. Offset the dashboard - any place on the chart. Remove the suggestion once the price reached the SL line.
FFx PinBar Setup Alerter gives trade suggestions with Entry, Target 1, Target 2 and StopLoss. Below are the different options available: Entry suggestion - pips to be added over the break for the entry Minimum candle size - to avoid too small candles 3 different options to calculate the SL - by pips, by ATR multiplier or at the pattern High/Low 3 different options to calculate the 2 TPs - by pips, by ATR multiplier or at Risk/Reward Offset the dashboard - any place on the chart Remove the sugges
The purpose of this new version of the MT4 standard indicator provided in your platform is to display in a sub-window multiple timeframes of the same indicator with its divergences. See the example shown in the picture below. But the display isn't like a simple MTF indicator. This is the real display of the indicator on its timeframe. Here's the options available in the FFx divergences indicator: Select the timeframes to be displayed (M1 to Monthly) Define the width (number of bars) for each tim
The purpose of this new version of the MT4 standard indicator provided in your platform is to display in a sub-window multiple timeframes of the same indicator with its divergences. See the example shown in the picture below. But the display isn't like a simple MTF indicator. This is the real display of the indicator on its timeframe. Here's the options available in the FFx divergences indicator: Select the timeframes to be displayed (M1 to Monthly). Define the width (number of bars) for each ti
The FFx Dashboard MTF alerter will show you on a single chart all the timeframes (M1 to Monthly) with their own status for the indicator. 2 Alert Options: Single timeframe: each selected timeframe alert separately when a signal occurs Multi timeframes: all selected timeframes must agree for an alert to be triggered Both options have an input to select the timeframes to be used for the alert(s). How to Understand the Status: Green/Red square: histogram above/below 0 line Green square + Red bord
The FFx Dashboard MTF alerter will show you on a single chart all the timeframes (M1 to Monthly) with their own status for the indicator. 2 Alert Options: Single timeframe: each selected timeframe alert separately when a signal occurs Multi timeframes: all selected timeframes must agree for an alert to be triggered Both options have an input to select the timeframes to be used for the alert(s). How to understand the status: Green/Red square: RSI above/below 50 line Green square + Red border: R
The FFx Dashboard MTF alerter will show you on a single chart all the timeframes (M1 to Monthly) with their own status for the indicator. 2 Alert Options: Single timeframe: each selected timeframe alert separately when a signal occurs Multi timeframes: all selected timeframes must agree for an alert to be triggered Both options have an input to select the timeframes to be used for the alert(s). How to understand the status: Green/Red square: Stoch above/below 50 line Green square + Red border:
The FFx Dashboard MTF alerter will show you on a single chart all the timeframes (M1 to Monthly) with their own status for the indicator. 2 Alert Options: Single timeframe: each selected timeframe alert separately when a signal occurs Multi timeframes: all selected timeframes must agree for an alert to be triggered Both options have an input to select the timeframes to be used for the alert(s). How to understand the status: Green/Red square: Price above/below Cloud (Kumo) Green square + Red bo
The FFx Dashboard MTF alerter will show you on a single chart all the timeframes (M1 to Monthly) with their own status for the indicator. 2 Alert Options: Single timeframe: each selected timeframe alert separately when a signal occurs Multi timeframes: all selected timeframes must agree for an alert to be triggered Both options have an input to select the timeframes to be used for the alert(s). How to understand the status: Green/Red square: MA pointing Up/Down Green square + Red border: MA po
The FFx Dashboard MTF alerter will show you on a single chart all the timeframes (M1 to Monthly) with their own status for the indicator. 2 Alert Options: Single timeframe: each selected timeframe alert separately when a signal occurs. Multi timeframes: all selected timeframes must agree for an alert to be triggered. Both options have an input to select the timeframes to be used for the alert(s). How to understand the status: Green square: Price above PSAR Red square: Price below PSAR Options
The FFx Dashboard MTF alerter will show you on a single chart all the timeframes (M1 to Monthly) with their own status for the indicator. 2 Alert Options: Single timeframe: each selected timeframe alert separately when a signal occurs Multi timeframes: all selected timeframes must agree for an alert to be triggered Both options have an input to select the timeframes to be used for the alert(s). How to understand the status: Green/Red square: CCI above/below levels (ie. 100/-100) Grey square: C
The FFx Dashboard MTF alerter will show you on a single chart all the timeframes (M1 to Monthly) with their own status for the indicator. 2 Alert Options: Single timeframe: each selected timeframe alert separately when a signal occurs Multi timeframes: all selected timeframes must agree for an alert to be triggered Both options have an input to select the timeframes to be used for the alert(s). How to understand the status: Green/Red square: ADX above level Grey square: ADX below level Red bor
The FFx Dashboard MTF alerter will show you on a single chart all the timeframes (M1 to Monthly) with their own status. 2 Alert Options: Single timeframe: each selected timeframe alert separately when a signal occurs Multi timeframes: all selected timeframes must agree for an alert to be triggered Both options have an input to select the timeframes to be used for the alert(s). How to understand the status: Green/Red square: bullish/bearish candle Options available in the FFx Dashboard Alerter
The [GRAFF] III manual trading system is based on multiple MetaTrader (MT4) indicators. Together, the entire PACK of GRAFF III indicators makes an advanced trading tool. The system consists of over 20 different custom-built indicators which have been carefully selected and tested in the long term to produce strong and efficient trading signals. The particular indicators are based on different mathematical formulas, so the entire system is calibrated to remove false signals from its own indicator
FFx Universal Strength Meter PRO is more than a basic strength meter. Instead of limiting the calculation to price, it can be based on any of the 19 integrated strength modes + 9 timeframes. With the FFx USM, you are able to define any period for any combination of timeframes. For example, you can set the dashboard for the last 10 candles for M15-H1-H4… Full flexibility! Very easy to interpret... It gives a great idea about which currency is weak and which is strong, so you can find the best pai
MetaTrader 5 version available here : https://www.mql5.com/en/market/product/24882 FFx Basket Scanner is a global tool scanning all pairs and all timeframes over up to five indicators among the 16 available. You will clearly see which currencies to avoid trading and which ones to focus on. Once a currency goes into an extreme zone (e.g. 20/80%), you can trade the whole basket with great confidence. Another way to use it is to look at two currencies (weak vs strong) to find the best single pairs
NostradamusMT4
Andrey Spiridonov
1 (1)
NostradamusMT4 is a powerful indicator from the set of professional trader. The indicator is based on Andrei Spiridonov's original price calculation method (ESTIMATED PRICE) for the current candle price. Advantages The indicator does not redraw. It works on any timeframes. Works with any trading instruments. Perfectly suitable for scalping and trading binary options. Parameters Color - color of the ESTIMATED PRICE FUTURE line. How to work with the indicator The indicator forms the ESTIMATED P
MetaTrader 5 version available here: https://www.mql5.com/en/market/product/25794 FFx Pivot SR Suite PRO is a complete suite for support and resistance levels. Support and Resistance are the most used levels in all kinds of trading. Can be used to find reversal trend, to set targets and stop, etc. The indicator is fully flexible directly from the chart 4 periods to choose for the calculation: 4Hours, Daily, Weekly and Monthly 4 formulas to choose for the calculation: Classic, Camarilla, Fibonac
This is the complete REX package. It consists of the lite, pro and ULTRA version.  Perfect for beginners and intermediates. REX complete is 100% non repaint. The strategy is based on a mix of different strategies, statistics, including pivot points, oscillators and patterns.  As the trading idea consists of a variety of some classic indicators like Momentum, Williams Percent Range, CCI, Force Index, WPR, DeMarker, CCI, RSI and Stochastic, it is clear that the fundamental indicators have being u
The arrows are calculated with: -     2 Parabolic  parameters -     2 ADX parameters -     4 Stochastic parameters We recommend to combine it with Parabolic, ZigZag or Elliot waves indicator. Always trade the trend! If you make sure to draw your trend lines and support/resistance zones you will just have to wait for the signal to appear. Take the trade. For Binary Options it is advisable to set the expiry time to 5-15 min in M1 chart. THIS INDICATOR IS ZERO REPAINT Best assets to trade: - EUR
Let´s try to make some real money! Call me profit addicted. I thought why not try to make THE dream come reality. With discipline, a clear strategy and this indicator I focus on entering the perfect trades. This indicator is very easy to use as you will get perfect entry points for Put or Call trades. The arrows are calculated with: -     Momentum  parameters -     Candle stick patterns -     Fundamental Price action We recommend to combine it with Parabolic, ZigZag or Elliot waves indicator
Golden Chip provides Basic Market Structure, Fibonacci, supply and Demand Zones. Letting you identify when a sell off point is approaching or whne a buy opportunity is arriving. The awesome thing about Golden Chip is that, you will see rejection levels or continuation before ANYBODY ! This indicator moves directly with price and lines up perfectly with the Chart. Some indicators would lag but NOT this one ! Golden Chip is amazing for Clean chart (Naked Chart). GOLDEN CHIP IS ONLY ON METATRADER (
Seconds timeframe generator for MT4  (S1, S5, S10, S15, S20, S30). Features  1. Indicator generates timeframes in real time, with each new tick on the spot. 2. Indicator is also measuring point distance from extreme to extreme when hovered "This additionally shows us how strong movements are". Advantages 1. Easy to spot best entry and exit points. 2. You can easily trade news releases where market is very volatile. 3. You can also easily trade very slow market conditions and spot tre
PROMOÇÃO LIMITADA, NA COMPRA DE 1 INDICADOR VOCÊ LEVA CLUBINARIAS 6.0 , 5.1 e DonForex DE BRINDE!! ATÉ FINAL DO MÊS! -NA HORA DA COMPRA SELECIONAR COMBINAR COM O VENDEDOR OU BUSCAR PESSOALMENTE, A ENTREGA É DIGITAL EM POUCOS SEGUNDOS ==> VEJA O VIDEO PARA TIRAR AS SUAS DUVIDAS <== ==> VÍDEO OPERANDO NO YOUTUBE ROBÔ FEITO COM MUITO ESFORÇO E CARINHO E QUE ESTA TRAZENDO ÓTIMOS LUCROS APESAR DE EXISTIREM PESSOAS QUE APENAS VENDEM ROBÔS FAKES DE OPERAÇÕES , ACREDITO QUE SERIA MUITO BOM DA MI
作者のその他のプロダクト
F-16 Plane Indicatorをご紹介します。これは、取引体験を革新するために設計された最先端のMT4ツールです。F-16戦闘機の無類のスピードと精度に触発され、このインジケーターは高度なアルゴリズムと最新技術を組み合わせ、金融市場で比類のないパフォーマンスを提供します。 F-16 Plane Indicatorを使用すると、リアルタイムの分析と高精度な取引シグナルの生成が可能で、競争相手を圧倒します。ダイナミックな機能により、さまざまな資産クラスで利益を見つけることができ、自信を持って的確な決定を行うことができます。 使いやすいインターフェースを備えたF-16 Plane Indicatorは、人気のあるMetaTrader 4プラットフォームとシームレスに統合され、スムーズで効率的な取引プロセスを実現します。初心者のトレーダーでも経験豊富なプロフェッショナルでも、このインジケーターは独自の取引スタイルと好みに合わせて簡単にカスタマイズすることができます。 F-16 Plane Indicatorのパワーを体感し、市場のトレンドを精密かつ敏捷にナビゲートします。高度なチャー
プロフェッショナルなEAエキスパート、グリーンフロッグEAの短い説明 迅速かつ確実に移動する外国為替取引市場で、頼りになる味方を持つことは重要です。グリーンフロッグEAをご紹介します。これは、類まれなる正確性と効率性でトレーダーをサポートする、最高のプロフェッショナルエキスパートアドバイザー(EA)です。 グリーンフロッグEAは、最先端の技術と外国為替市場での長年の経験が融合したものです。経験豊富なトレーダーやソフトウェアエンジニアのチームによって開発され、一線を画す成果と大幅な利益を生み出しています。 グリーンフロッグEAの特徴は、常に変動する市場環境に適応する能力です。洗練されたアルゴリズムとリアルタイムのデータ分析により、利益をもたらすチャンスを迅速に特定し、驚異的な精度で取引を実行します。EAの賢明なトレーディング戦略により、トレンド、ボラティリティの高い市場、レンジ相場など、様々な市場シナリオに対応し、常に最適なパフォーマンスを発揮します。 グリーンフロッグEAは使いやすいインターフェースを備えており、経験豊富なトレーダーや外国為替市場初心者の両方にアクセス可能です
信頼性の低いバイナリオプションのインジケーターにうんざりしていませんか?偽のシグナルを出して損失や失望を招くこともありますよね?それなら、CLOCK INDICATORを探す必要はありません。これはMT4トレーディングプラットフォームで利用できる最高のバイナリオプションのインジケーターです。 高度なアルゴリズムと強力なテクニカル分析ツールを備えたCLOCK INDICATORは、初心者から経験豊富なトレーダーまで、究極のトレーディングツールです。市場のトレンドを正確に予測し、利益を生むトレードの機会を特定し、利益を最大化し、損失を最小限に抑えるのに役立ちます。 他の複雑で使いにくいバイナリオプションのインジケーターとは異なり、CLOCK INDICATORは簡単にインストールしてカスタマイズできます。設定を個別の取引の好みに合わせることができ、すべての主要な通貨ペアと時間枠でシームレスに動作します。 CLOCK INDICATORの特筆すべき特徴の1つは、再描画されない性質です。シグナルが生成されると、チャート上に表示されるため、正確な情報に基づいて的確な取引決定をすることがで
SCALPER EAのご紹介です。この画期的なエキスパートアドバイザー(EA)は、フォレックス取引界を席巻しています。2023年において、SCALPER EAは最も利益の出るEAとして台頭し、トレーダーが外国為替市場にアプローチする方法を革新しました。 短期の市場変動に乗じることを目的としたSCALPER EAは、高い確率でのトレードチャンスを迅速かつ正確に特定するために、高度なアルゴリズムと最先端のテクノロジーを駆使しています。その驚異的なパフォーマンスは、経験豊富なトレーダーや大きな利益を追い求める初心者にとって頼りになるツールとしての評判を築き上げています。 スマートな自動化により、SCALPER EAは常に他のEAを上回る成績を収め、市場の変動が激しい状況でも驚異的な収益を生み出します。迅速かつ効率的なトレードの実行能力により、利益のチャンスが逃げることなくトレーダーに競争上の優位性を与えます。 SCALPER EAを他のEAと異なる点は、その適応性です。市場のトレンドを常に分析し、戦略を調整し、過去のトレードから学び続けることで、常に変動する市場のダイナミクスに適応し続けるよ
驚異的なFXインジケーター「Miraculous」をご紹介します。完璧な結果を得るための1時間足を含むすべてのタイムフレームで効果的に機能する、最強の強力な特殊MT4フォレックスインジケーターです。 すべてのタイムフレームで優れた結果を提供する最高のFXインジケーターを探し続けるのに疲れましたか?これ以上探す必要はありません!「Miraculous」フォレックスインジケーターをご紹介します。このインジケーターは、トレーディングの経験を変革し、収益を新たなレベルに引き上げるために設計されました。 先進のテクノロジーと長年にわたる緻密な開発に基づいて構築された「Miraculous」フォレックスインジケーターは、FX市場における力と正確さの頂点となります。この素晴らしいツールは、すべてのレベルのトレーダーのニーズを満たすように設計されており、一貫した収益性を追求する上で比類のない優位性を提供します。 「Miraculous」フォレックスインジケーターの他との違いは、その非常に適応性にあります。デイトレーダー、スウィングトレーダーであろうと、長期ポジションを好む方であろうと、このインジケータ
MT4インジケーター「イーグルアイ」でバイナリーオプション取引の可能性を引き出す MetaTrader 4(MT4)用の「イーグルアイインジケーター」を使って、バイナリーオプション取引の世界に革命を起こしましょう。この革新的なツールは、レーザーのような精度と比類のない収益性をもたらし、あなたのトレーディング体験を変える準備ができています。 ポテンシャルの境界が崩れ、利益が最大化される世界に飛び込んでください。イーグルアイインジケーターの比類のない精度と揺るぎない信頼性によって、市場の隠された秘密が明らかにされます。細部への緻密な注意を払って設計されたこの先進的なインジケーターは、先進的なアルゴリズム、入念なテクニカル分析、リアルタイムの市場データを組み合わせ、並外れたトレーディングの優位性を提供します。 イーグルアイインジケーターは市場のポイントを的確に把握し、迅速な意思決定をサポートします。直感的なインターフェースと使いやすいデザインにより、初心者のトレーダーでもバイナリーオプションの複雑な世界をスムーズにナビゲートし、その強力な力を最大限に活用することができます。 過去の推測や感情
SWING X Blackは、MetaTrader 4(MT4)インジケーターの画期的なツールです。バイナリーオプションと外国為替の両方の手動および自動取引に対応するように精巧に作られています。比類のない精度とさまざまな時間枠への適応性が、利益を最大化したいトレーダーにとって強力なツールとなっています。SWING X Blackは15分の時間枠に最適化されており、迅速な意思決定と迅速な取引実行に最適です。また、トレーダーはマーチンゲール戦略を後続の信号に使用することを選択できるため、金融市場のダイナミックな世界に参入する際のリスク管理が強化されます。 主な特長: バイナリーオプションと外国為替の互換性: SWING X Blackは、バイナリーオプションと外国為替取引のギャップを調和的に埋め、トレーダーが両方の市場でその強力な洞察を活用できる多様性を提供します。このクロス互換性により、トレーダーは自分の好みの取引スタイルに関係なく、情報に基づいた意思決定をすることができ、成功の可能性を高めることができます。 正確な信号生成: SWING X Blackの核となる強みは、その非の打ちどこ
バイナリオプション取引の世界では、正確な市場分析と戦略的な意思決定が重要です。利益を生むチャンスを開拓するための優れた取引インジケーターを求める旅は終わりません。秘密のインジケーターが登場します。これはMT4バイナリオプション取引ツールで、そのクラスで最も優れた、最も強力な評判を築いています。 秘密のインジケーターは、熟練したトレーダーとエキスパートプログラマーのチームによる、年単位の入念な研究、開発、テストの結果です。独自のアルゴリズムと高度な数学モデルは、バイナリオプションの高速な世界でトレーダーに無類の優位性を提供するように微調整されています。 秘密のインジケーターを他の取引インジケーターとは異なるものにするのは、驚くべき正確さで利益を生む取引のチャンスを見つける能力です。そのシグナルは、強力なテクニカルインジケーター、価格行動分析、市場センチメント評価の組み合わせから派生しています。この多面的なアプローチにより、秘密のインジケーターは短期の変動と長期のトレンドの両方を捉え、トレーダーに市場の包括的な視点を提供します。 秘密のインジケーターの中でも際立った特徴の1つは、そ
**Binary Smart Systemのご紹介:究極のトレードパートナー** Binary Smart Systemは単なるインジケーターではありません。様々な市場で的確なシグナルを提供し、洗練されたアルゴリズムと豊富なテクニカルインジケーターの集合をベースにした、トレーダーを的確さとタイムリーなシグナルで装備するための厳選されたトレードツールです。 **インジケーターコンポーネント:** 1. **移動平均パーセンテージ(MAP):** このコンポーネントは複数の移動平均の加重平均を計算し、トレンドの特定の強力な基盤を形成します。MAPは市場の状況に動的に適応し、現在のトレンド方向に対する洞察を提供します。 2. **商品チャネル指数(CCI):** 平均価格からの偏差を分析することで、CCIは買われすぎと売られすぎの状態を評価します。Binary Smart SystemのCCI統合は、ポテンシャルな反転ポイントを特定する包括的なアプローチを保証します。 3. **移動平均収束拡散法(MACD):** シンプルなクロスオーバーを超えるMACDコンポーネント。MACD
はじめに バイナリーオプションと外国為替取引の高速な世界では、成功と失敗の違いを生み出すことができる適切なツールと戦略を手にすることが重要です。そのようなツールの1つは、チャートパターン、移動平均、取引量の組み合わせを活用してトレーダーが情報に基づいた意思決定を支援する、画期的な取引手法であるBBBブラックブルーバイナリーオプションインジケーターシステムです。この包括的なガイドでは、BBBシステムの複雑な部分を掘り下げ、その仕組み、使用方法、そしてあなたの取引パフォーマンスを潜在的に向上させる方法を説明します。 BBBインジケーターシステムの説明 BBBブラックブルーバイナリーオプションインジケーターシステムは、バイナリーオプションと外国為替取引の最適なエントリーと出口ポイントを特定するのを支援するために設計された洗練されたテクニカル分析ツールです。その名前は、主要な取引シグナルを表す「黒」と「青」から来ています。 チャートパターン BBBシステムは、取引チャートの特定された部分を分析することから始まります。これは、サポートとレジスタンスレベル、トレンドライン、ろうそく足パターンなどの
「メトロ駅」:成功する自動取引への道 「メトロ駅」は、先端の手法と賢明なアルゴリズムの交差点で動作する、前衛的なMT4自動取引シグナルです。精密な取引の世界に足を踏み入れましょう。「メトロ駅」は、移動平均線(MA)、相対力指数(RSI)、ストキャスティクスオシレーター、モメンタム、および平均方向指数(ADX)の強さを活用して、洗練された取引シグナルを生成します。これは、指導を求める初心者トレーダーと、取引プロセスを効率化しようとする熟練トレーダーの両方に対応するよう設計されています。 「メトロ駅」の機能の中心には、これらの重要なテクニカル指標を組み合わせる独自の戦略があり、これによりデータ駆動の洞察の調和した収束が生まれます。移動平均線は基本的なトレンド分析を提供し、市場のノイズを取り除き、価格の動向の真の方向を明らかにします。市場が買われ過ぎか売られ過ぎかを判断することで、RSIとストキャスティクスオシレーターは、トレーダーが可能性のある反転または継続を予測するのに役立つ追加の確認レベルを提供します。一方、モメンタムは市場の活気を評価し、現在のトレンドの強度を窺うための窓を提供します
タイトル: ノンリペイント XY トレンドインジケーターの紹介: フォレックスとバイナリオプションで成功するための究極のガイド はじめに: ノンリペイント XY トレンドインジケーターは、複雑で常に変化する金融市場において、トレーダーが情報に基づいた意思決定を行うために設計された革新的な取引ツールです。この高度な MetaTrader 4 (MT4) インジケーターは、リペイントという一般的な問題を排除しながら、驚くほどの精度で価格トレンドを予測するそのユニークな能力により、トレーダーの間で大きな人気を集めています。 インジケーターの理解: ノンリペイント XY トレンドインジケーターを際立たせている重要な機能の一つは、その精度へのこだわりです。過去のシグナルをリペイントし、トレーダーに信頼性の低いデータを残してしまう他の多くのインジケーターとは異なり、このインジケーターは一貫性を保っています。トレーダーは、生成されたシグナルが過去の価格変動を正確に反映していることを知って、安心して取引できます。 XY トレンドインジケーターは、高度なアルゴリズムを使用して価格データを分析し、市場のト
バイナリーハッカーインジケーター 金融市場の高速な世界では、1秒も無駄にできません。すべての意思決定が、取引の成否を分けるのです。そこで登場するのが、バイナリーハッカーインジケーターです。これは、トレーダーに貴重な洞察を提供するために、チャート上の1分ごとに分析を提供する画期的なツールです。 バイナリーハッカーは、手動による広範な分析が必要な従来のインジケーターとは異なり、トレーディングストラテジーから推測作業を取り除き、純粋なデータに基づいた計算されたアプローチを提供します。 取引における精度の向上: バイナリーハッカーインジケーターは、一般的なトレーディングツールではありません。チャート上の各分を分析し、トレーダーに貴重な洞察を提供するリアルタイムアナライザーとして機能します。 バイナリーハッカーを使用すると、売買圧力の微妙なバランスを理解しながら、取引の1分ごとに分析する機能を備えています。この機能により、常に市場の勢いに沿った取引を行うことができます。 1分ごとのパワー: 取引の1分ごとに分析し、売り買い圧力の微妙なバランスを理解する能力を想像してみてください。バイナリーハッカ
ゴールデンサン123トレンドダッシュボードアラートMT4インジケーター 刻々と変化する金融市場の世界で、 トレーダーは常に競争力を高めるためのツールを求めています。 この精度と収益性の追求の中で、 ゴールデンサン123トレンドダッシュボードアラートMT4インジケーターは、 チャンスの灯台として輝いています。 MetaTrader 4プラットフォーム用に設計されたこの卓越したインジケーターは、 トレンド追跡機能とアラートメカニズムを備えた戦略的取引のエッセンスをカプセル化しています。 トレンドのパワーを活用する ゴールデンサン123トレンドダッシュボードアラートMT4インジケーターは、 市場のトレンドを特定して活用するための高度なツールです。 トレーダーは、 トレンドが収益性の高い取引の生命線であることを理解しており、 このインジケーターはまさにそれを実現するために細心の注意を払って作られています。 市場をたゆまなくスキャンし、 ブル、 ベア、 レンジングのいずれのトレンドであっても、 出現するトレンドを即座に認識します。 明快なダッシュボード このインジケーターの際立った特徴の1つは、
Elon Musk EAは、MACDレベル、MACDのダイバージェンス、隠れたMACDのダイバージェンス、そしてインテリジェントマーチンゲールに基づく特別な戦略によって動作する、革新的なトレードツールです。 他とは一線を画すトレード体験を始める準備はできていますか? Elon Musk EAを使用すると、MACDレベル、さまざまなMACDのダイバージェンス、隠れたMACDのダイバージェンス、そして類まれなるインテリジェントマーチンゲールシステムの潜在能力を引き出すことができます。これらの優れた要素を活用して、このEAはあなたのトレードを新たなレベルに引き上げ、財務的な成功を達成するお手伝いをします。 Elon Musk EAの優れた点は、その精度と適応性です。先進的なアルゴリズムと徹底的な市場分析に基づいて、MACDレベルを非常に正確に検出し、利益を得るための最適なタイミングをつかむことができます。MACDのダイバージェンスと隠れたダイバージェンスを活用することで、収益性の高いエントリーポイントとイグジットポイントを特定し、競合他社に先んじて行動できます。 しかしそれだけではありません
MT4用T-REX_EAエキスパートアドバイザー T-REX_EA は、MT4向けに設計された強力でインテリジェントなトレーディングロボットで、先進的な戦略の組み合わせを活用して安定した利益を提供します。このエキスパートアドバイザーは、AI技術、ブレイクアウト戦略、ローソク足パターン、ボリュームプロファイル、需給ゾーンを活用して市場トレンドを分析し、トレードのエントリーとエグジットを最適化します。 主な特徴: マルチストラテジーアプローチ : AIに基づく分析と従来のブレイクアウト戦略、ローソク足パターンの認識を組み合わせて、強力なトレード優位性を提供します。 ボリュームプロファイルと需給ゾーン : ボリュームプロファイルデータと需給ゾーンを統合し、高確率のトレードを正確に特定します。 ターボモード : 市場のボラティリティが高い状況で取引頻度と利益の可能性を高めるための特別な機能です。 通貨ペアの互換性 : EAはすべての通貨ペアで取引できますが、主要な通貨ペア(EUR/USD、GBP/USD、USD/JPYなど)で特に高い利益を上げることができます。 柔軟なトレード設定 : $50
AI TRADING SYSTEM for MT4 - あなたの究極のAI駆動利益マシン! AI TRADING SYSTEM で取引の未来を解き放ちましょう。これは最先端の専門アドバイザー(EA)で、強力なAI駆動戦略を使用して、すべての通貨ペアの利益を最大化します。汎用性のために設計されていますが、EUR/USD、GBP/USD、USD/JPYなどの 主要ペア で 優れたパフォーマンス を発揮し、市場の先を行くことができます。 AI TRADING SYSTEM には 2つの異なる取引モード があり、あなたの取引スタイルと利益目標に合わせて適応します。 BACISモード - 安定した信頼性の高い利益を最小限のリスクで実現し、バランスの取れたアプローチを求めるトレーダーに最適です。 TURBOモード - アグレッシブな高報酬戦略で利益を高めたい人にとって理想的で、市場の勢いを捉えるのに最適です。 主要な特徴: カスタマイズ可能な設定 : 利食い(TP)、損切り(SL)、ロットサイズ、マーチンゲールオプションを調整して、リスク許容度と取引の好みに合わせてシステムをカスタマイズします。
Binary Smart Eye は、バイナリーオプションおよびFX市場向けに設計されたプロフェッショナルなMT4インジケーターです。M1からW1までのすべての時間足に対応し、動的なトレンドレベル、適応型インテリジェント移動平均線、最適化された取引時間帯を組み合わせた独自のスマートロジックを使用しています。 従来の固定パラメータのインジケーターとは異なり、Binary Smart Eyeは市場状況に応じて自動的に適応し、ノイズを排除して重要な価格変動のみに集中します。主な特徴: • 市場方向と反転ポイントを示す動的トレンドレベル • ボラティリティに適応するインテリジェント移動平均線 • 市場が活発な時間帯のみで信号を生成 条件が揃うと、リペイントしない明確な売買シグナルをチャート上に表示し、即時アラートを提供します。バイナリー、スキャルピング、デイトレード、スイングトレードに対応。マーチンゲール戦略の併用も可能ですが、厳格なリスク管理が必要です。利益を保証するものではなく、デモテストを推奨します。取引にはリスクが伴います。
MT5インジケーター「トラフィックシグナル」は、RSI、ストキャスティクス、CCI、トレンドの水準を分析する特別な戦略に基づいて、すべての時間枠で最も正確なエントリーシグナルを得るための特別な戦略に基づいて動作します。トラフィックシグナルは、成功した取引の世界への入り口です!精度と専門知識で設計されたこの革新的なインジケーターは、先進的なテクニカルインジケーターであるRSI、ストキャスティクス、CCI、トレンドを全時間枠で活用し、前例のない自信を持って市場をナビゲートするための最も正確なエントリーシグナルを提供します。 トラフィックシグナルを使用することで、収益性の高い取引機会を検出するために精密に調整された重要なテクニカル指標の包括的な分析にアクセスできます。不確実性を払拭し、情報を基にした意思決定の新たな時代を迎えましょう。RSI、ストキャスティクス、CCI、トレンドの潜在能力を引き出すトラフィックシグナルは、これまでにない市場のダイナミクスを鮮明に描写します。 トラフィックシグナルを使って、市場のトレンドとパターンを容易に把握できます。短期的なエネルギーサージまたは長期的な戦略的
ROADMAPをご紹介します:完璧なエントリーエリア、売買ゾーン、ストップロス、TP1、TP2を知るための特別な戦略に基づいたMT5 Forexインジケーター! Forex市場での不確実性や推測にうんざりしていませんか?完璧なエントリーポイント、買いエリアと売りエリアの特定、正確なストップロスとテイクプロフィットの設定に苦労していませんか?そんな方には、ROADMAPがおすすめです。ROADMAPは、トレーディング戦略を一新する革命的なMT5 Forexインジケーターです。 特別な戦略を採用したROADMAPは、Forex市場での成功に欠かせない貴重な情報と正確な計算を提供します。この優れたインジケーターは、Fibonacci(FIBO)レベルを含む先進的な手法の組み合わせを使用して、最適なトレード決定をサポートします。 ROADMAPを使用することで、驚くほど正確なエントリーゾーンを特定することができます。これにより、利益を生む機会を逃さず、早すぎるトレードを行うこともありません。インジケーターのスマートなアルゴリズムは、市場の状況が望ましいトレードパラメーターと一致するタイミングを
Currency Magician Matrixインジケーターとは何ですか? Currency Magician Matrixインジケーターは、通貨の強さを示すグラフィカルなツールです。一般的なインジケーターは通常、通貨の強さを他の通貨との関係で表示しますが、いくつかの計算を行うことで各個別通貨の絶対的な強さを見つけることができます。 したがって、Currency Magician Matrixインジケーター(またはメーター)は、通貨の絶対的な強さを表現し、他の通貨の強さと比較できるツールです。 通貨の絶対的な強さを計算する方法はさまざまありますが、通常、他のインジケーターのすべての値を考慮して抽出しようとします。 つまり、たとえばJPYの強さを計算するためには、アルゴリズムがJPYを含むすべてのペアで同じインジケーターの値を分析します。 この概念は、Currency Magician Matrixに新しい場合は少し混乱するかもしれませんが、心配しないでください。さらに読んでいくことで理解できます。 Currency Magician Matrixは、8つの主要通貨の強さを測定するため
革新的な MT5 インジケーター、DARWIN Assistant   をご紹介します。これは、トレーディングを成功させる世界への究極のゲートウェイです。精度と専門知識に基づいて設計された DARWIN Assistant   は、RSI、ストキャスティクス、CCI、トレンドなどの高度なテクニカル指標をすべての時間枠にわたって活用する特別な戦略に基づいて動作します。この最先端のインジケーターはエントリーのための最も正確なシグナルを提供し、比類のない自信を持って市場をナビゲートできるようにするため、並外れた取引体験に備えてください。 DARWIN Assistant   を使用すると、最も収益性の高い取引機会を検出するために細心の注意を払って調整された、重要な指標の包括的な分析にアクセスできるようになります。不確実性に別れを告げ、情報に基づいた意思決定の新時代を迎えましょう。 RSI、ストキャスティクス、CCI、トレンドを DARWIN Assistant   内でシームレスに統合することでその力を解き放ち、これまでにないほど市場のダイナミクスを鮮明に描きます。 DARWIN As
フィルタ:
レビューなし
レビューに返信