Bar Strength Divergence indicator for MT5
- インディケータ
-
Renaud Herve Francois Candel
 ITC SOFTWARE is a technology company based in the United States since 2010.
🟠🔴 The company develops financial software and indicators for different trading platforms:
-Metatrader 4 and Metatrader 5
-TradingView
-NinjaTrader - バージョン: 1.10
- アップデート済み: 4 7月 2023
- アクティベーション: 5
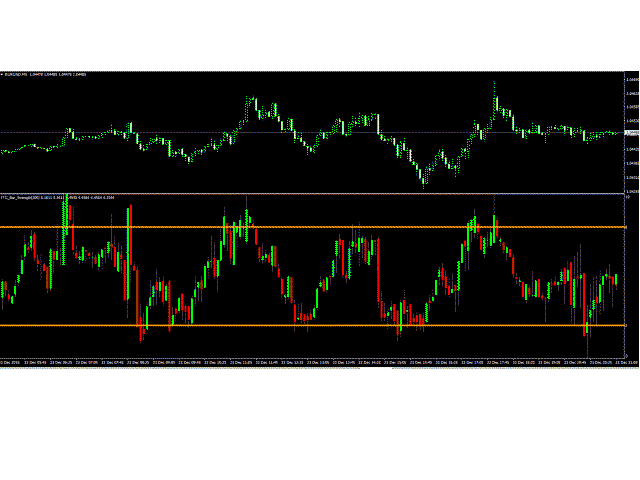
Bar Strength Divergence Indicator
BarStrength Indicator is an exclusive indicator to trade Forex, Stocks, Indices, Futures, Commodities and Cryptos.
BarStrength Indicator shows the strength of each candle.
The indicator shows in a separate windows candles relatively to 2 price levels representing resistance and support in the market.
Once candle is near resistance it is highly probable that price movement will change direction and will go down in the next candles.
Once candle is near support it is highly probable that price movement will change direction and will go up in the next candles.
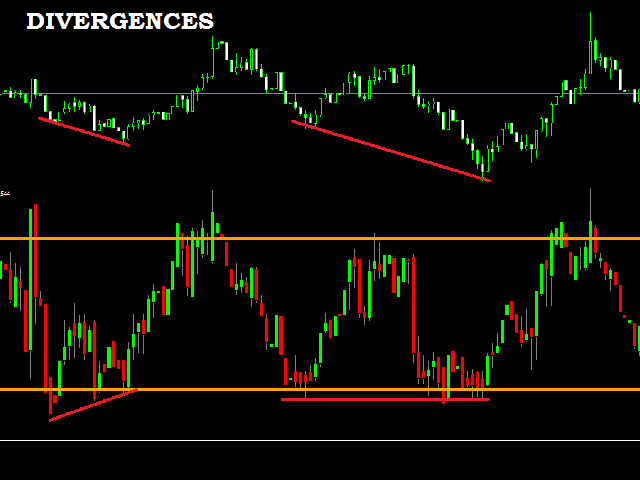
The indicator can also be used to easily spot divergences between real price movement (main chart) and BarStrength indicator movement (indicator window).
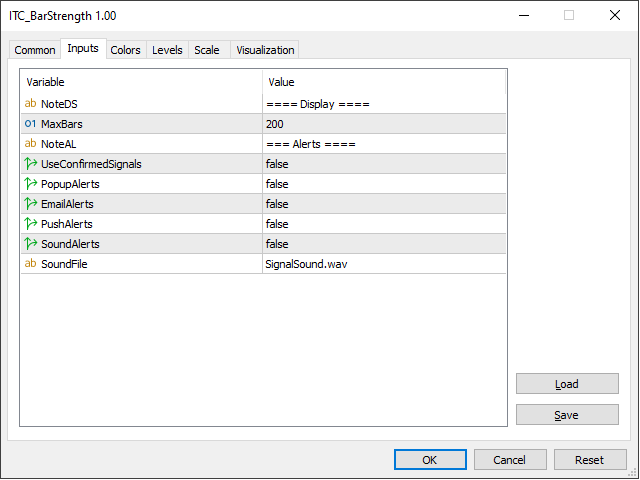
The only input of the indicator is :
- MaxBars: number of candles to be displayed with the indicator
BarStrength indicator can be combined with other oscillators like Stochastic or RSI for confirmation purposes.
The indicator can work with any class of assets: Forex, Stocks, Indices, Futures, Commodities and Cryptos.
The indicator can be used with any time frame.
Other indicators for MT4:
We developed more than 60 indicators and utilities for Metatrader 4 and Metatrader 5.
Indicators for MT5:
All our indicator are developed both for MT4 and MT5.
List of all our indicators:
👉 You can get the complete list of our indicators visiting our profile page.


Buongiorno, ho noleggiato il tuo indicatore per tre mesi, perchè l'ho trovato logico e interessante. Potrei avere un manuale o video per poterne approfondire l'utilizzo? in particolare sull'analisi multi time frame e divergenze? resto in attesa grazie.