Supply and Demand zones
- インディケータ
- バージョン: 1.0
- アクティベーション: 5

需給ゾーン:過去に価格が何度も近づいた観察可能なエリア。
多機能ユーティリティ: 66+ の機能を含むこのインジケーター | 質問があれば私に連絡 | MT5 バージョン
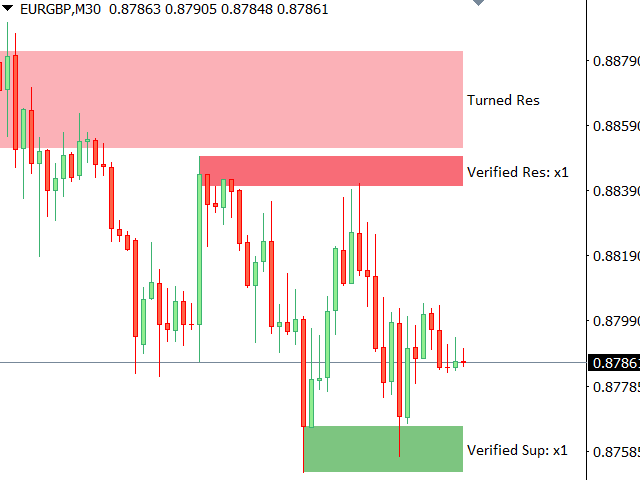
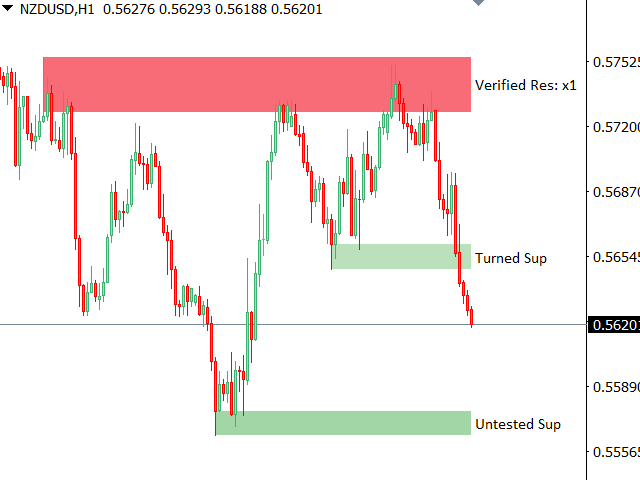
このインジケーターは、価格が再び反転する可能性のある場所を示します。
通常、価格がそのレベルで拒否された回数が多いほど、そのレベルは重要です。
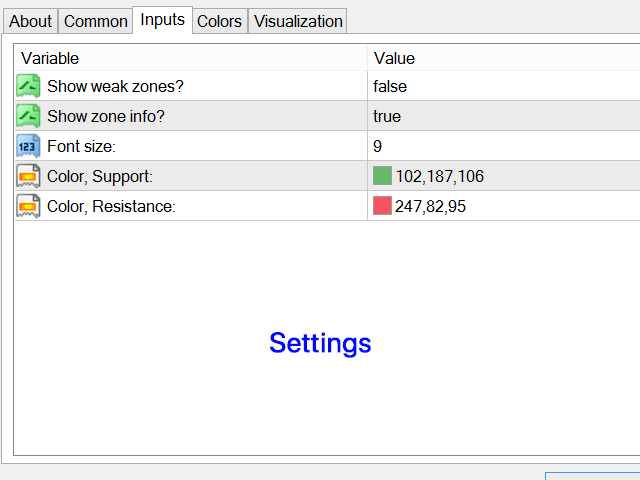
入力設定で 調整できます:
- 弱いゾーンを有効または無効にします;
- ゾーンの説明を表示または非表示にします;
- フォントサイズ;
- 基本色を設定:サポートとレジスタンスに別々に:
選択した色は弱いゾーンでは薄くなり、チャートの視覚的分析に役立ちます;
需給ゾーンは、価格チャート上で過去に大きな買い(需要)または売り(供給)が発生した重要な領域です。これらのゾーンは、価格変動の潜在的な反転または継続を予測するのに役立ちます。需給トレードは、トレンドライン、移動平均線、オーダーフロー分析などの他のツールと組み合わせると最も効果的です。
需給ゾーンの特定方法:
需要ゾーン(買い圧力)
-
形成:下落後の強い上昇動向。
-
マーキング方法:
-
価格の急騰(ベース)。
-
上昇前のベースが需要ゾーン。
-
最も安いろうそく足のヒゲから統合領域までの四角形。
-
供給ゾーン(売り圧力)
-
形成:上昇トレンド後の強い下降動向。
-
マーキング方法:
-
上昇後の急落。
-
下落前のベースが供給ゾーン。
-
最も高いろうそく足のヒゲから統合領域までの四角形。
-
主要ルール:
- ゾーンから強力で速い離脱動向が必要。
- 初期の動向が強いほど、ゾーンは重要。
- 未テストの新鮮なゾーンほど信頼性が高い。
需給ゾーンの取引方法:
A) 反発取引(反転トレード)
-
需要ゾーンでのエントリー:ゾーン近くで買い、ストップロスはゾーン以下に設定。
-
供給ゾーンでのエントリー:ゾーン近くで売り、ストップロスはゾーン以上に設定。
-
利確:前回のスイング高値/安値を目標またはリスクリワード比率(例:1:2または1:3)を使用。
B) ブレイクアウト取引(継続トレード)
-
価格が需要ゾーンをブレイクした場合、供給ゾーンに転換する可能性あり(逆も同様)。
-
需要ゾーン下方の確認済みブレイクでショート、または供給ゾーン上方でロングエントリー。
ゾーンの強化:
-
時間軸のコンフルエンス:より高い時間軸(日足、4時間足)のゾーンは強い。
-
複数回のタッチ:複数回テストされたゾーンは弱くなる。
-
出来高確認:ゾーンでの高出来高は有効性を高める。