RelicusRoad Pro

4.65
RelicusRoad Pro: 定量的市場オペレーティングシステム

【期間限定】無制限アクセス 70% OFF - 2,000人超のトレーダーと共に

なぜ多くのトレーダーは「完璧な」インジケーターを使っても失敗するのでしょうか?

それは、文脈を無視して単一の概念だけでトレードしているからです。文脈のないシグナルは単なるギャンブルです。勝ち続けるには、根拠の重なり(コンフルエンス)が必要です。

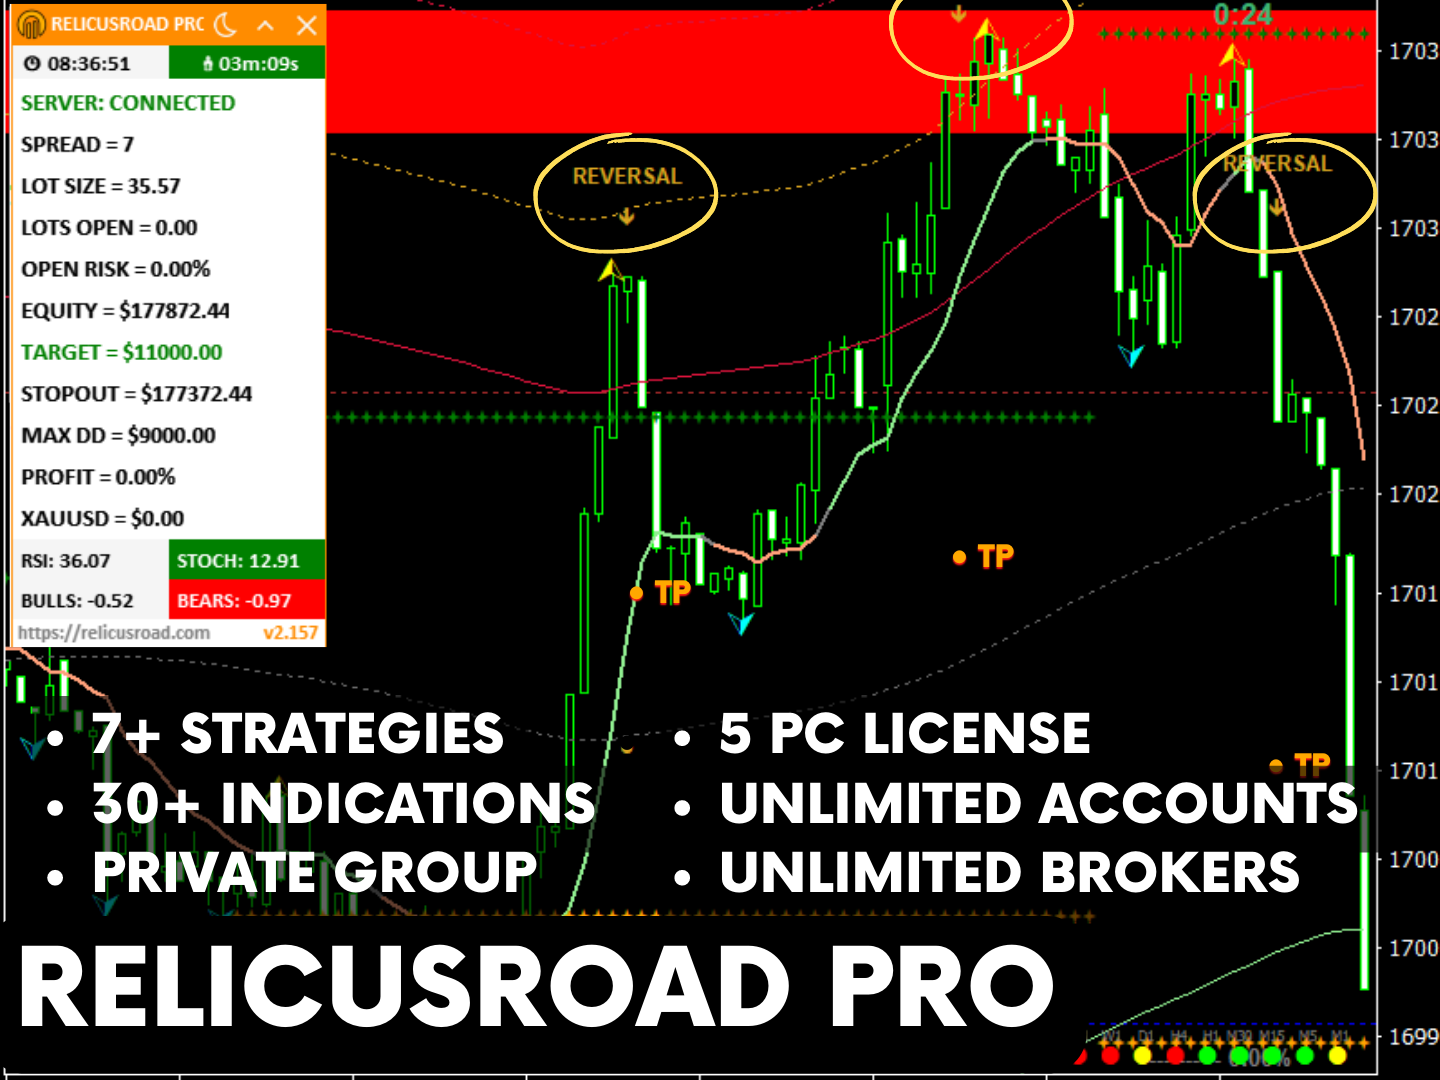
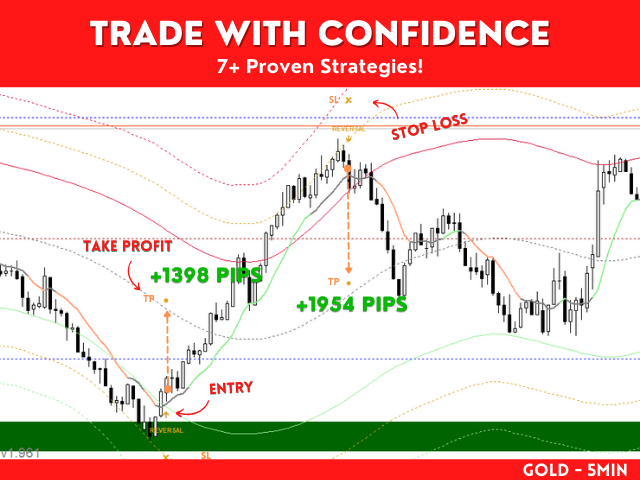
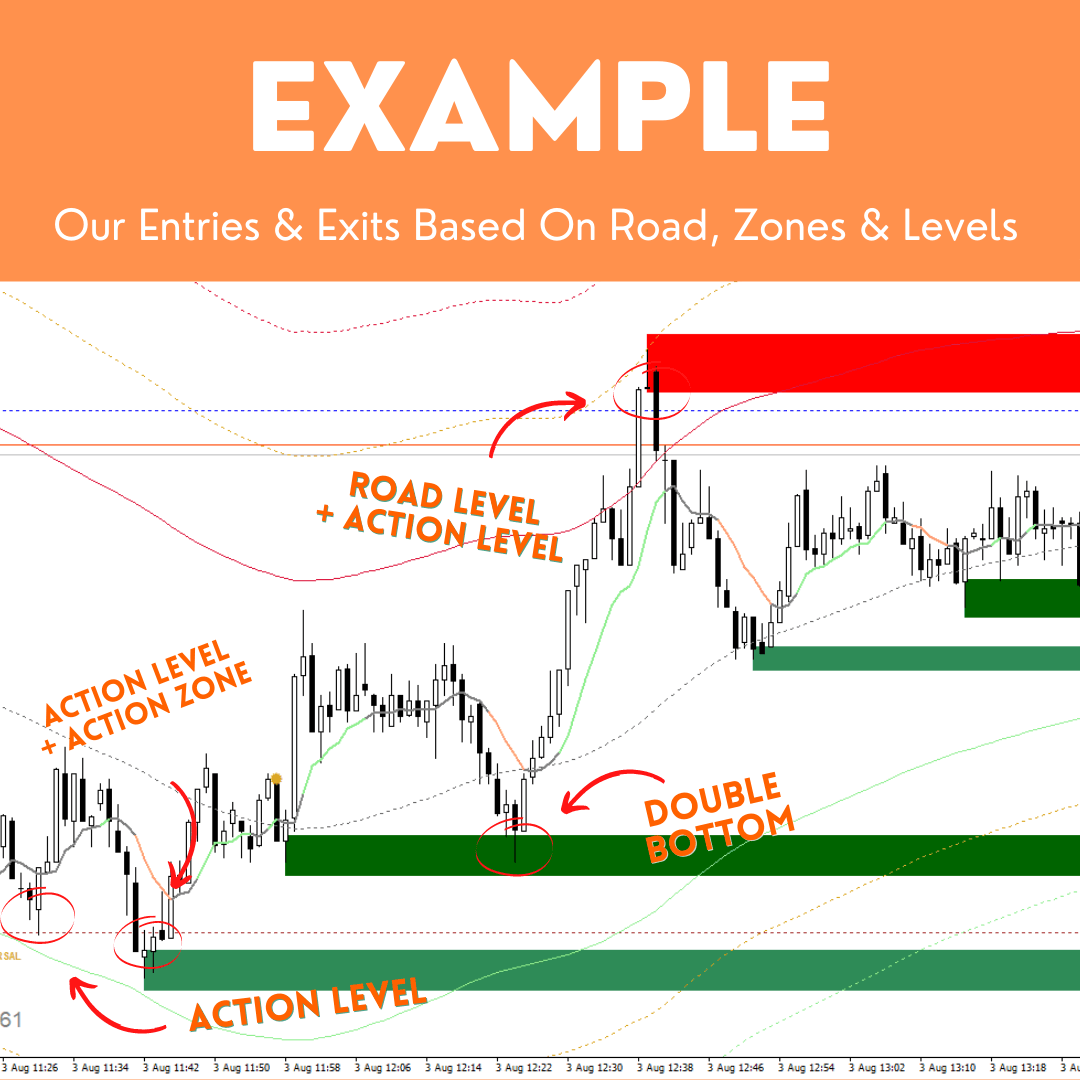
RelicusRoad Proは単なる矢印インジケーターではありません。完全な定量的市場エコシステムです。独自のボラティリティモデリングを用いて、価格が推移する「適正価値の道(Fair Value Road)」をマッピングし、ノイズと真の構造的ブレイクを判別します。

推測はやめましょう。機関投資家レベルの「ロード・ロジック」でトレードを。

コアエンジン:「Road」アルゴリズム

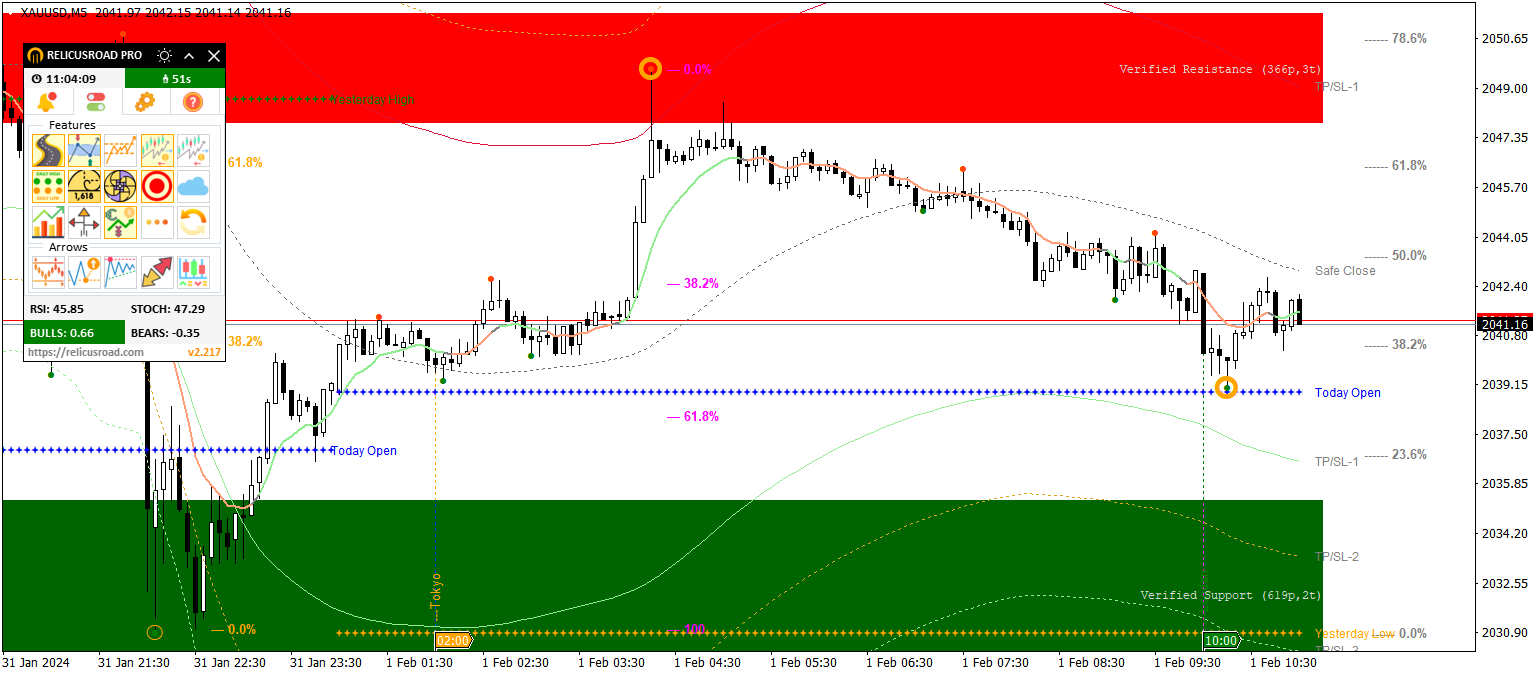
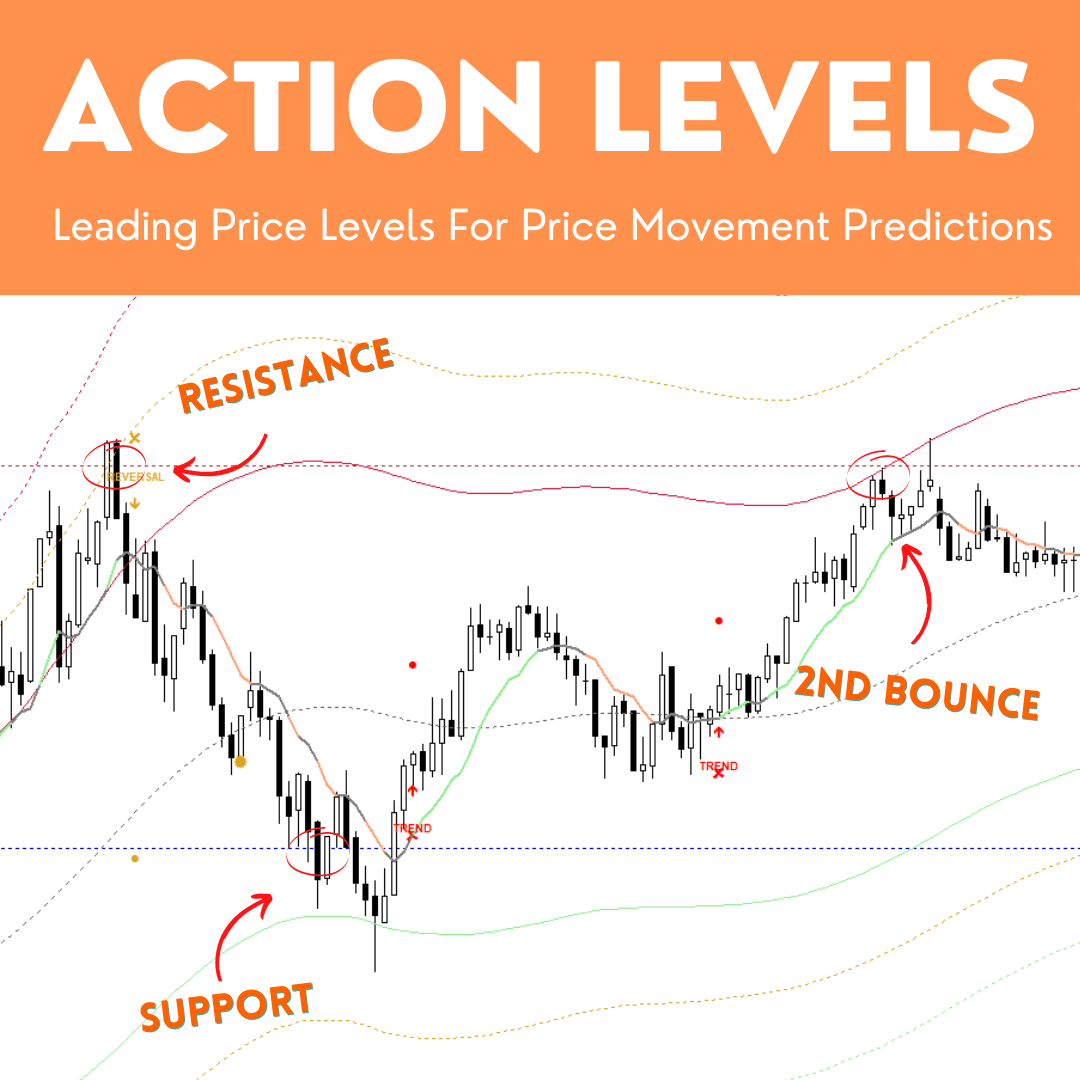
システムの中心となる Road Algo は、市場環境にリアルタイムで適応するダイナミックなボラティリティチャネルです。安全ライン(平衡点)と、価格が数学的に反転しやすい拡張レベルを投影します。

  • Simple Road: 標準的な市場向けの構造マッピング。
  • Smooth Road: 保ち合い相場向けのノイズ低減計算。
  • Breakout Road: ボラティリティの拡大と爆発的な動きを識別。

1. アルゴリズムによる勢いと確認

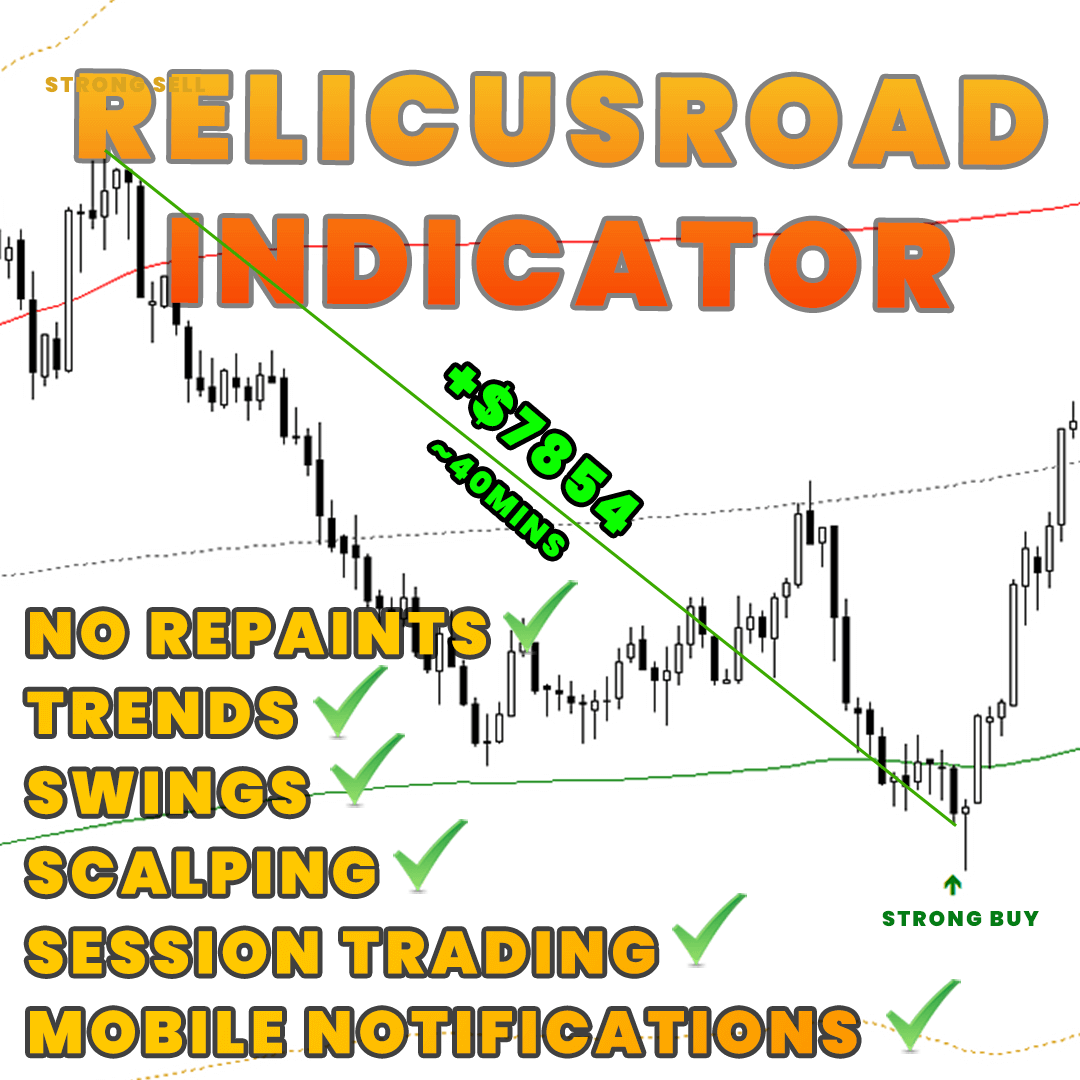
当社の「スキャルピング矢印」は単なるクロスオーバーではありません。高次多項式ロジックを利用してノイズをフィルタリングし、主要サイクルと一致させます。勢い、プライスアクション、ロード構造が収束する正確なエントリーポイントを検出します。

2. 定量的分析スイート

通常はヘッジファンドしか利用できない高度な数学モデルにアクセス。統計的外れ値検出再帰的状態推定分形分析が含まれます。

特典:マニュアル + 7つの実証済み戦略 + ビデオトレーニング + 限定コミュニティ

搭載機能リスト(19-in-1 パワーハウス)

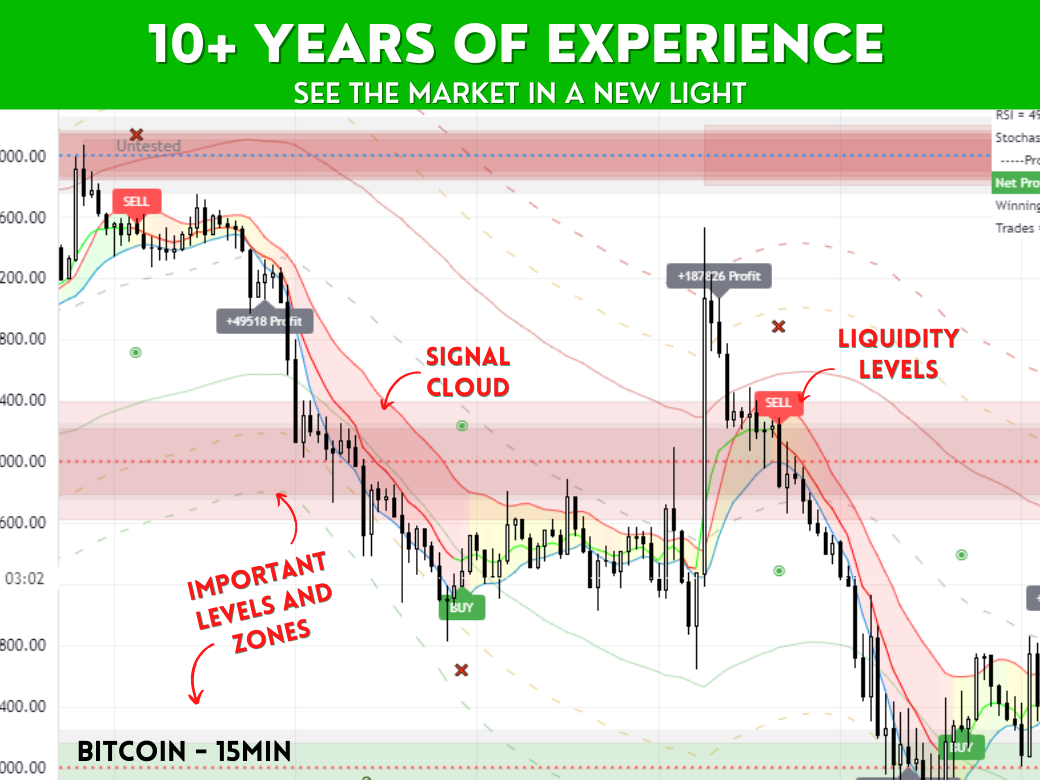
  • 検証済みオーダーフロー: 機関投資家のオーダーブロック、フェアバリューギャップ(FVG)、SMC流動性を自動描画。
  • スマート・サポート&レジスタンス: 「検証済み」「転換済み」「未テスト」と等級付けされる分形ベースのゾーニング。
  • 分析スキャナー: 7モードのマルチ戦略スキャナー(MACD、反転、トレンドなど)。
  • トレンドクラウド: 動的な支え・抵抗として機能する視覚的なデュアルEMAバイアスフィルター。
  • 先行指標: 当日高値/安値の投影と、フィボナッチベースのピボットレベル。
  • パターン認識: 10種類以上のローソク足パターンを自動スキャンし、勝率でフィルタリング。
  • ダイナミック・スイング: 正確な損切り設定のための構造的な高値/安値を特定。
  • セッションマップ: アジア、ロンドン、ニューヨーク市場を可視化。

プロ仕様のリスク管理パネル

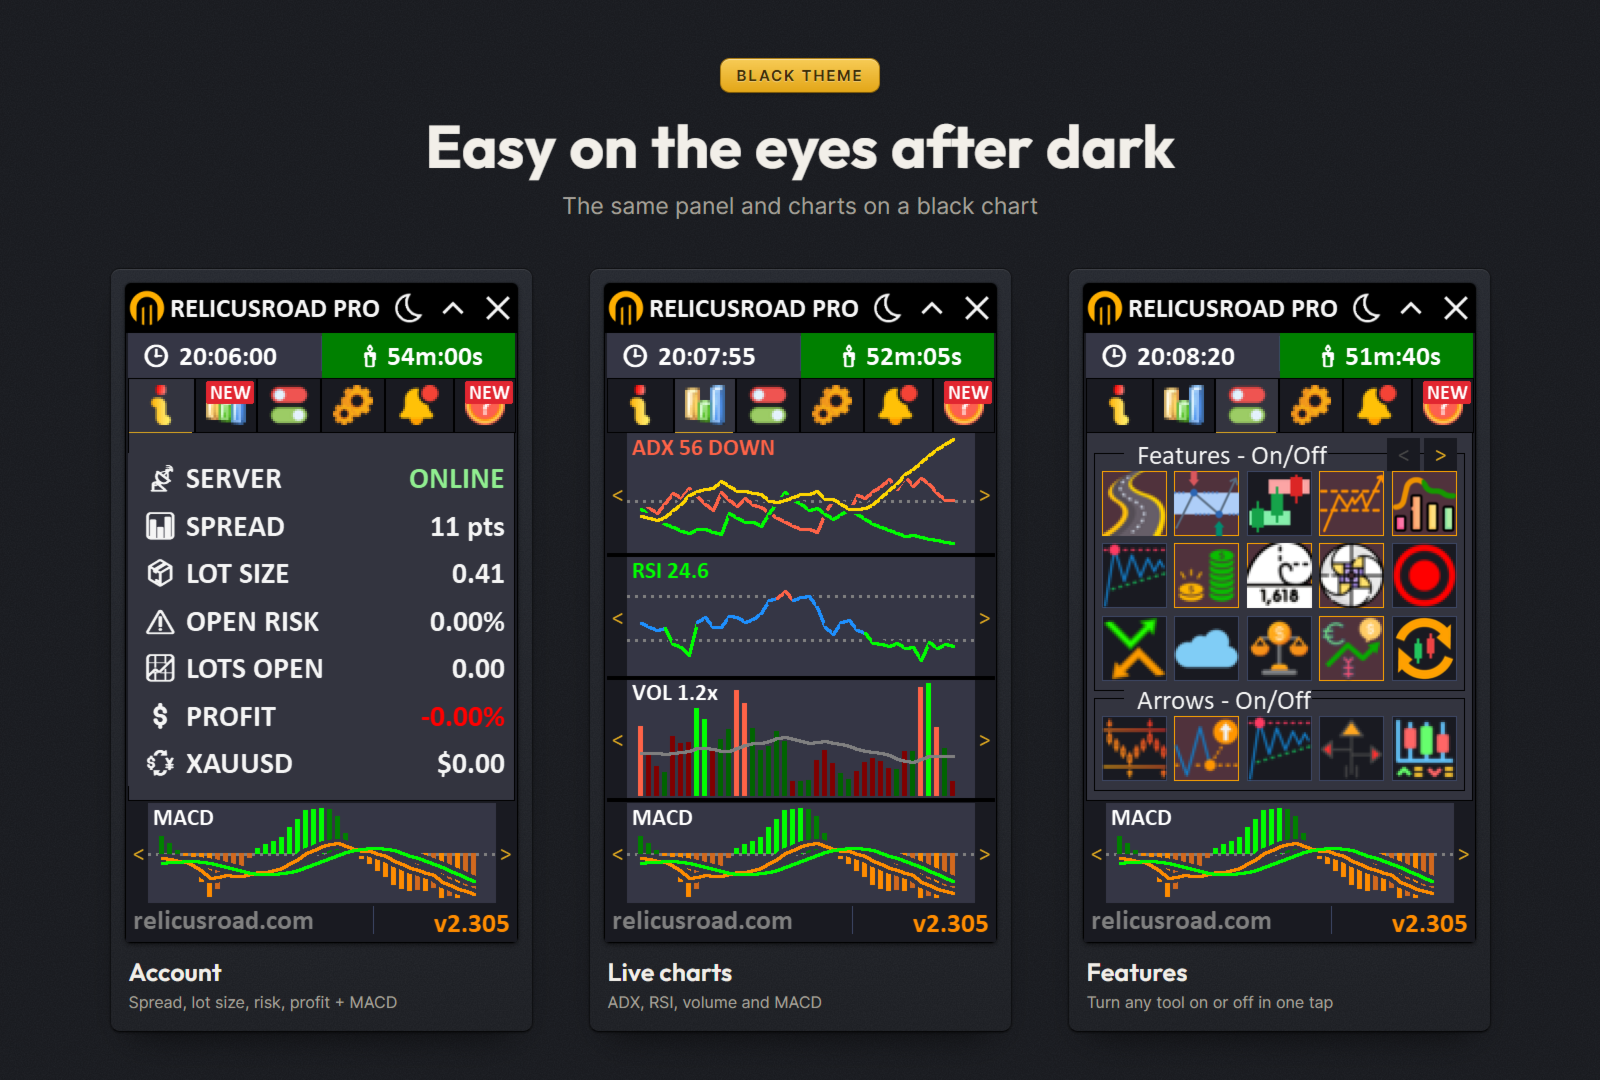
資金を守るためのインフォパネル。スプレッド、ロット数、リスクを一瞬で確認。

「トレード人生で最高の投資。コミュニティだけでも価格以上の価値があります。」認証済みユーザー

ユニバーサル・プラットフォーム

1つのライセンスで、MT4/MT5両方でシームレスに動作します。

「購入」をクリックして、今日から定量的トレードへアップグレードしましょう
レビュー 162
Erwin Fonke
646
Erwin Fonke 2025.09.05 06:45 
 

i am using this indicator in combination with a EA trading assistent. It,s absolute amazing. Almost passed my FTMO challange now. Great work man! Keep it up!

Juan Feliciano
1730
Juan Feliciano 2025.05.07 21:26 
 

great indicator. super clean and accurate entries. just want to know how to join discord pls

Manuel Gonzalez
170
Manuel Gonzalez 2025.02.16 14:46 
 

Good morning everyone. Please to the administrator and owner of the indicator. A few years ago I bought this wonderful indicator and wanted to make it work. There was a gentleman within discord who helped me a lot but due to my inexperience I did not understand the instructions well. Now I have acquired more experience and please would like to recover the accesses to: User Manual + Strategies + Training Videos + Private Group with VIP Access + Mobile Version Available (Separately) Please help me recover these accesses. Thank you very much...

おすすめのプロダクト
Trend PA
Mikhail Nazarenko
5 (3)
The Trend PA indicator uses   Price Action   and its own filtering algorithm to determine the trend. This approach helps to accurately determine entry points and the current trend on any timeframe. The indicator uses its own algorithm for analyzing price changes and Price Action. Which gives you the advantage of recognizing, without delay, a new nascent trend with fewer false positives. Trend filtering conditions can be selected in the settings individually for your trading style. The indicator
期間限定オファー 「限定ローンチ価格」 「バージョン2.0後に値上げ予定」 Currencies Gold Momentum Flow Dashboard — 市場の強さを瞬時に把握 複数時間足(M5〜D1)で、為替とゴールドのモメンタムをリアルタイムで表示する高性能ダッシュボード。 マルチタイムフレームROC分析 トレードシグナル搭載 通貨強弱分析 ヒートマップ表示 アラート+ワンクリック切替 市場が見えるようにトレードする 多くのトレーダーは“見えていない”。 他の人が見逃すものを見抜く これは単なるインジケーターではありません。 精度重視のトレーダー向け 優位性を内蔵 すべてが変わる ️ 多くの人が遅れて気づく真実 インジケーターでは稼げない。 「理解」が利益を生む。 今すぐ優位性を手に入れる ダウンロード Currencies Gold Momentum Flow Dashboard
Binary Options Assistant (BOA) ICE Signals Indicator provides signals based on gkNextLevel Binary Options Strategy.  Indicators: 2 Bollinger Bands & Stochastic Stop missing trades, stop jumping from chart to chart looking for trade set-ups and get all the signals on 1 chart! U se any of the BOA Signals Indicator with the  Binary Options Assistant (BOA) Multi Currency Dashboard .   All BOA Signal Indicator settings are adjustable to give you more strategy combinations. The signals can be seen
FREE
PipFinite Exit EDGE
Karlo Wilson Vendiola
4.83 (115)
Did You Have A Profitable Trade But Suddenly Reversed? In a solid strategy, exiting a trade is equally important as entering. Exit EDGE helps maximize your current trade profit and avoid turning winning trades to losers. Never Miss An Exit Signal Again Monitor all pairs and timeframes in just 1 chart www.mql5.com/en/blogs/post/726558 How To Trade You can close your open trades as soon as you receive a signal Close your Buy orders if you receive an Exit Buy Signal. Close your Sell orders if
フィボナッチリトレースと拡張ラインツール DiNapoliポイント取引方法とゴールデンセクション取引を使用するトレーダーにとって理想的なMT4プラットフォームのフィボナッチリトレースと拡張ラインツール 主な特長: あなたはフィボナッチリトレースメントの複数のセットを直接描くことができ、重要なリターンポイント間の関係は一目瞭然です。 2.フィボナッチ拡張を描画することができます。 3.フィボナッチフォールドバックとラインの延長は、簡単な観察と数値表示のために左右に動かすことができます。 4.チャートは非常に爽やかな 5.数字キーでサイクルを切り替えることができます。 ファンクションキー: 1。 [戻るを押す、要求に応じて描画する、最大8つのグループにする 2。拡張]を描くには[押す] 3。 \を押すと、現在のサイクルの下にあるすべての拡張機能と折り畳みが削除されます 4。フォールドバックを移動して削除して展開する (1)最初のフォールドバックセットのF5行をクリックします。 一度クリックすると(黄色に変わります)、キーボードのDeleteキーを押すと、フォーカ
EARLY REMINDER: The Starting price is 65 price will rise soon up to 365$ and then 750$ after first 10 copies of sales. Grab this offer now! Introduction Hello, traders! Welcome to the demonstration of the Forex Beast Indicator , a comprehensive tool designed to assist aspiring traders in navigating the complexities of the forex market. This indicator incorporates seven essential components to provide a well-rounded trading experience: Moving Averages Colored Zones Support and Resistance Levels
Forex Gump
Andrey Kozak
2.4 (5)
Forex Gump is a fully finished semi-automatic trading system. In the form of arrows, signals are displayed on the screen for opening and closing deals. All you need is to follow the instructions of the indicator. When the indicator shows a blue arrow, you need to open a buy order. When the indicator shows a red arrow, you need to open a sell order. Close orders when the indicator draws a yellow cross. In order to get the most effective result, we recommend using the timeframes H1, H4, D1. There
Price Magnet — Price Density and Attraction Levels Indicator Price Magnet is a professional analytical tool designed to identify key support and resistance levels based on statistical Price Density. The indicator analyzes a specified historical period and detects price levels where the market spent the most time. These zones act as “magnets,” attracting price action or forming a structural base for potential reversals. Unlike traditional Volume Profile tools, Price Magnet focuses on price-time d
The indicator is designed for binary options and short-term transactions on Forex To enter a trade when a signal appears blue up arrow buy red down arrow sell signal For Forex enter on a signal exit on the opposite signal or take profit For binary options Enter on 1 candle, if the deal goes negative, set a catch on the next candle Works on all timeframes If you apply a filter like Rsi, you will get a good reliable strategy.. The algorithm is at the stage of improvement and will be further develo
VR Cub
Vladimir Pastushak
VR Cub は、質の高いエントリーポイントを獲得するためのインジケーターです。このインジケーターは、数学的計算を容易にし、ポジションへのエントリーポイントの検索を簡素化するために開発されました。このインジケーターが作成されたトレーディング戦略は、長年にわたってその有効性が証明されてきました。取引戦略のシンプルさはその大きな利点であり、初心者のトレーダーでもうまく取引することができます。 VR Cub はポジション開始ポイントとテイクプロフィットとストップロスのターゲットレベルを計算し、効率と使いやすさを大幅に向上させます。取引の簡単なルールを理解するには、以下の戦略を使用した取引のスクリーンショットを見てください。 設定、設定ファイル、デモ版、説明書、問題解決方法は、以下から入手できます。 [ブログ] レビューを読んだり書いたりすることができます。 [リンク] のバージョン [MetaTrader 5] エントリーポイントの計算ルール ポジションをオープンする エントリーポイントを計算するには、VR Cub ツールを最後の高値から最後の安値までストレッチする必要があります。 最初
インジケーターは、古典的なガンの角度と同様に、(特定のキャンドルをクリックした後)トレンドラインのファンを構築します。インジケーターの特徴は、固定スケールで角度を作成するだけでなく、特定の数のバーの平均価格を使用することです(オプション)。 インジケーターの角度の平均価格を計算する方法は2つあります(オプション)。 1)高値から安値への(特定の数のバーの)平均価格の動きの計算。 2)平均価格の計算はオープンからクローズに移動します。 オプション: 1.Method -コーナーを構築する方法。 2. FixedScale-固定スケール(メソッドでFixed_Scaleが選択されている場合)。 3.SecondaryAngles-二次角度を描画するための許可を制御します。 4.RayRight-トレンドラインの光線を設定します。 5.DrawBackground-背景として線を描画します。 6.AnglesQuantity-角度の数。 7. Bars_To_Process-期間、バーの数、これに基づいて平均価格が決定され、角度の「速度」。ゼロ以下の場合、すべての履歴
ROYAL DUTCH SKUNK USES THE TREND WAVE INDICATOR AND IT CAN IDENTIFY THE BEGINNING AND THE END OF A NEW WAVE TREND MOVEMENT. AS AN OSCILLATOR, THE INDICATOR IDENTIFIES THE OVERBOUGHT AND OVERSOLD ZONES. IT WORKS GREAT TO CATCH THE SHORT TERM PRICE REVERSALS AND USES A MARTINGALE STRATEGY TO CLOSE ALL TRADES IN PROFIT. USE DEFAULT SETTINGS ON H1 OR HIGHER TIME FRAME ON ANY PAIR FOR MORE ACCURATE TRADES WHY THIS EA : Smart entries calculated by 6 great strategies The EA can be run on even a $20000
Quantum Balance is a modern arrow indicator that identifies key price reversal points in the market with high accuracy. It is based on a combination of WPR (Williams %R) and RSI (Relative Strength Index), which allows you to identify overbought/oversold moments and enter trades at points of maximum potential. The indicator analyzes price dynamics and market conditions, generating signals only when several confirming factors coincide. This reduces the number of false signals and increases tradin
Introducing the "Magic Trades" for MetaTrader 4 – your ultimate tool for precision trading in dynamic markets. This innovative indicator revolutionizes the way you perceive market trends by harnessing the power of advanced analysis to detect subtle changes in character, paving the way for optimal trading opportunities. The Magic Trades Indicator is designed to empower traders with insightful entry points and well-defined risk management levels. Through its sophisticated algorithm, this indicato
This tool was developed and designed for binary options trading It has been noticed that it can also be used in stock markets and forex. There are 2 options for trading binary options using this indicator Option 1 We open a deal on the next candle after a signal for one cut of the current period Buy or Sell depending on the signal The blue up arrow is Buy The red down arrow is Sell / We enter only on the first signal on the next candle and ignore the rest / Option 2 We enter on a signal for the
Embark on the pinnacle of Binary Options evolution. Our indicator isn't just adaptive—it's relentless. Picture a ninja riding a serpent, shadowing its every move; that's how this tool trails the market trend, unwavering till the end. Built upon the foundational prowess of the Ichimoku indicator and honed with an array of fine-tuned oscillators, it epitomizes accuracy and precision. Dive deep without getting lost in the Ichimoku's intricacies—our indicator simplifies the process for you. Perhaps
「ダイナミック・スキャルピング・オシレーター」は、MT4向けの高度なカスタムCrypto_Forexインジケーターです。効率的な取引ツールです! - 新世代のオシレーター - 使い方は画像をご覧ください。 - ダイナミック・スキャルピング・オシレーターは、適応型の売られ過ぎ/買われ過ぎゾーンを備えています。 - オシレーターは、動的な売られ過ぎ/買われ過ぎエリアから正確なエントリーポイントを見つけるための補助ツールです。 - 売られ過ぎ値:グリーンラインより下、買われ過ぎ値:オレンジラインより上。 - このインジケーターは、プライスアクションパターンと組み合わせるのに最適です。 - 標準的なオシレーターよりもはるかに正確です。 - PCとモバイルの両方でアラート機能付き。 高品質のトレーディングロボットとインジケーターをご覧になるにはここをクリックしてください! これは、このMQL5ウェブサイトでのみ提供されるオリジナル製品です。
We present you the indicator "Candle closing counter", which will become your indispensable assistant in the world of trading. That’s why knowing when the candle will close can help: If you like to trade using candle patterns, you will know when the candle will be closed. This indicator will allow you to check if a known pattern has formed and if there is a possibility of trading. The indicator will help you to prepare for market opening and market closure. You can set a timer to create a pre
PipFinite Reversal PRO
Karlo Wilson Vendiola
4.84 (177)
The Controversial 5-Step System That Professional Traders Use To Unlock Trading Success! Reversal Pro effectively combines price action, ideal location and reliable statistics in one smart algorithm. Understanding the market in this unique perspective allows you to recognize reversals professionally. Discover The Secret Of Professional Traders Get instant access www.mql5.com/en/blogs/post/716077 Copy & Paste what professional traders are doing right now! How To Trade Step 1: Trade Setup Sta
This is an arrow indicator without a future function,developed based on the most advanced profit trading algorithms.It has the most innovative and advanced dual trend analysis module, as well as the latest and highly effective market trend prediction algorithm.Trends are your friends, and following larger trends can earn the maximum profit in foreign exchange. This indicator helps traders identify current trends and track them. Someone once made a profit of 10 times in a week by relying on it.No
The Binary Profit Maker,  This indicator works on MT4 and is very easy to use. When you receive a signal from it, you wait for that candle with the signal to close and you enter your trade at the beginning of the next new candle . A Up Purple arrow means Buy and a Down Purple arrow means Sell. All arrows comes with Alert  like for easy identification of trade signal. Are you okay with that? How To Enter Trade? 1 minute candle 1 minute expire
TT Arrows is a trend based indicator that very succesfully predicts the start of the new trend.  The indicator is working with all trading instruments and in M5, M15, H1 and H4 timeframes. Up arrow signals a good time to enter a bullish trade while down arrow signals a good time to enter a bearish trade. The trade should be taken when the candle that has the arrow is closed. Following this strategy you will have have a high percentage of winning trades. Enjoy!
The indicator is designed for trading binary options on small timeframes up to 15 m Easy to use does not need additional settings and can be used without additional filters Recommendations for trading When a signal appears (blue arrows pointing up), you need to consider the buy direction When a signal appears (the red line indicates the bottom), you need to consider the direction to sell To conclude a deal is on the candle where the signal for one candle came, if the signal turned out to be unpr
Binary Options Support Resistance Indicator This indicator is designed for binary options trading and effectively shows retracements from support and resistance levels. Signals appear on the current candle. A red arrow pointing downwards indicates a potential selling opportunity, while a blue arrow pointing upwards suggests buying opportunities. All that needs adjustment is the color of the signal arrows. It is recommended to use it on the M1-M5 timeframes as signals are frequent on these timef
Gold Bricks FX USES THE TREND WAVE INDICATOR AND IT CAN IDENTIFY THE BEGINNING AND THE END OF A NEW WAVE TREND MOVEMENT. AS AN OSCILLATOR, THE INDICATOR IDENTIFIES THE OVERBOUGHT AND OVERSOLD ZONES. IT WORKS GREAT TO CATCH THE SHORT TERM PRICE REVERSALS AND USES A MARTINGALE STRATEGY TO CLOSE ALL TRADES IN PROFIT. USE DEFAULT SETTINGS ON H1 OR HIGHER TIME FRAME ON ANY PAIR FOR MORE ACCURATE TRADES WHY THIS EA : Smart entries calculated by 4 great strategies The EA can be run on even a $300
Quantum Falcon Signal Free is a smart visual trading indicator for MetaTrader 4 designed for Forex and Gold traders. The indicator combines: • Trend analysis • RSI momentum confirmation • MACD momentum filtering • ATR volatility filtering • Higher timeframe confirmation • Smart exit signal detection Main Features: • Smart Buy and Sell signals • Exit Buy / Exit Sell alerts • Real-time dashboard on chart • Professional candle arrows • Multi-timeframe trend confirmation • ATR market volatility filt
FREE
Mast
Sergei Zakhariia
The MT4 trend arrow indicator is a powerful tool for technical analysis that will help traders determine the direction of the trend in financial markets. This indicator is based on the use of several mathematical algorithms and methods of price analysis, which allows you to give accurate and transparent signals to enter the market. The working timeframe is H1.  The description of the indicator includes up and down arrows that indicate the future direction of price movement. In addition, the i
This is a Binary Options signal indicator. Extremely powerful for the 1 min chart. The signals are based on my personal tweak (based on real trial and error & backtested) of the RSI, ADX and Ichimoku and my observation on how price moves. It turns out, 2 candles expiry is the most consistent with this set up. How to use: 1. Wait for arrow signal to show. 2. Place a 2 candle expiry right after the close of the signal candle. So if you are trading a 1 min chart, place an expiry for 2 mins... if yo
Smart Gread Ultimate Edition (SGUL) indicator - based on smart order grid strategy. Maximum customization and flexibility of strategies are the main features of this indicator. In the right corner there is a table with the number and volume of orders. List of adjustable parameters: K: 2.0 - Factor of the next order increase (if the price moves in the other direction). TP: 50 - The number of points at which the order is closed with a profit (minimum profit per 1 lot). Step: 80 - The numb
これは、キャンドルの終値を予測する指標です。 このインジケータは、主にD1チャートでの使用を目的としていますが. この指標は、従来の外国為替取引とバイナリオプション取引の両方に適しています。 インジケーターは、スタンドアロンのトレーディングシステムとして使用することも、既存のトレーディングシステムへの追加として機能させることもできます。 このインジケーターは、現在のキャンドルを分析し、キャンドル自体の内部の特定の強度係数と、前のキャンドルのパラメーターを計算します。 したがって、この指標は、市場の動きのさらなる方向性と現在のキャンドルの終値を予測します。 この方法のおかげで、この指標は、短期の日中取引だけでなく、中期および長期の取引にも適しています。 インジケーターを使用すると、市場の状況の分析中にインジケーターが生成する潜在的な信号の数を設定できます。 インジケーターの設定には、このための特別なパラメーターがあります。 また、インジケーターは、チャート上のメッセージの形式で、電子メールで、およびPUSH通知の形式で、新しい信号について通知することができます。 購入後は必ず私に書いて
このプロダクトを購入した人は以下も購入しています
OrderFlow Absorption – MT4用プロフェッショナル・デルタ&アブソープションシグナルインジケーター OrderFlow Absorptionで本物のオーダーフロー分析の力を解き放ちましょう。MetaTrader 4向けの究極のデルタヒストグラム&アブソープションシグナルインジケーターです。あらゆる価格変動の裏側で何が起きているのかを知りたいトレーダーのために設計されており、市場を動かす隠れた買い/売り圧力や吸収イベントを明らかにします。 特徴 デルタヒストグラムの可視化:   買い圧力・売り圧力を色分けされたヒストグラムで即座に表示。 アブソープションシグナル検出:   高度なロジックで強気・弱気の吸収イベントを特定し、反転の兆しを早期に通知。 チャートマーカー:   吸収シグナルをチャート上に直接マークし、視覚的に分かりやすく表示。 ポップアップアラート:   新しい吸収シグナルが出現した際にリアルタイムで通知。 カスタマイズ可能な閾値:   弱いシグナルを除外し、高確率のセットアップに集中。 リソース管理:   大きなチャートでも高速に動作する効率的な計算。
Super Signal – Skyblade Edition プロ仕様のノンリペイント / ノーラグ・トレンドシグナルシステム。卓越した勝率を実現 | MT4 / MT5 対応 1分足、5分足、15分足などの低い時間足で最も効果を発揮します。 主な特徴: Super Signal – Skyblade Edition は、トレンド取引に特化したスマートなシグナルシステムです。マルチレイヤーのフィルターロジックを用いて、明確な方向性と実際のモメンタムに支えられた強力なトレンドのみを検出します。 このシステムは 天井や底を予測するものではありません 。次の3つの条件がすべて満たされた場合にのみシグナルを発生させます: 明確なトレンド方向 モメンタムの増加 健全なボラティリティ構造 市場セッションに基づく流動性分析と組み合わせることで、シグナルの精度とタイミングがさらに向上します。 シグナルの特性: すべての矢印シグナルは 100% 非リペイント / 遅延なし 一度出現したシグナルは固定され、点滅・消失しません チャート上の矢印、情報パネル、ポップアップ通知、音声アラート、プッシュ通知
Miraculous Indicator – ガン・スクエア・オブ・ナインに基づく100%非リペイントのFXおよびバイナリーツール この動画では、FXおよびバイナリーオプションのトレーダー向けに特別に開発された、非常に正確で強力な取引ツールである Miraculous Indicator を紹介しています。このインジケーターがユニークなのは、伝説的な ガン・スクエア・オブ・ナイン と ガンの振動の法則 に基づいている点で、現代の取引で利用できる最も正確な予測ツールの一つとなっています。 Miraculous Indicatorは 完全に非リペイント であり、ローソク足が確定した後にシグナルが変化したり消えたりすることはありません。つまり、見たものがそのまま利用できます。これにより、トレーダーは自信を持ってエントリーおよびエグジットを行うための信頼性と一貫性のある根拠を得ることができます。 主な特徴: ガン・スクエア・オブ・ナインとガン理論に基づいて構築 100%非リペイントのシグナルシステム すべての時間枠(M1、M5、H1、H4、日足、週足)で機能 FXおよびバイナリーオプション取引
Gold Channel is a volatility-based indicator, developed with a specific timing algorithm for the XAUUSD pair, which consists of finding possible corrections in the market. This indicator shows two outer lines, an inner line (retracement line) and an arrow sign, where the theory of the channel is to help identify overbought and oversold conditions in the market. The market price will generally fall between the boundaries of the channel. If prices touch or move outside the channel it is a tradi
CVD ダイバージェンス検出 - 高度なボリュームデルタ分析   我々が解決する問題 ほとんどのトレーダーは価格アクションのみに依存し、真の市場センチメントを明らかにする重要なボリュームフロー情報を見逃しています。従来の指標は価格の動きに遅れをとり、エントリーが遅れ、リスク管理が不十分になります。CVD ダイバージェンス検出は、価格とボリュームデルタモメンタムの関係を分析することでこれを解決し、大きな市場の動きの前に早期警告信号を提供します。   CVD ダイバージェンス分析の利点   早期市場反転検出   - 価格チャートに現れる前にモメンタムシフトを発見   スマートマネー追跡   - 機関投資家がいつ蓄積または配布しているかを確認   偽シグナル削減   - ボリュームが価格の動きを確認し、より高い確率のセットアップを提供   マルチタイムフレームの優位性   - スキャルピングからスイングトレーディングまで全ての時間枠で機能   汎用的な応用   - FX、株式、商品、暗号通貨に対応   4つの市場フェーズ - 実際のトレーディングストーリ
Binary Booster
Yaroslav Varankin
5 (1)
Binary Options Trading Indicator: A Reliable Tool for Your Trades This indicator is specifically designed for binary options trading and has proven its high quality, reliability, and adequate accuracy, depending on the dynamics of the chart. Key Points: Signal Interpretation: When a blue cross signal appears, it indicates a potential entry into a trade, though it is considered a weak signal on its own. However, if the blue cross is accompanied by an arrow, it is considered a more reliable buy s
Enigmera
Ivan Stefanov
5 (9)
ENIGMERA: 市場の中心 重要:MQL5.comのデモはStrategy Testerで実行されており、Enigmeraの機能を完全には反映していない場合があります。詳細については、説明、スクリーンショット、ビデオをご確認ください。質問があれば、遠慮なくメッセージを送ってください! インジケーターのコードは完全に書き直されました。バージョン3.0は新機能を追加し、インジケーターの開始以来蓄積されたバグを修正しました。 紹介 このインジケーターとトレーディングシステムは、金融市場への注目すべきアプローチです。ENIGMERAはフラクタルサイクルを使用して、サポートとレジスタンスのレベルを正確に計算します。真の蓄積フェーズを示し、方向と目標を提供します。トレンドでも修正でも機能するシステムです。 動作方法 インジケーターのほとんどの機能は、チャートの左側にあるボタンで制御され、市場の状況に迅速に対応できるようになっています。 ボタン ON/OFF – インジケーター全体を表示または非表示にします。 Channel – サポートチャネルを有効にし、許容範囲の偏差を示します。 Dev
TrendMaestro
Stefano Frisetti
4 (4)
Attention: beware of SCAMS, TRENDMAESTRO is only ditributed throught MQL5.com market place. note: this indicator is for METATRADER4, if you want the version for METATRADER5 this is the link:  https://www.mql5.com/it/market/product/108106 TRENDMAESTRO ver 2.5 TRENDMAESTRO recognizes a new TREND from the start, he never makes mistakes. The certainty of identifying a new TREND is priceless. DESCRIPTION TRENDMAESTRO identifies a new TREND in the bud, this indicator examines the volatility, volumes a
There is always a need to measure if the market is "quiet" or it is volatile. One of the possible way is to use standard deviations, but the issue is simple : We do not have some levels that could help us find out if the market is in a state of lower or higher volatility. This indicator is attempting to do that : •           values above level 0 are indicating state of higher volatility (=GREEN buffer) •           values below level 0 are indicating state of lower volatility (=RED buffer)
Trend Breakout Arrows Indicator The Trend Breakout Arrows Indicator is a momentum-based signal tool designed to identify potential bullish and bearish breakout opportunities. It displays clear arrow signals directly on the price chart, helping traders quickly recognize possible trend changes and continuation setups. Up Arrow (Buy Signal) A magenta up arrow appears below a candle when bullish momentum begins to strengthen. This signal indicates that buying pressure may be overtaking selling press
「 Dynamic Scalper System 」インジケーターは、トレンド波の中でスキャルピング取引を行う手法のために設計されています。 主要通貨ペアと金でテスト済みで、他の取引商品との互換性があります。 トレンドに沿った短期的なポジションオープンのシグナルを提供し、追加の価格変動サポートも提供します。 インジケーターの原理 大きな矢印はトレンドの方向を決定します。 トレンド波の中では、小さな矢印の形でスキャルピングシグナルを生成するアルゴリズムが機能します。 赤い矢印は強気方向、青い矢印は弱気方向です。 トレンドの方向には敏感な価格変動ラインが描かれ、小さな矢印のシグナルと連動します。 シグナルは次のように機能します。適切なタイミングでラインが現れるとエントリーシグナルが形成され、ラインが開いている間はポジションが保持され、完了すると取引が終了します。 推奨される動作時間枠はM1~H4です。 矢印は現在のローソク足に形成され、次のローソク足が開いている場合は、前のローソク足の矢印は再描画されません。 入力パラメータ Trend Wave Period - トレンド方向
Meravith
Ivan Stefanov
5 (3)
マーケットメーカーのためのツール。 Meravith は次の機能を提供します: すべての時間足を分析し、現在有効なトレンドを表示します。 強気と弱気の出来高が等しくなる流動性ゾーン(出来高均衡)を強調表示します。 異なる時間足のすべての流動性レベルをチャート上に直接表示します。 テキスト形式の市場分析を生成し、参考情報として表示します。 現在のトレンドに基づいて目標値、サポートレベル、ストップロスを計算します。 取引のリスクリワード比を算出します。 口座残高に基づいてポジションサイズを計算し、潜在的な利益を推定します。 また、市場に大きな変化があった場合には警告を表示します。 インジケーターの主要ライン: 強気/弱気の出来高エグゾーストライン ― 目標値として機能します。 市場のトレンドを示すライン。市場が強気か弱気かによって色が変わり、トレンドのサポートとして機能します。主にその色が市場センチメントを示します。 出来高均衡ライン(Eq)。Eq(Volume Equilibrium)ラインはシステムの中核です。これは買い手と売り手の出来高のバランスポイントを表します。市場の流動性を示し
Linear Trend Predictor ー - エントリ ポイントと方向サポート ラインを組み合わせたトレンド インジケーター。高値/安値チャネルを突破するという原理に基づいて機能します。 インジケーターのアルゴリズムは市場のノイズをフィルタリングし、ボラティリティと市場の動向を考慮します。 インジケーターの機能  平滑化手法を使用して、市場のトレンドと、買い注文または売り注文を開くためのエントリー ポイントを表示します。  任意の時間枠のチャートを分析して、短期および長期の市場の動きを判断するのに適しています。  あらゆる市場や時間枠に適応可能な入力パラメータにより、トレーダーはインジケーターを独自にカスタマイズできます。  設定されたインジケーター信号は消えず、再描画もされません。ローソク足の終値で決定されます。  いくつかの種類の通知が矢印と組み合わされています。  このインジケーターは、独立した取引システムとして使用することも、他の取引システムへの追加として使用することもできます。  あらゆるレベルの経験を持つトレーダーが使用できます。 主なパラメータ Vol
Algo Trading Indicaor  With this indicator , you’ll have zones and trends that hight probability the price will reverse from it. so will gives you all the help that you need  MT5 Version                    https://www.mql5.com/en/market/product/170028 MT4 Version                    https://www.mql5.com/en/market/product/88034 Why should you join us !?  1-This indicator is logical since it’s working in previous days movement , to predict the future movements. 2-Algo trading indicator will hel
TRADING STRATEGY GUIDE DELIVERY The full Trading Strategy Guide will be sent directly to you after purchase. Just message me on MQL5 and ask for it — you'll receive it instantly, along with priority support and setup help. Powered Market Scanner for Smart Trading Decisions keypad support resistance logic 1  is a next-generation MT4 trading system built for serious traders who demand precision, reliability, and clarity. It combines advanced smart filters with real-time price structure logic to
MagicTrigger — マルチタイムフレーム HD/RD ダイバージェンス確認インジケーター MagicTrigger は、上位足(HD)における構造的ダイバージェンスを検出し、同一の価格ゾーン内で下位足(RD)に現れる一致したダイバージェンスによる確認を待つ、マルチタイムフレームのダイバージェンス検出エンジンです。上位足のスイング構造と下位足の確認が一致した場合にのみ、インジケーターはシグナルをマークし、推奨エントリートリガー、ストップロス、2つのターゲットレベルを同時に表示します。 動作の仕組み インジケーターは、チャートの現在の期間の上下にある一連のタイムフレームをスキャンします。上位足では、価格のスイングとスムージングされたオシレーターラインとの間のダイバージェンスパターン(「HD」ダイバージェンス)を探します。次に、HD構造によって定義された時間・価格ゾーン内で、下位足にも同じ方向のダイバージェンス(「RD」ダイバージェンス)が現れているかを確認します。シグナルは、必要な最小数の下位足が上位足の構造を確認した場合にのみ生成され、単一タイムフレームの孤立したダイバージェン
ゴールドラッシュ・トレンド・アロー・シグナル ゴールドラッシュ・トレンド・アロー・シグナル 指標は、XAU/USDにおける高速・短期スキャルパー向けに最適化された、正確でリアルタイムのトレンド分析を提供します。 1分足専用に設計されたこのツールは、明確なエントリーポイントを示す方向矢印を表示し、スキャルパーが変動の激しい市場状況でも自信を持って取引できるよう支援します。 この指標は、PRIMARY(主要)とSECONDARY(補助)のアラート矢印で構成されています。PRIMARYシグナルは、トレンドの方向転換を示す白と黒の方向矢印であり、SECONDARYシグナルは、PRIMARY矢印が示す方向を確認し、潜在的なエントリーポイントを示す青と赤の矢印です。 注意:トレンド方向の変化後にPRIMARYアラート矢印が1つだけ表示される場合、複数のSECONDARY青/赤矢印が表示される点に注意が必要です。SECONDARYシグナルは、シグナル基準を満たす任意のローソク足後に表示されます。したがって、長期的なトレンド移動の場合、画面に多くのSECONDARY矢印が表示されます(添付の
First time on MetaTrader, introducing IQ Star Lines - an original Vedic Astrology based indicator. "Millionaires don't use astrology, billionaires do" . - J.P. Morgan, Legendary American financier and banker. We don't offer free or bonus indicators in exchange of reviews from you. You won't need any free products with this indicator to make it work. ;) Enjoy! Welcome to  the new and updated  IQ Star Lines , the ultimate fusion of ancient planetary harmonic cycles and modern quantitative trading.
A scalping indicator based on mathematical patterns, which on average gives signals with relatively small SL, and also occasionally helps to catch big moves in the markets (more information in the video) This indicator has three main types of notifications: The first type warns of a possible/upcoming signal on the next bar The second type indicates the presence of a ready signal to enter the market/open a position The third type is for SL and TP levels - you will be notified every time price re
How to use Pair Trading Station Pair Trading Station is recommended for H1 time frame and you can use it for any currency pairs. To generate buy and sell signal, follow few steps below to apply Pair Trading Station to your MetaTrader terminal. When you load Pair Trading Station on your chart, Pair Trading station will assess available historical data in your MetaTrader platforms for each currency pair. On your chart, the amount of historical data available will be displayed for each currency pai
FFx Engulfing Setup Alerter gives trade suggestions with Entry, Target 1, Target 2 and StopLoss. Below are the different options available: Entry suggestion - pips to be added over the break for the entry 3 different options to calculate the SL - by pips, by ATR multiplier or at the pattern High/Low 3 different options to calculate the 2 TPs - by pips, by ATR multiplier or at Risk/Reward Offset the dashboard - any place on the chart Remove the suggestion once the price reached the SL line Lines
FFx InsideBar Setup Alerter gives trade suggestions with Entry, Target 1, Target 2 and StopLoss. Below are the different options available: Entry suggestion - pips to be added over the break for the entry Minimum candle size - to avoid too close buy/sell entry suggestions 3 different options to calculate the SL - by pips, by ATR multiplier or at the pattern High/Low 3 different options to calculate the 2 TPs - by pips, by ATR multiplier or at Risk/Reward Offset the dashboard - any place on the c
FFx OutsideBar Setup Alerter gives trade suggestions with Entry, Target 1, Target 2 and StopLoss. Below are the different options available: Entry suggestion - pips to be added over the break for the entry. 3 different options to calculate the SL - by pips, by ATR multiplier or at the pattern High/Low. 3 different options to calculate the 2 TPs - by pips, by ATR multiplier or at Risk/Reward. Offset the dashboard - any place on the chart. Remove the suggestion once the price reached the SL line.
FFx PinBar Setup Alerter gives trade suggestions with Entry, Target 1, Target 2 and StopLoss. Below are the different options available: Entry suggestion - pips to be added over the break for the entry Minimum candle size - to avoid too small candles 3 different options to calculate the SL - by pips, by ATR multiplier or at the pattern High/Low 3 different options to calculate the 2 TPs - by pips, by ATR multiplier or at Risk/Reward Offset the dashboard - any place on the chart Remove the sugges
Automatic, live & interactive picture of all trendlines. Assign push, email and sound alerts to the lines of your choice and be informed about price rollback, breakout, rollback after breakout, number of rollbacks, line expiration by double breakout. Correct, drag or delete the lines and interactively tune the line system. https://youtu.be/EJUo9pYiHFA . Chart examples https: //www.mql5.com/en/users/efficientforex Price Interaction Events All events are effective immediately and only after one
Stochastic Oscillator is one of the most popular and accurate oscillators widely used by traders to capture overbought and oversold areas of price action. Although the Stochastic indicator works fine for an interval of the market, it fails to generate profitable signals when the market conditions change, and hence it produces wrong signals resulting in big losses. Have you ever thought about an adaptive Stochastic indicator that adapts its period of calculation based on the market conditions? Th
The purpose of this new version of the MT4 standard indicator provided in your platform is to display in a sub-window multiple timeframes of the same indicator with its divergences. See the example shown in the picture below. But the display isn't like a simple MTF indicator. This is the real display of the indicator on its timeframe. Here's the options available in the FFx divergences indicator: Select the timeframes to be displayed (M1 to Monthly) Define the width (number of bars) for each tim
The purpose of this new version of the MT4 standard indicator provided in your platform is to display in a sub-window multiple timeframes of the same indicator with its divergences. See the example shown in the picture below. But the display isn't like a simple MTF indicator. This is the real display of the indicator on its timeframe. Here's the options available in the FFx divergences indicator: Select the timeframes to be displayed (M1 to Monthly). Define the width (number of bars) for each ti
作者のその他のプロダクト
Moving Average Convergence Divergence(MACD)トレーディング戦略は、勢いとトレンドの方向の変化を特定するために使用される人気のあるテクニカル分析ツールです。 MACDは、26期間の指数移動平均(EMA)から12期間のEMAを引いて計算されます。 MACDの上には、トリガーとして機能する9期間のEMAである「シグナルライン」がプロットされます。 MACDラインがシグナルラインの上にある場合、MACDはブルッシュ領域と見なされ、下にある場合はベア領域と見なされます。トレーダーはこの情報を使用して、潜在的な買いと売りの機会を特定することがよくあります。 MACDは多目的な指標であり、さまざまな方法で使用できます。一般的な使用方法のいくつかは次のとおりです。 クロスオーバー:MACDラインがシグナルラインを上回るときにはブルッシュクロスオーバーが発生し、MACDラインがシグナルラインを下回るときにはベアクロスオーバーが発生します。 ダイバージェンス:MACDが新しい高値をつけている間に基礎となるセキュリティがそうでない場合、ブルッシュダイバージェンスが発
FREE
RelicusRoad Pro: 定量的市場オペレーティングシステム 【期間限定】無制限アクセス 70% OFF - 2,000人超のトレーダーと共に なぜ多くのトレーダーは「完璧な」インジケーターを使っても失敗するのでしょうか? それは、文脈を無視して 単一の概念 だけでトレードしているからです。文脈のないシグナルは単なるギャンブルです。勝ち続けるには、 根拠の重なり(コンフルエンス) が必要です。 RelicusRoad Proは単なる矢印インジケーターではありません。完全な 定量的市場エコシステム です。独自のボラティリティモデリングを用いて、価格が推移する「適正価値の道(Fair Value Road)」をマッピングし、ノイズと真の構造的ブレイクを判別します。 推測はやめましょう。機関投資家レベルの「ロード・ロジック」でトレードを。 コアエンジン:「Road」アルゴリズム システムの中心となる Road Algo は、市場環境にリアルタイムで適応するダイナミックなボラティリティチャネルです。 安全ライン(平衡点) と、価格が数学的に反転しやすい 拡張レベル を投影します。 Si
Moving Average Convergence Divergence(MACD)トレーディング戦略は、勢いとトレンドの方向の変化を特定するために使用される人気のあるテクニカル分析ツールです。 MACDは、26期間の指数移動平均(EMA)から12期間のEMAを引いて計算されます。 MACDの上には、トリガーとして機能する9期間のEMAである「シグナルライン」がプロットされます。 MACDラインがシグナルラインの上にある場合、MACDはブルッシュ領域と見なされ、下にある場合はベア領域と見なされます。トレーダーはこの情報を使用して、潜在的な買いと売りの機会を特定することがよくあります。 MACDは多目的な指標であり、さまざまな方法で使用できます。一般的な使用方法のいくつかは次のとおりです。 クロスオーバー:MACDラインがシグナルラインを上回るときにはブルッシュクロスオーバーが発生し、MACDラインがシグナルラインを下回るときにはベアクロスオーバーが発生します。 ダイバージェンス:MACDが新しい高値をつけている間に基礎となるセキュリティがそうでない場合、ブルッシュダイバージェンスが発
FREE
1つの口座(マスター)のみで取引しながら、管理されたリスクとロットサイズで同時に複数の口座を管理したいですか? 特徴: マスター (メイン) / スレーブ (アカウントのコピー) 受け入れられたスリッページ (価格差) 乗算/除算 (コピー ロット除算または乗算係数) Lot Factor (割り算や掛け算の係数) すべてを閉じる (すべてのアクティブなポジションを閉じるボタン ) 近日公開: すべて閉じる - スレーブのみ すべての利益ポジションを閉じる - マスターとスレーブ すべての利益を閉じる - スレーブのみ Check out our indicator RelicusRoad for best results: https://www.mql5.com/en/market/product/861300
FREE
RelicusRoad Support Resistance は MetaTrader 4 および MetaTrader 5 向けのサポート・レジスタンスインジケーターで、フラクタルの高値安値から需給ゾーンを構築し、強さと直近のテストに基づいて各ゾーンを格付けします。 価格の上下にある直近のゾーンの短い地図を保持し、各ゾーンには格付け、幅、直近のテスト回数のラベルが付きます。 仕組み 高値と安値のスイングは、単一の線ではなく価格帯としてまとめられます。スイングとは、その足の高値または安値が両側 7 本の足で超えられていない足のことで、より大きな 15 本のスイングや、そのあとに強い反応を伴ったスイングほど重く数えられます。加重したスイングを価格軸に沿って積み上げ、最も密集した独立領域がゾーンになります。各ゾーンは強さのスコアを得て、テストが繰り返されるたびにそのスコアは下がり、ゾーンどうしは Average True Range(ATR)の 0.75 倍以上の間隔を保ち、重ならないように保たれます。 Verified:直近でテストされ、なお強い。 Weak:直近でテストされたが、強さは
RelicusRoad Signal Line は MetaTrader 4 および MetaTrader 5 向けのトレンドフィルターインジケーターで、2 本の移動平均線を描画し、選択した戦略フィルターに応じて各足を緑、サーモン、グレーのいずれかで着色します。 線の位置は平均値を示し、色は選択したフィルターがその足について示す内容を表します。初期設定では Line 1 は Momentum で着色された速い KAMA 9、Line 2 は Ichimoku で着色された遅い Hull 移動平均 200 です。 仕組み 各線は設定した平均タイプと期間を使い、終値から計算されます。線の下には常にグレーのコピーが描かれます。選択したフィルターが上向きと判定した足では緑のセグメントが上に描かれ、下向きと判定した足ではライトサーモンのセグメントになります。フィルターが判定できない場合はグレーの線がそのまま見えます。各線は独自の平均と独自のフィルターを持ちます。 Momentum:直近の確定足の 5 期間モメンタムを、2 本前の値と比較。 Ichimoku:Tenkan が Kijun より上に
RelicusRoad Action Levels は MetaTrader 4 および MetaTrader 5 向けのサポート・レジスタンスレベルインジケーターで、銘柄固有のボラティリティと過去の反応に合わせて主要・補助の価格レベルのグリッドを適合させ、各レベルにタッチ回数のラベルを付けます。 このグリッドは固定 pips の間隔でも、単純なキリの良い数値のグリッドでもありません。間隔とオフセットは確定した足から選ばれ、各レベルは周辺での価格の挙動に基づいてスコア付けされ、現在価格の近くで最も強いレベルだけが描画されます。 仕組み 初期設定の Formula モードでは、選択した時間足の確定済みの足を最大 1,200 本読み込み、スイングの高値・安値、および上下に長いヒゲを持つ足といった反応点を収集します。次に、典型的な足のレンジ、反応点どうしの距離、その両方を組み合わせた値をもとに複数の間隔を試し、それぞれに複数のオフセットを当てはめます。反応点と過去の下げ止まり・上げ止まりに最も近く適合する線を持つグリッドが採用されます。 Touches:価格がそのレベルから明確に離れたあとに
RelicusRoad Daily High Low は MetaTrader 4 および MetaTrader 5 向けの前日高値安値インジケーターで、日中チャートのすべての足に、前日の高値・安値と当日の始値を表示します。 3 つの水準は色分けされたドットの系列として描画され、新しい期間が始まると新しい値へ切り替わり、各期間の終わりには小さな High、Low、Open のタグが付きます。H1 から H4 のチャートでは同じマーカーが前週のレンジと今週の始値を示し、D1 では月次の値を示します。 仕組み チャート上の各足について、インジケーターはその足を含む基準期間を特定します。High と Low のマーカーはその一つ前の期間の高値・安値を、Open のマーカーはその足が属する期間の始値を取ります。基準期間は、自分で選択しない限りチャートの時間足に従います。 Below H1:日次を基準とし、前日の高値・安値と当日の始値。 H1 to H4:週次を基準とし、前週の高値・安値と今週の始値。 D1:月次を基準とし、前月の高値・安値と当月の始値。 W1 and MN1:これらのチャートに
RelicusRoad Daily Pivots は MetaTrader 4 および MetaTrader 5 向けの日次ピボットポイントインジケーターで、前日のレンジをフィボナッチレベルに分割し、マイナス 100 パーセントからプラス 200 パーセントまでその上下に延長します。 従来のフロアピボットではなく、直近の確定したレンジを安値が 0%、高値が 100% となるスケールとして扱います。19 本のレベルがチャート右端にコンパクトな色付きマーカーとして表示されるため、当日の値動きの大きさを前日のレンジに対する割合や倍数として読み取れます。 仕組み インジケーターは直前に確定した基準期間の高値と安値を取り、そのレンジの各比率にレベルを配置します。レベル = 安値 + 比率 x (高値 - 安値)。週末の足はスキップされるため、月曜日の基準は直近の取引日になります。基準期間はチャートの時間足から決まります。 内側のセット(グレー):0%、23.6%、38.2%、50.0%、61.8%、78.6%、100%。 上側のセット(緑):+123.6%、+138.2%、+150.0%、+16
RelicusRoad Scalping Pivots は MetaTrader 4 および MetaTrader 5 向けのスイングポイントおよびフィボナッチレベルインジケーターで、60 本のルックバックで交互に現れるスイングハイとスイングローをマークし、最新のスイングのフィボナッチリトレースメントとエクステンションにラベルを付けます。 名前にある pivots とは、これらのスイングポイントのことであり、PP、R1、S1 のような従来のフロアピボットポイントではありません。最新のスイングの脇に、インジケーターはパーセンテージのラベルを列で表示するため、手でフィボナッチツールを引かなくてもリトレースメントとエクステンションのレベルを読み取れます。 仕組み ある足は、その足自身を含む直近 Range 本の中で最も高い高値であるとき、スイングハイとしてマークされます。スイングローも同様に見つけられます。この判定は過去方向のみを見るため、足はそれまでの極値になった時点でマークされます。2 回目のパスでは、各上昇レッグの最も極端な高値と各下降レッグの最も極端な安値だけが残されるため、マークは
RelicusRoad Dynamic Circles は MetaTrader 4 および MetaTrader 5 向けのスイングハイ・スイングローインジケーターで、9、60、156 本という 3 つのルックバック期間で同時に転換点を円でマークします。 小さな転換と大きな転換は同じチャート上に表示されますが、見た目が異なります。短期レンジのドットは小さなスイングを示し、より大きな中期・長期レンジのリングは、価格がはるかに長いウィンドウの極値をつけた場合にのみ現れます。各円には HH(60) や LL(156) のような短いテキストラベルが付くことがあります。 仕組み インジケーターは各足について、その足自身を含む直近 N 本の中で最も高い高値かどうかを確認します。そうであれば、その足に高値の円が付きます。安値も同様に確認されます。この判定は過去方向のみを見るため、足はそれまでの極値になった時点でマークされます。同じ判定が、それぞれのレンジについて 3 回行われます。 短期レンジ:初期値 9 本、小さなドットで表示。 中期レンジ:初期値 60 本、リングで表示。 長期レンジ:初期値
RelicusRoad Fractals は MetaTrader 4 および MetaTrader 5 向けのフラクタルインジケーターで、スイングハイとスイングローを 2 段階の強度でマークします。Fast は両側 7 本、Slow は両側 15 本で判定します。 両側 7 本のウィンドウだけでも多くの小さな揺れが除かれ、Slow の判定はその 2 倍以上を要求するため、より太い矢印はチャートのはるかに広い範囲で保たれたスイングだけを選び出します。両方の強度が同時に表示されるため、小さなスイングと大きなスイングをひと目で見分けられます。 仕組み ある足は、その左側のウィンドウ内のどの足もより高い高値を付けておらず、右側のウィンドウ内のどの足もそれ以上または同じ高値を付けていない場合に、高値フラクタルとなります。同値の場合は新しい方の足がマークを得ます。安値フラクタルはその鏡像です。判定は 2 つの固定された強度で行われます。 Fast:高値または安値が両側 7 本に対して際立っている必要があります。 Slow:高値または安値が両側 15 本に対して際立っている必要があります。 この判
RelicusRoad Multi Timeframe Trendbar は MetaTrader 4 および MetaTrader 5 向けのマルチタイムフレームトレンドインジケーターで、M1 から MN1 までの 9 つの時間足について Uptrend、Neutral、Downtrend のいずれかの状態を、チャートの隅に色付きドットの行として表示します。 各時間足には、その名前が上に付いた 1 つのドットがチャート右下の隅に表示されます。色が状態を示すため、チャートを切り替えなくても、どの時間足が一致しているかが分かります。 仕組み 各時間足について、インジケーターはその時間足の現在の足で 2 つの標準的なツールを比較します。ステップ 0.02、最大値 0.2 の Parabolic SAR と、期間 14 の ADX の +DI・-DI ラインです。方向を表示するには、この 2 つが一致している必要があります。 Uptrend:Parabolic SAR が終値より下にあり、+DI が -DI より上。初期値はライム。 Downtrend:Parabolic SAR が終値より
RelicusRoad SuperTrend は MetaTrader 4 および MetaTrader 5 向けの SuperTrend インジケーターで、ATR に基づくトレーリングラインを、上昇トレンドでは価格の下、下降トレンドでは価格の上に描画します。 何も上乗せしていない、古典的な SuperTrend の計算です。上側に 1 本、下側に 1 本の線があるだけで、矢印やラベル、パネルはありません。 仕組み インジケーターは各足について、その足の高値と安値の中間点であるメディアン価格を取り、選択した Average True Range(ATR)の単位数だけ上下にバンドを設定します。トレンドは、終値が前の足の上側バンドより上で確定すると上向きに転じ、終値が前の足の下側バンドより下で確定すると下向きに転じます。この 2 つの出来事の間はトレンド側は変わりません。 Uptrend:下側バンドが上昇色で価格の下に描画されます。初期値は緑。 Downtrend:上側バンドが下降色で価格の上に描画されます。初期値はゴールデンロッド。 Flip:アクティブな線が終わり、1 本分空白になった
RelicusRoad Trading Sessions は MetaTrader 4 および MetaTrader 5 向けのトレーディングセッションインジケーターで、M1、M5、M15 のチャート上に、東京、ロンドン、ニューヨーク各セッションの開始時刻を点線の垂直線でマークします。 各セッションの開始は、当日と過去の平日について、そのセッションの色で線、小さく回転した名前のラベル、イベントマーカーとして表示されます。いずれかにカーソルを合わせると、セッション名と開始時刻が表示されます。インジケーターがマークするのは開始のみで、セッションのレンジ、重なり、終了時刻には色を付けません。 仕組み 読み込み時に、インジケーターはブローカーのサーバー時刻と UTC の差を読み取り、整数時間に丸めてから 1 時間差し引きます。そのうえで、現在の UTC の日付からさかのぼった各平日について、東京のオープンを UTC 23:00、ロンドンのオープンを UTC 07:00、ニューヨークのオープンを UTC 12:00 として、サーバー時刻に変換して配置します。土曜日と日曜日はスキップされます。 T
RelicusRoad Trendlines は MetaTrader 4 および MetaTrader 5 向けの自動トレンドラインインジケーターで、確定したスイングピボットを通る 3 つのスイングサイズのトレンドラインチャネルを当てはめ、網掛けのゾーンとして描画します。 短期・中期・長期のスイングはそれぞれ独自の色を持ちます。チャートには、現時点で最もスコアが高い 2 つまたは 3 つのチャネルに加えて、選択された 1 本のレールについてエントリー、ストップ、目標の参照位置を示すグレーの市松模様のボックスが表示されます。 仕組み スイングハイまたはスイングローは、両側に一定本数の確定足がある中でその足が最高値または最安値である場合にのみ確定します。初期値では短期が 9 本、中期が 60 本、長期が 156 本です。最新 10 個のピボットを通る線は、通常そのうち少なくとも 3 個が 0.35 ATR 以内に収まり、その間のピボットが線を突き抜けていないことを必要とします。高値の線と安値の線はそのあとペアにされてチャネルになります。 Active:価格がそのレールを尊重しており、ゾー
RelicusRoad Signal Cloud は MetaTrader 4 および MetaTrader 5 向けのクラウドインジケーターで、12 期間と 26 期間の EMA の差を大きさとして、21 本先まで価格帯を投影します。 バンドは終値の 3 期間 EMA を中心とし、端がなだらかに動くよう平滑化されています。前方へずらされているため、クラウドの一部は常に最新の足より右側にあり、価格はのちに、以前描画された部分へ到達します。 仕組み 各足について、インジケーターは終値の 12 期間と 26 期間の指数移動平均の絶対差、すなわち MACD ラインが示すのと同じ距離を測定します。この差がバンドの半幅になり、終値の 3 期間 EMA に加えると上限、差し引くと下限になります。両方の境界はさらに 9 期間の単純移動平均で平滑化され、右へ 21 本分ずらして表示されます。 Width:EMA 12 と EMA 26 の間の距離。 Center:終値の 3 期間 EMA。このビルドでは固定です。 Smoothing:両方の境界に適用される 9 期間の単純移動平均。 Forward s
RelicusRoad Multi Timeframe Levels は MetaTrader 4 および MetaTrader 5 向けのマルチタイムフレーム型サポート・レジスタンスインジケーターで、H1、H4、D1、W1、MN1 の最新のスイングハイとスイングローを、取引中のチャートに水平線として描画します。 これら 5 つの時間足はそれぞれレジスタンスの線 1 本とサポートの線 1 本を提供するため、日中チャートには最大 10 本の線が表示されます。各線はその由来となった時間足の色で表示されるため、チャートを切り替えなくても上位時間足のスイングを確認できます。 仕組み 固定されたセット内の各時間足について、インジケーターは直近の足からさかのぼり、最新の 5 本フラクタル、すなわちその足の高値が両側 2 本の足で超えられていない足を探します。その高値がその時間足のレジスタンスの線になり、安値に対して同じ判定を行うとサポートの線が得られます。時間足はチャートの時間足と同じか、それより上位の場合にのみ使用されるため、表示されるセットはチャートによって異なります。 M1, M5, M15
RelicusRoad Order Blocks は MetaTrader 4 および MetaTrader 5 向けの order block インジケーターで、変位ローソクを検出し、その値動きを開始したローソクを強気または弱気の order block としてマークし、価格がそのブロックへどこまで戻り込んだかを追跡します。 smart money concepts(SMC)で取引するトレーダー向けに作られています。 仕組み 変位ローソクとは、実体が直近 14 本の Average True Range(ATR)の 1.5 倍以上、かつ自身の高値安値レンジの 55 パーセント以上を占めるローソクです。インジケーターはそこから最大 3 本さかのぼって反対色の最後のローソクを探し、そのローソクの高値と安値が order block になります。変位が直近 20 本の最高値または最安値を超えて終値を付けていれば、ブロックのスコアはさらに高くなりますが、構造のブレイクは必須ではありません。使用されるのは確定した足のみであるため、形成中の足がブロックを新たに作ったり変更したりすることはありませ
RelicusRoad Liquidity Levels は MetaTrader 4 および MetaTrader 5 向けの流動性レベルインジケーターで、加重平均による均衡線とその上下にボラティリティに基づくレベルを描画し、Simple と Smooth のチャネルタイプでは合計 7 本の線になります。 名前とは異なり、これらのレベルは検出された流動性プールやストップの集中ではなく、ボラティリティに基づくバンドです。中心線より上の 3 本は Sell レベル、下の 3 本は Buy レベルと呼ばれます。チャート上では TP/SL-1 から TP/SL-3 のラベルが付き、中心線には Safe Close のラベルが付いて、目標とストップの参照点になります。 仕組み Neutral レベルと呼ばれる中心線は、加重価格の 12 期間線形加重移動平均をさらに加重平均したものです。インジケーターはその線から価格がどれだけ上下に外れるかを測定し、上方向と下方向の値動きを別々に加重するため、上下のバンドの幅が異なることがあります。Level 1 はその乖離の一定倍数の位置に、Level 2 は
RelicusRoad Support Resistance は MetaTrader 4 および MetaTrader 5 向けのサポート・レジスタンスインジケーターで、フラクタルの高値安値から需給ゾーンを構築し、強さと直近のテストに基づいて各ゾーンを格付けします。 価格の上下にある直近のゾーンの短い地図を保持し、各ゾーンには格付け、幅、直近のテスト回数のラベルが付きます。 仕組み 高値と安値のスイングは、単一の線ではなく価格帯としてまとめられます。スイングとは、その足の高値または安値が両側 7 本の足で超えられていない足のことで、より大きな 15 本のスイングや、そのあとに強い反応を伴ったスイングほど重く数えられます。加重したスイングを価格軸に沿って積み上げ、最も密集した独立領域がゾーンになります。各ゾーンは強さのスコアを得て、テストが繰り返されるたびにそのスコアは下がり、ゾーンどうしは Average True Range(ATR)の 0.75 倍以上の間隔を保ち、重ならないように保たれます。 Verified:直近でテストされ、なお強い。 Weak:直近でテストされたが、強さは
RelicusRoad Signal Line は MetaTrader 4 および MetaTrader 5 向けのトレンドフィルターインジケーターで、2 本の移動平均線を描画し、選択した戦略フィルターに応じて各足を緑、サーモン、グレーのいずれかで着色します。 線の位置は平均値を示し、色は選択したフィルターがその足について示す内容を表します。初期設定では Line 1 は Momentum で着色された速い KAMA 9、Line 2 は Ichimoku で着色された遅い Hull 移動平均 200 です。 仕組み 各線は設定した平均タイプと期間を使い、終値から計算されます。線の下には常にグレーのコピーが描かれます。選択したフィルターが上向きと判定した足では緑のセグメントが上に描かれ、下向きと判定した足ではライトサーモンのセグメントになります。フィルターが判定できない場合はグレーの線がそのまま見えます。各線は独自の平均と独自のフィルターを持ちます。 Momentum:直近の確定足の 5 期間モメンタムを、2 本前の値と比較。 Ichimoku:Tenkan が Kijun より上に
RelicusRoad Action Levels は MetaTrader 4 および MetaTrader 5 向けのサポート・レジスタンスレベルインジケーターで、銘柄固有のボラティリティと過去の反応に合わせて主要・補助の価格レベルのグリッドを適合させ、各レベルにタッチ回数のラベルを付けます。 このグリッドは固定 pips の間隔でも、単純なキリの良い数値のグリッドでもありません。間隔とオフセットは確定した足から選ばれ、各レベルは周辺での価格の挙動に基づいてスコア付けされ、現在価格の近くで最も強いレベルだけが描画されます。 仕組み 初期設定の Formula モードでは、選択した時間足の確定済みの足を最大 1,200 本読み込み、スイングの高値・安値、および上下に長いヒゲを持つ足といった反応点を収集します。次に、典型的な足のレンジ、反応点どうしの距離、その両方を組み合わせた値をもとに複数の間隔を試し、それぞれに複数のオフセットを当てはめます。反応点と過去の下げ止まり・上げ止まりに最も近く適合する線を持つグリッドが採用されます。 Touches:価格がそのレベルから明確に離れたあとに
RelicusRoad Daily High Low は MetaTrader 4 および MetaTrader 5 向けの前日高値安値インジケーターで、日中チャートのすべての足に、前日の高値・安値と当日の始値を表示します。 3 つの水準は色分けされたドットの系列として描画され、新しい期間が始まると新しい値へ切り替わり、各期間の終わりには小さな High、Low、Open のタグが付きます。H1 から H4 のチャートでは同じマーカーが前週のレンジと今週の始値を示し、D1 では月次の値を示します。 仕組み チャート上の各足について、インジケーターはその足を含む基準期間を特定します。High と Low のマーカーはその一つ前の期間の高値・安値を、Open のマーカーはその足が属する期間の始値を取ります。基準期間は、自分で選択しない限りチャートの時間足に従います。 Below H1:日次を基準とし、前日の高値・安値と当日の始値。 H1 to H4:週次を基準とし、前週の高値・安値と今週の始値。 D1:月次を基準とし、前月の高値・安値と当月の始値。 W1 and MN1:これらのチャートに
RelicusRoad Daily Pivots は MetaTrader 4 および MetaTrader 5 向けの日次ピボットポイントインジケーターで、前日のレンジをフィボナッチレベルに分割し、マイナス 100 パーセントからプラス 200 パーセントまでその上下に延長します。 従来のフロアピボットではなく、直近の確定したレンジを安値が 0%、高値が 100% となるスケールとして扱います。19 本のレベルがチャート右端にコンパクトな色付きマーカーとして表示されるため、当日の値動きの大きさを前日のレンジに対する割合や倍数として読み取れます。 仕組み インジケーターは直前に確定した基準期間の高値と安値を取り、そのレンジの各比率にレベルを配置します。レベル = 安値 + 比率 x (高値 - 安値)。週末の足はスキップされるため、月曜日の基準は直近の取引日になります。基準期間はチャートの時間足から決まります。 内側のセット(グレー):0%、23.6%、38.2%、50.0%、61.8%、78.6%、100%。 上側のセット(緑):+123.6%、+138.2%、+150.0%、+16
RelicusRoad Dynamic Circles は MetaTrader 4 および MetaTrader 5 向けのスイングハイ・スイングローインジケーターで、9、60、156 本という 3 つのルックバック期間で同時に転換点を円でマークします。 小さな転換と大きな転換は同じチャート上に表示されますが、見た目が異なります。短期レンジのドットは小さなスイングを示し、より大きな中期・長期レンジのリングは、価格がはるかに長いウィンドウの極値をつけた場合にのみ現れます。各円には HH(60) や LL(156) のような短いテキストラベルが付くことがあります。 仕組み インジケーターは各足について、その足自身を含む直近 N 本の中で最も高い高値かどうかを確認します。そうであれば、その足に高値の円が付きます。安値も同様に確認されます。この判定は過去方向のみを見るため、足はそれまでの極値になった時点でマークされます。同じ判定が、それぞれのレンジについて 3 回行われます。 短期レンジ:初期値 9 本、小さなドットで表示。 中期レンジ:初期値 60 本、リングで表示。 長期レンジ:初期値
RelicusRoad Fractals は MetaTrader 4 および MetaTrader 5 向けのフラクタルインジケーターで、スイングハイとスイングローを 2 段階の強度でマークします。Fast は両側 7 本、Slow は両側 15 本で判定します。 両側 7 本のウィンドウだけでも多くの小さな揺れが除かれ、Slow の判定はその 2 倍以上を要求するため、より太い矢印はチャートのはるかに広い範囲で保たれたスイングだけを選び出します。両方の強度が同時に表示されるため、小さなスイングと大きなスイングをひと目で見分けられます。 仕組み ある足は、その左側のウィンドウ内のどの足もより高い高値を付けておらず、右側のウィンドウ内のどの足もそれ以上または同じ高値を付けていない場合に、高値フラクタルとなります。同値の場合は新しい方の足がマークを得ます。安値フラクタルはその鏡像です。判定は 2 つの固定された強度で行われます。 Fast:高値または安値が両側 7 本に対して際立っている必要があります。 Slow:高値または安値が両側 15 本に対して際立っている必要があります。 この判
RelicusRoad Multi Timeframe Trendbar は MetaTrader 4 および MetaTrader 5 向けのマルチタイムフレームトレンドインジケーターで、M1 から MN1 までの 9 つの時間足について Uptrend、Neutral、Downtrend のいずれかの状態を、チャートの隅に色付きドットの行として表示します。 各時間足には、その名前が上に付いた 1 つのドットがチャート右下の隅に表示されます。色が状態を示すため、チャートを切り替えなくても、どの時間足が一致しているかが分かります。 仕組み 各時間足について、インジケーターはその時間足の現在の足で 2 つの標準的なツールを比較します。ステップ 0.02、最大値 0.2 の Parabolic SAR と、期間 14 の ADX の +DI・-DI ラインです。方向を表示するには、この 2 つが一致している必要があります。 Uptrend:Parabolic SAR が終値より下にあり、+DI が -DI より上。初期値はライム。 Downtrend:Parabolic SAR が終値より
RelicusRoad Scalping Pivots は MetaTrader 4 および MetaTrader 5 向けのスイングポイントおよびフィボナッチレベルインジケーターで、60 本のルックバックで交互に現れるスイングハイとスイングローをマークし、最新のスイングのフィボナッチリトレースメントとエクステンションにラベルを付けます。 名前にある pivots とは、これらのスイングポイントのことであり、PP、R1、S1 のような従来のフロアピボットポイントではありません。最新のスイングの脇に、インジケーターはパーセンテージのラベルを列で表示するため、手でフィボナッチツールを引かなくてもリトレースメントとエクステンションのレベルを読み取れます。 仕組み ある足は、その足自身を含む直近 Range 本の中で最も高い高値であるとき、スイングハイとしてマークされます。スイングローも同様に見つけられます。この判定は過去方向のみを見るため、足はそれまでの極値になった時点でマークされます。2 回目のパスでは、各上昇レッグの最も極端な高値と各下降レッグの最も極端な安値だけが残されるため、マークは
RelicusRoad SuperTrend は MetaTrader 4 および MetaTrader 5 向けの SuperTrend インジケーターで、ATR に基づくトレーリングラインを、上昇トレンドでは価格の下、下降トレンドでは価格の上に描画します。 何も上乗せしていない、古典的な SuperTrend の計算です。上側に 1 本、下側に 1 本の線があるだけで、矢印やラベル、パネルはありません。 仕組み インジケーターは各足について、その足の高値と安値の中間点であるメディアン価格を取り、選択した Average True Range(ATR)の単位数だけ上下にバンドを設定します。トレンドは、終値が前の足の上側バンドより上で確定すると上向きに転じ、終値が前の足の下側バンドより下で確定すると下向きに転じます。この 2 つの出来事の間はトレンド側は変わりません。 Uptrend:下側バンドが上昇色で価格の下に描画されます。初期値は緑。 Downtrend:上側バンドが下降色で価格の上に描画されます。初期値はゴールデンロッド。 Flip:アクティブな線が終わり、1 本分空白になった
フィルタ:
Erwin Fonke
646
Erwin Fonke 2025.09.05 06:45 
 

i am using this indicator in combination with a EA trading assistent. It,s absolute amazing. Almost passed my FTMO challange now. Great work man! Keep it up!

Juan Feliciano
1730
Juan Feliciano 2025.05.07 21:26 
 

great indicator. super clean and accurate entries. just want to know how to join discord pls

Danny Tsang
288
Danny Tsang 2025.05.01 08:58 
 

ユーザーは評価に対して何もコメントを残しませんでした

Relicus LLC
36890
開発者からの返信 Waleed Ur Rehman 2025.05.01 21:40
Sure. Welcome to the RelicusRoad Community! Please check your private message.
Manuel Gonzalez
170
Manuel Gonzalez 2025.02.16 14:46 
 

Good morning everyone. Please to the administrator and owner of the indicator. A few years ago I bought this wonderful indicator and wanted to make it work. There was a gentleman within discord who helped me a lot but due to my inexperience I did not understand the instructions well. Now I have acquired more experience and please would like to recover the accesses to: User Manual + Strategies + Training Videos + Private Group with VIP Access + Mobile Version Available (Separately) Please help me recover these accesses. Thank you very much...

Relicus LLC
36890
開発者からの返信 Waleed Ur Rehman 2025.02.17 17:25
Please check your private message :)
ashiem1
49
ashiem1 2024.07.26 23:01 
 

Before I read and understood the documentation or the training that accompanied this indicator, I placed this on my demo chart and was truly overwhelmed with all of the information and insight into what price was doing. What I did understand was I saw price hitting and reacting to a level of resistance along with (at one simple glance) seeing the indicator telling me all of the HTFrames were also trending down. I took that trade and easily hit my TP. I have since been able to go through the training and see where this indicator is much more robust than I could have ever imagined. Anyone trading one of the many strategies included or trading their own can't help but benefit from this purchase. Truly AMAZING!

CHUNGSIK YOU
672
CHUNGSIK YOU 2024.02.09 02:56 
 

Hello, it's been 8 months since I bought the product. I'd like to get a lot of help.

1. RelicusRoad User Guide

2. Training Videos

3. Private Discord Group Access

4. VIP Status

How can I get four support?

please can you send me manual and discord? Thank you

Relicus LLC
36890
開発者からの返信 Waleed Ur Rehman 2024.02.14 09:55
Indicator manual has been sent to your private message and you may find required full support guide in it.
Oscar Jesus Murillo Zamora
309
Oscar Jesus Murillo Zamora 2024.02.03 21:55 
 

developer always looking to optimized the product, really good indicator, has evrything you need for your trading, love it

moneyfx3593
19
moneyfx3593 2024.01.24 18:11 
 

I've been using this since April 2021 before it was on MQL5 . Amazing indicator with top notch support and commitment for ongoing development from the RR team. Great/friendly Discord group too!

zaid filtons
141
zaid filtons 2024.01.23 15:53 
 

(i love this indicator) At first i didn't know what i was doing i lost money even though there was tutorial videos i speeded through the tutorial videos thinking i was confident to have a go again and lost again, then i got frustrated thinking it was the creator that had made a bad indicator also put a bad review, the creator contacted me he is really nice guy he offered a 1 to 1 session or either a refund for the indicator... and i am glad i chose the 1 to 1 session. after the 1 to1 session i had it took me a few days to get use to the indicator and the losses i made were made back within few days. yes i do feel like a fool after what i did but most of all this indictor is worth penny the creator has made a discord channel for those who have purchased the indicator in this discord channel you have everything you need for the indicator ... even the creator works on the indicator near enough everyday to make it perfect for those who find faults as in small to big details on the indicator like the alerts signal performance etc. it feels like the creator has made an indicator that is probably worth a lot more than it is like an advert you see with for 2000 dollar plus indicator which a lot cant afford which am glad i bought, i usually wake up late nearly everyday in the afternoon time and for this indicator i wake up so early excited just to trade with the indicator. once a again thank you to the creator and please try not to do what i did at the beginning if you are struggling and you dont know what you are doing , speak to the creator he will help you out the creator took one hour of his time just to teach me what to do which i am very happy he did.

Steffen Schmidt
1059
Steffen Schmidt 2024.01.19 13:43 
 

Not honest business practices. Good luck with your business endeavors with repainting indicator.

Relicus LLC
36890
開発者からの返信 Waleed Ur Rehman 2024.01.19 13:58
Our indicator consists of 24 different features. 20 features are non-repaint and only 4 features are repaint. I do not understand what you're referring to and why are you saying it's not honest practice? We have open discord group to discuss any issues, we do not ban anyone unless they try to spam or try to sell their services to other people.
Oneill The Best
57
Oneill The Best 2024.01.05 09:11 
 

don t trust this guys they sell this system but if u don t know how to use it and u ask for help they want 60 $ per month to tell u how it s works lol. so u send me to the guy who have asked for the money Ș))))))) is this a joke? i have spoked to this salahudin today and it was the one asking for the money

Relicus LLC
36890
開発者からの返信 Waleed Ur Rehman 2024.01.19 13:56
We do not charge any of our customers to provide guidance on the indicator. Please co-ordinate with Salahuddin on Discord to assist you.
tomaszroman26
171
tomaszroman26 2023.12.03 21:28 
 

A stunning piece of art. This system will provide you with all you need to learn how to build a profitable empire slowly. I have tested it for more than a month and already have great results. The support the developer gives you makes it even better. They always answer with help. I give it 5 stars and highly recommend it if you search for complex solutions!

Qinchao Zhang
681
Qinchao Zhang 2023.11.30 09:37 
 

Many functions are numerous but lack refinement, making them mostly trivial and of little practical value, especially unsuitable for long-term trading.

gogibaidwan
34
gogibaidwan 2023.11.22 23:17 
 

ユーザーは評価に対して何もコメントを残しませんでした

Relicus LLC
36890
開発者からの返信 Waleed Ur Rehman 2023.11.23 05:12
Indicator manual and discord invitation link has been sent to your private message
Arthit Fx
198
Arthit Fx 2023.11.19 09:50 
 

ユーザーは評価に対して何もコメントを残しませんでした

Relicus LLC
36890
開発者からの返信 Waleed Ur Rehman 2023.11.20 05:00
Indicator manual has been sent to your private message
maido
505
maido 2023.11.17 02:37 
 

Please send me the manual and invite me to the discord.

Relicus LLC
36890
開発者からの返信 Waleed Ur Rehman 2023.11.17 13:13
Indicator manual and discord invitation have been sent to your private message
aa973140507
42
aa973140507 2023.11.11 04:28 
 

我已经购买了这个指标,使用了几个月,后面才发现没有手册也没有加入discord 小组。

Relicus LLC
36890
開発者からの返信 Waleed Ur Rehman 2023.11.15 14:28
一旦您购买并向我们发送消息。然后,我们会通过私人消息向您发送手册以及私人群组的邀请。
Welber Goncalves
412
Welber Goncalves 2023.11.03 16:50 
 

ユーザーは評価に対して何もコメントを残しませんでした

Relicus LLC
36890
開発者からの返信 Waleed Ur Rehman 2023.11.04 16:53
Indicator manual with discord invitation link has been sent to your private message
mjh12345
263
mjh12345 2023.10.31 12:56 
 

Plenty of support if you join Discord, plenty of options to improve your trading combined in one indicator, plenty of strategies to select from dependent upon your trading style, Salahuddin is both friendly and helpful, I'm pretty confident that there is not much else out there that comes close for $147, constant improvement. Once you realise that there are VERY few consistantly profitable EA's and switch your attention and education to manual trading you will realise what an asset this indicator is..........in my opinion.

Update. 31/01/2024

I'm still using the indicator and I have no idea why we have the bad reviews here. I'm very pleased and will most likely purchase the complete set (TV,MT5&4) in the coming months. Thank you guys.

Steve Agleron
330
Steve Agleron 2023.10.20 14:46 
 

Hard to use. its a bit complicated to use and there isn't really much help or support to get started.

Relicus LLC
36890
開発者からの返信 Waleed Ur Rehman 2023.10.23 01:58
Did you join the discord group? Because we have dedicated people to help. You can contact Salahuddin for any help. Also if you look at the manual, you can just choose from any one of the strategies and follow through with the strategies on the discord server.
レビューに返信