RSI multi timeframes lines builder
- インディケータ
- バージョン: 2.11
- アップデート済み: 16 6月 2026

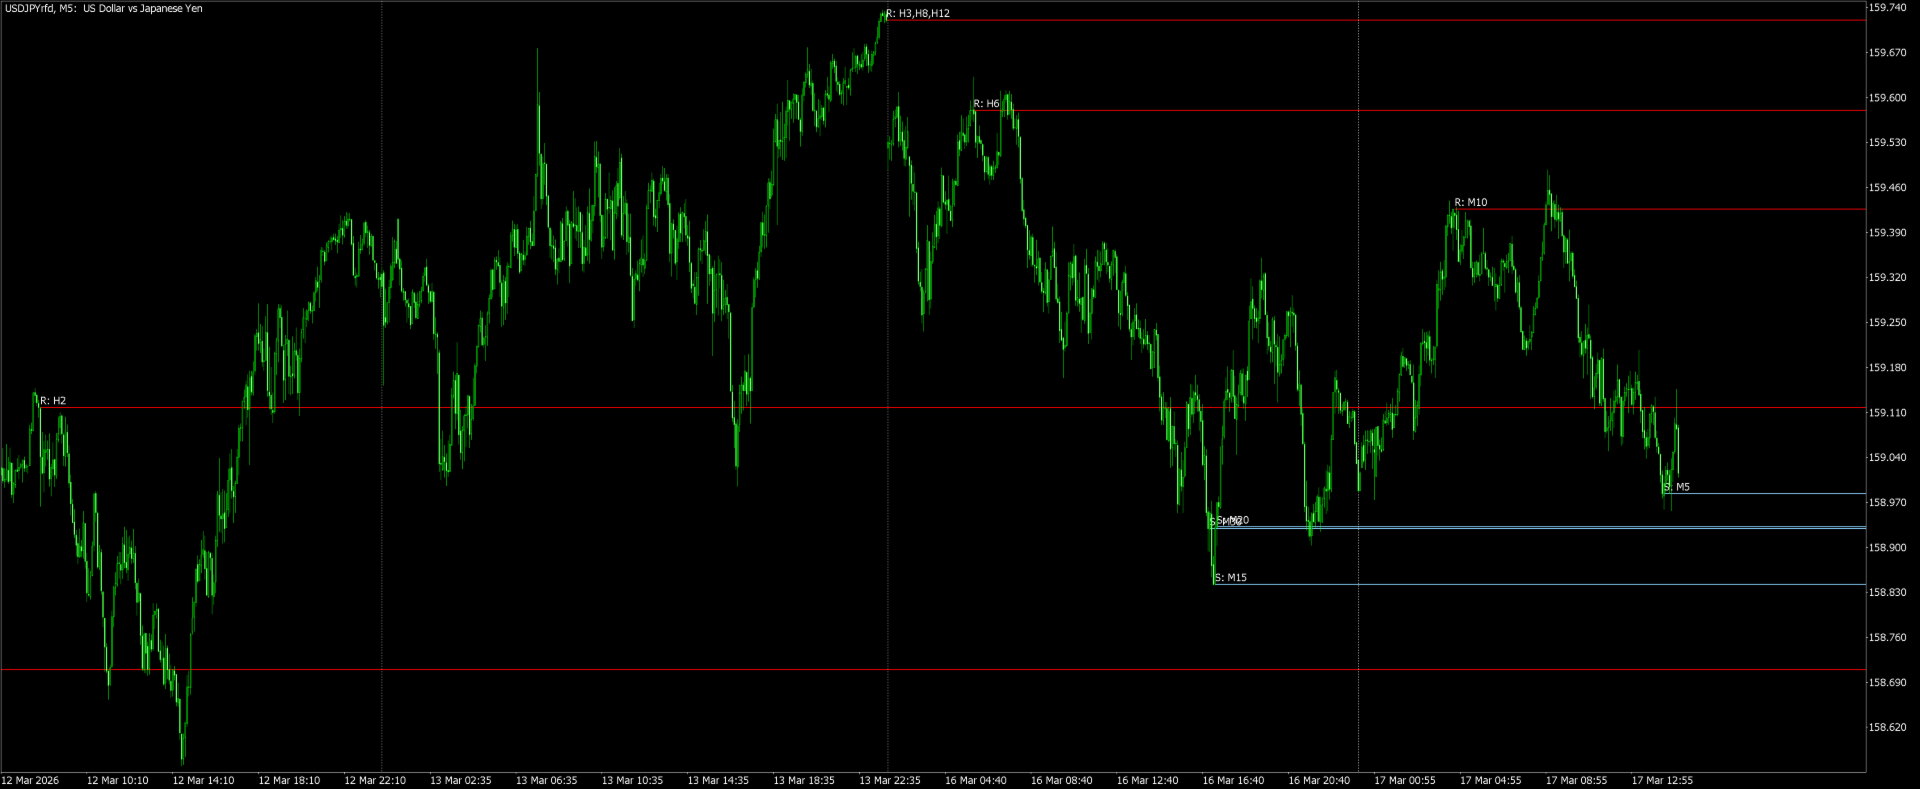
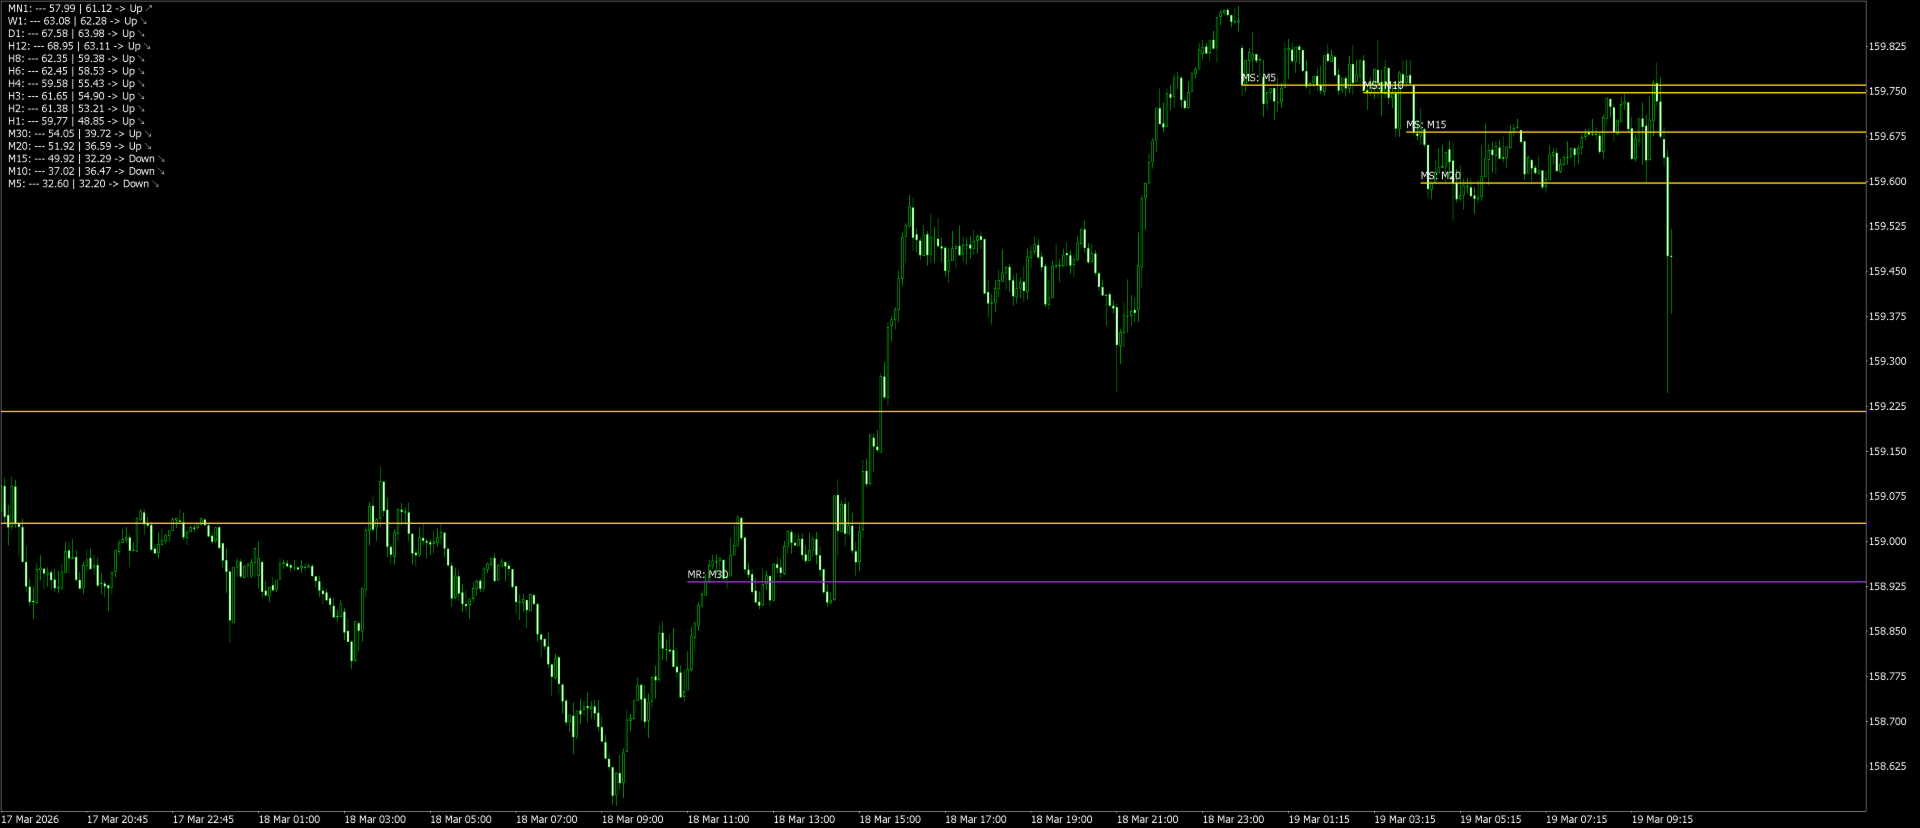
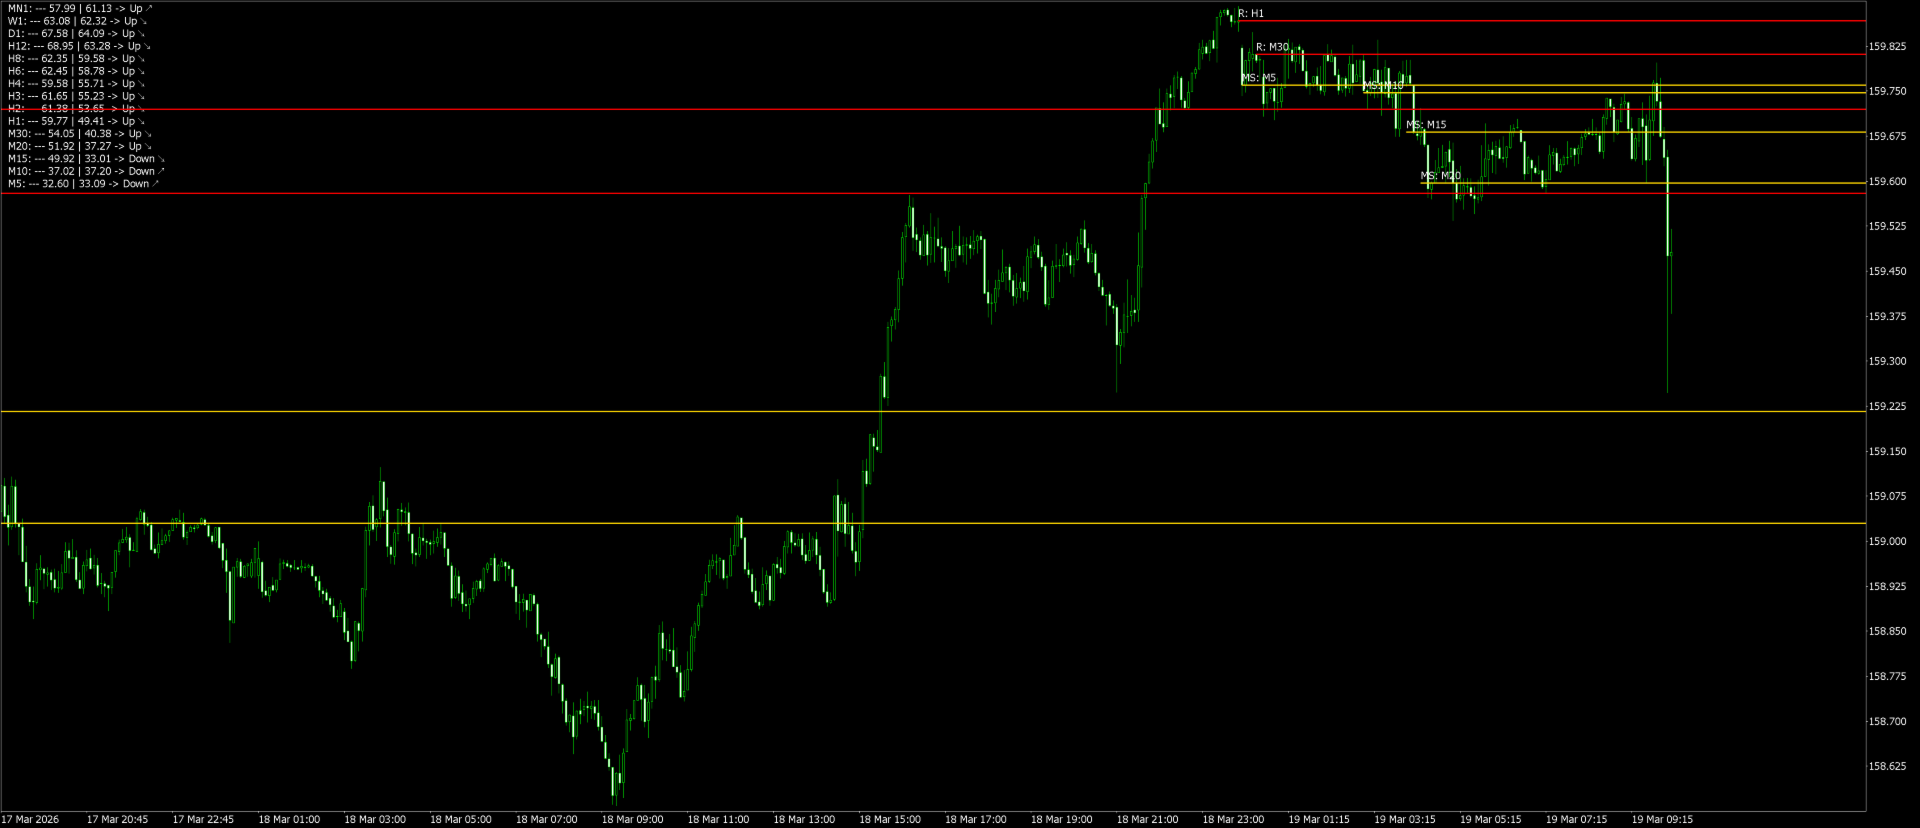
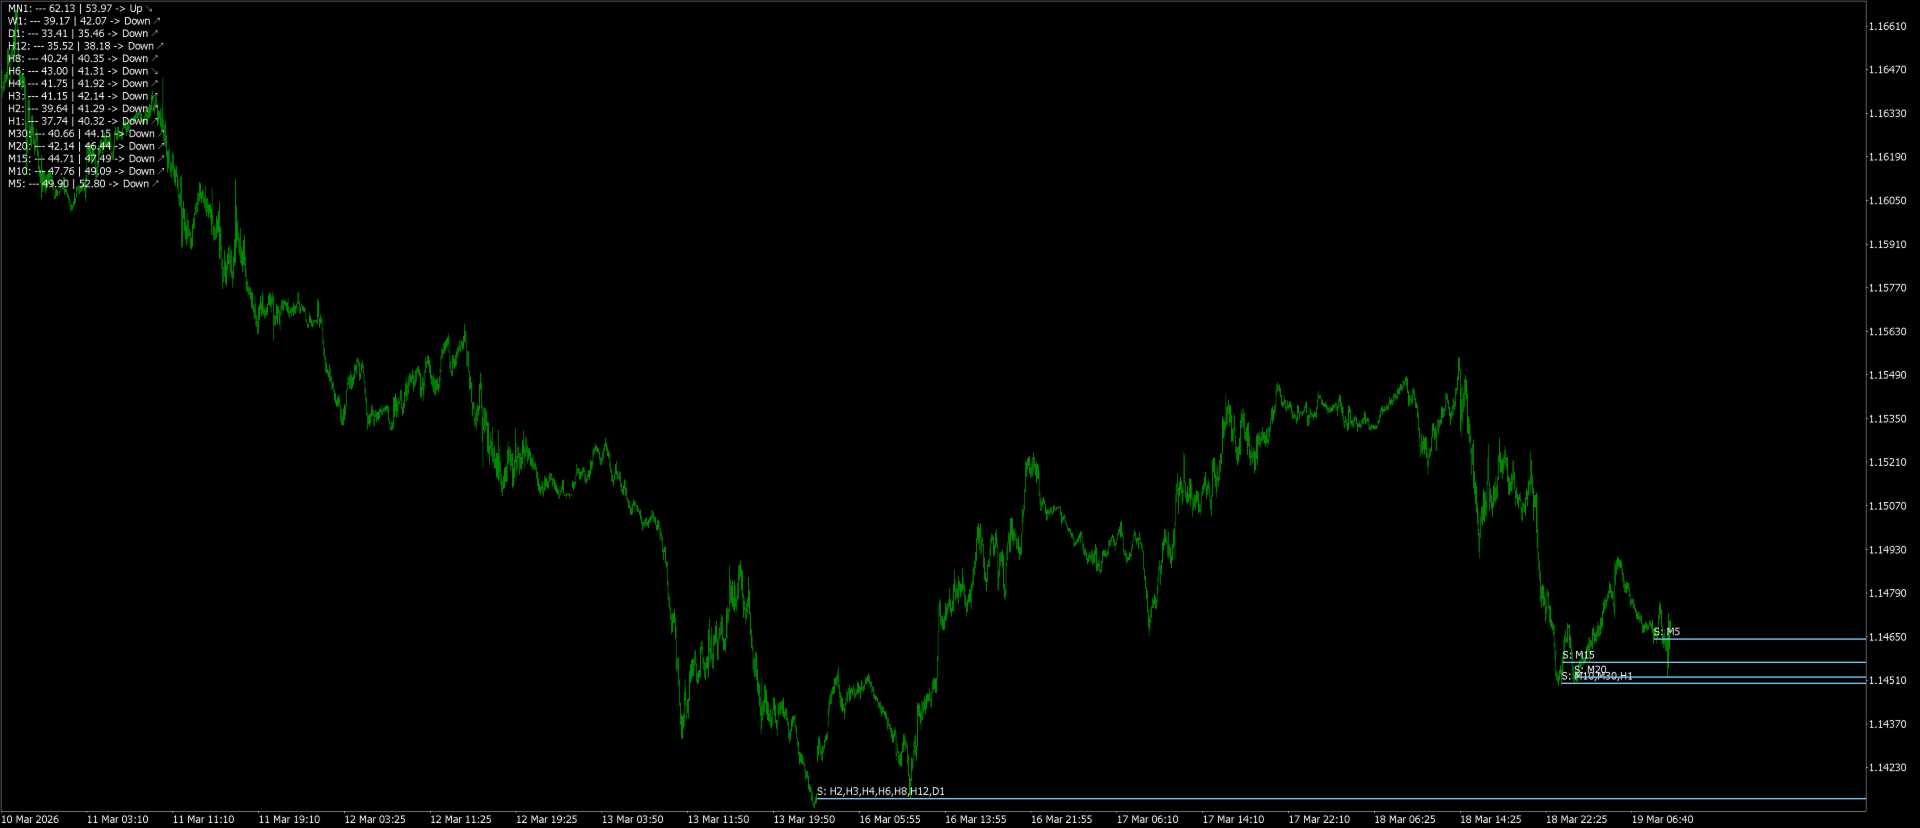
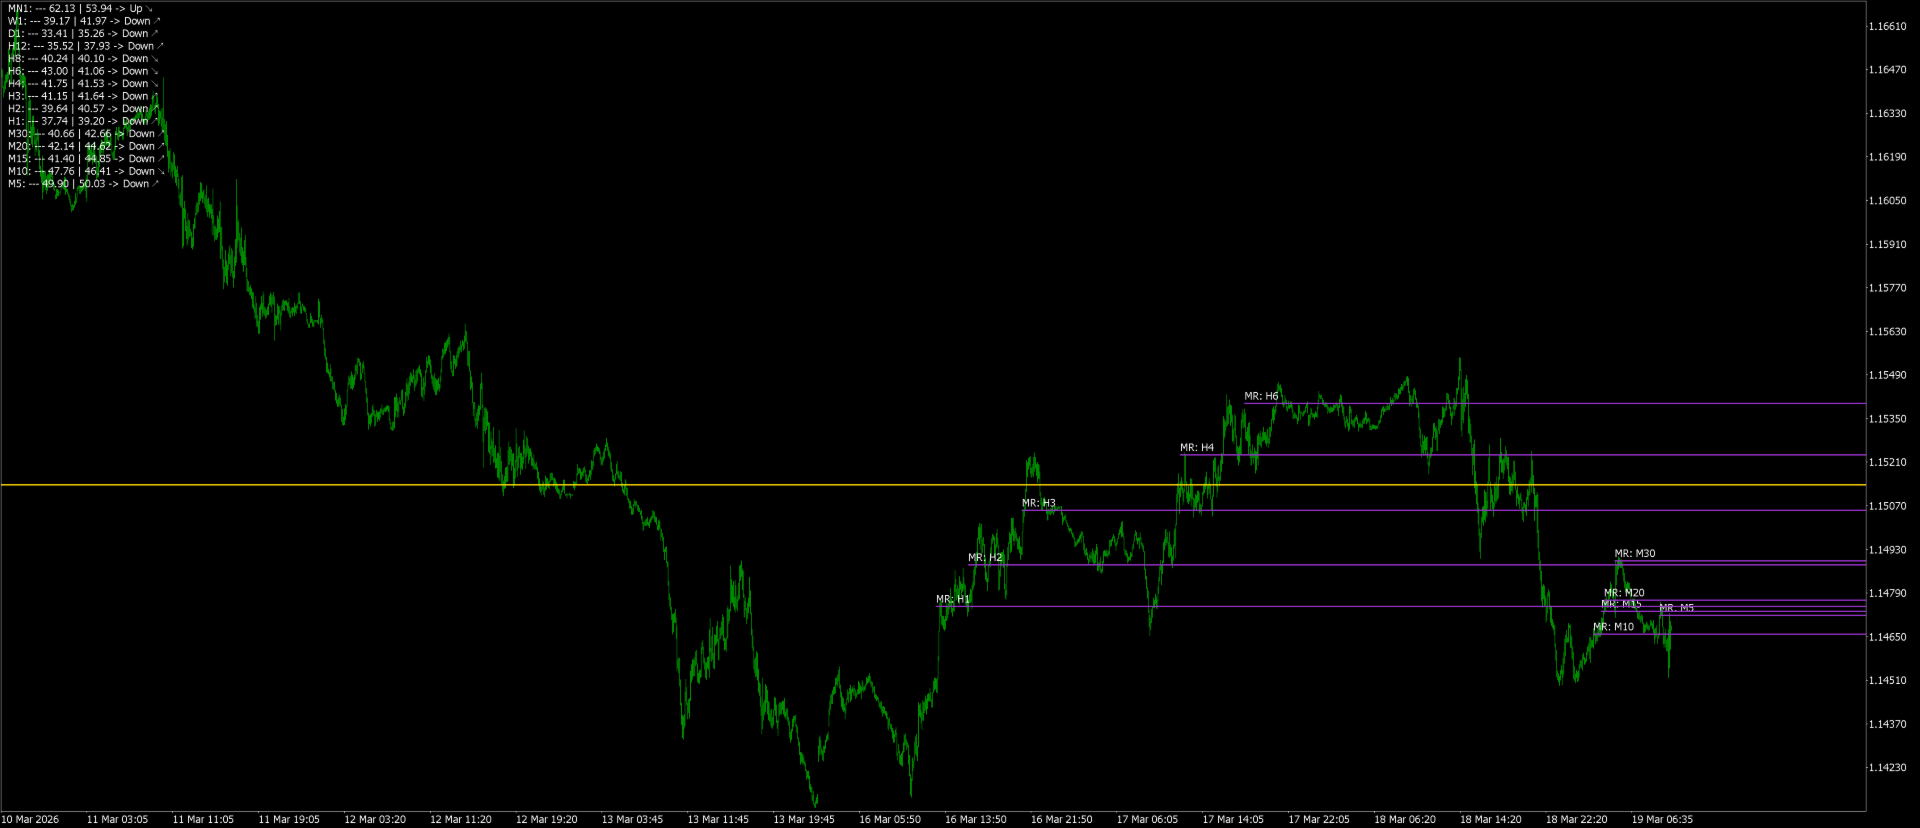
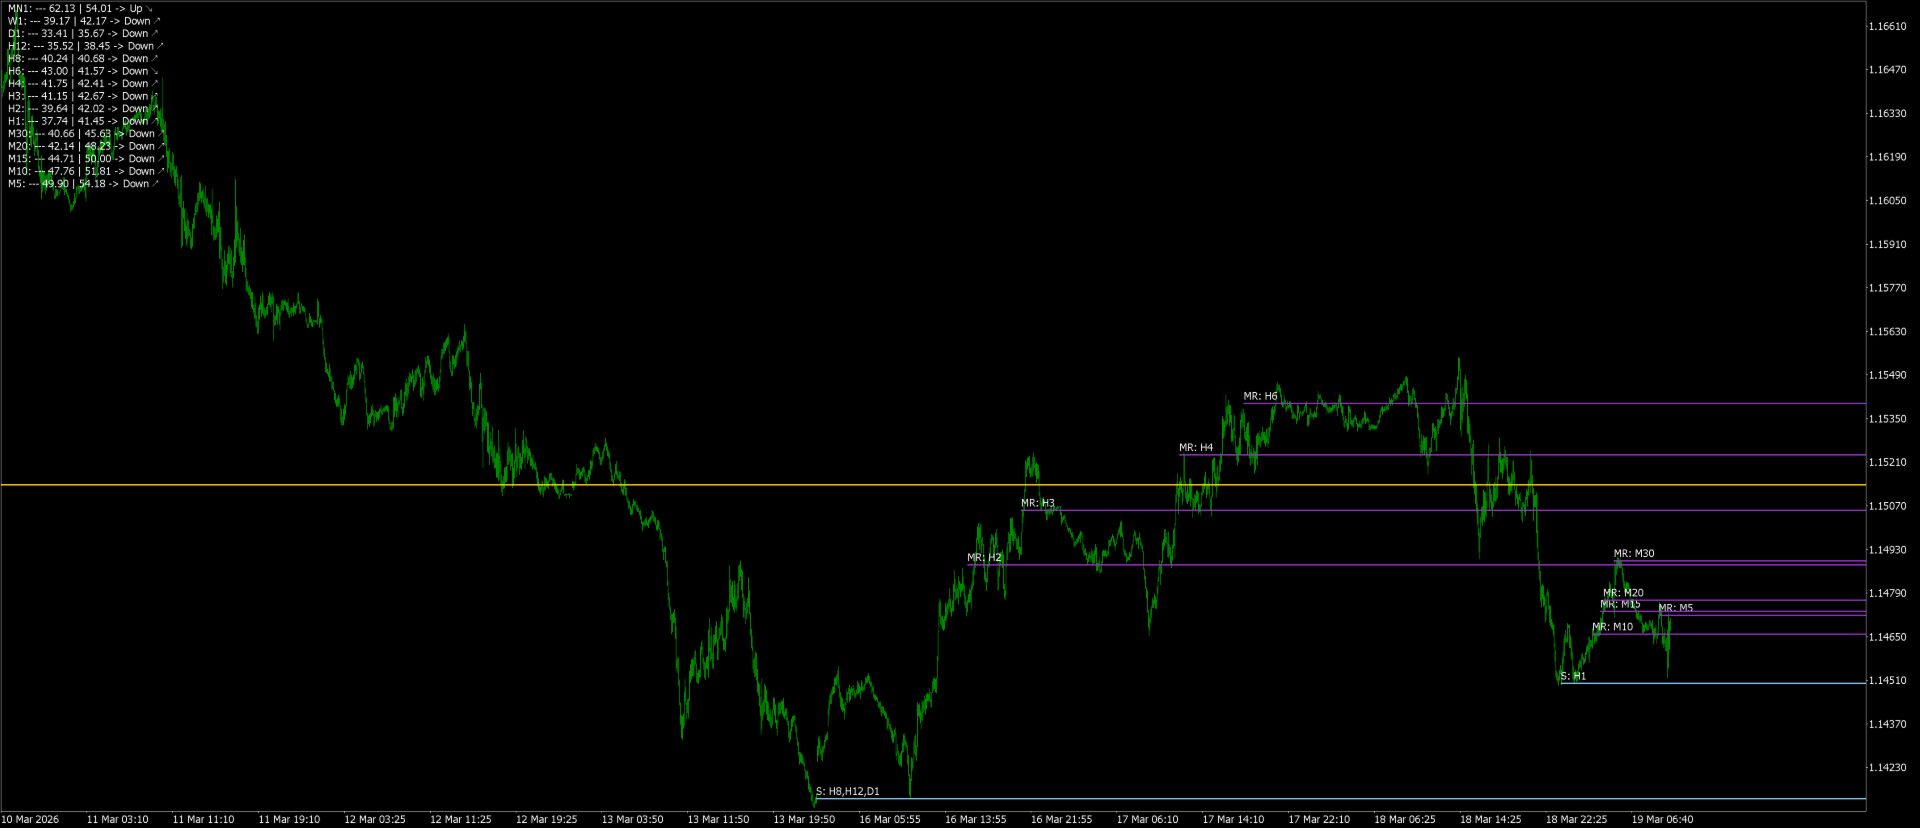
The indicator draws horizontal lines based on the RSI indicator's overbought and oversold levels.
The closing prices of the bar are selected when it exits the overbought zone or when the RSI indicator first crosses the 50% line.
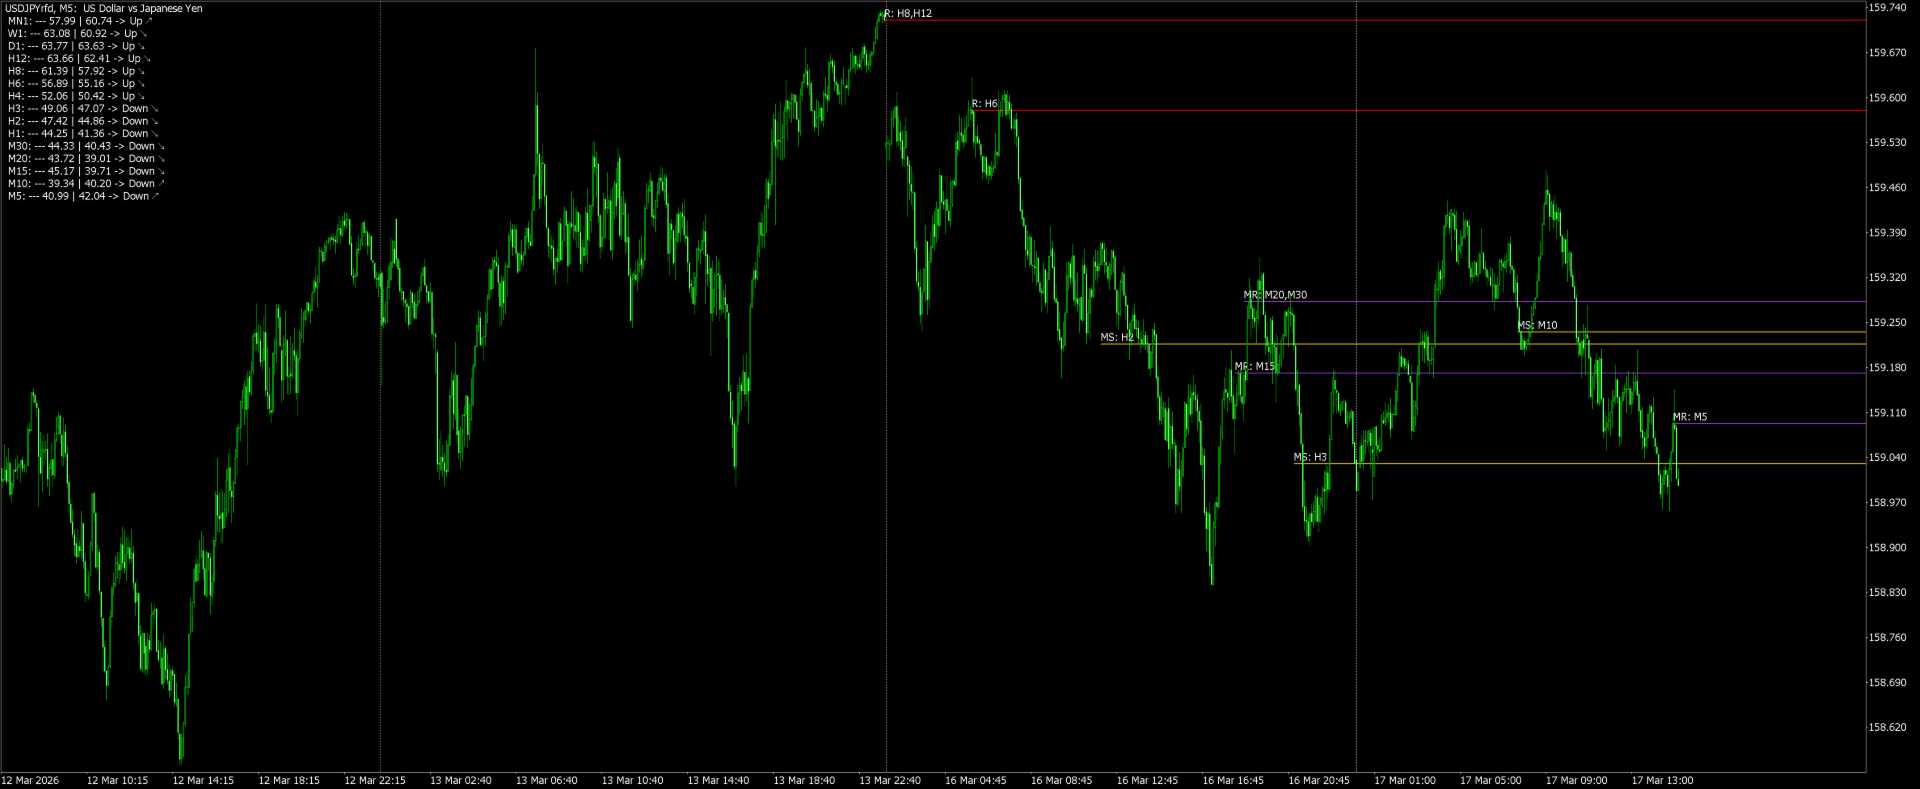
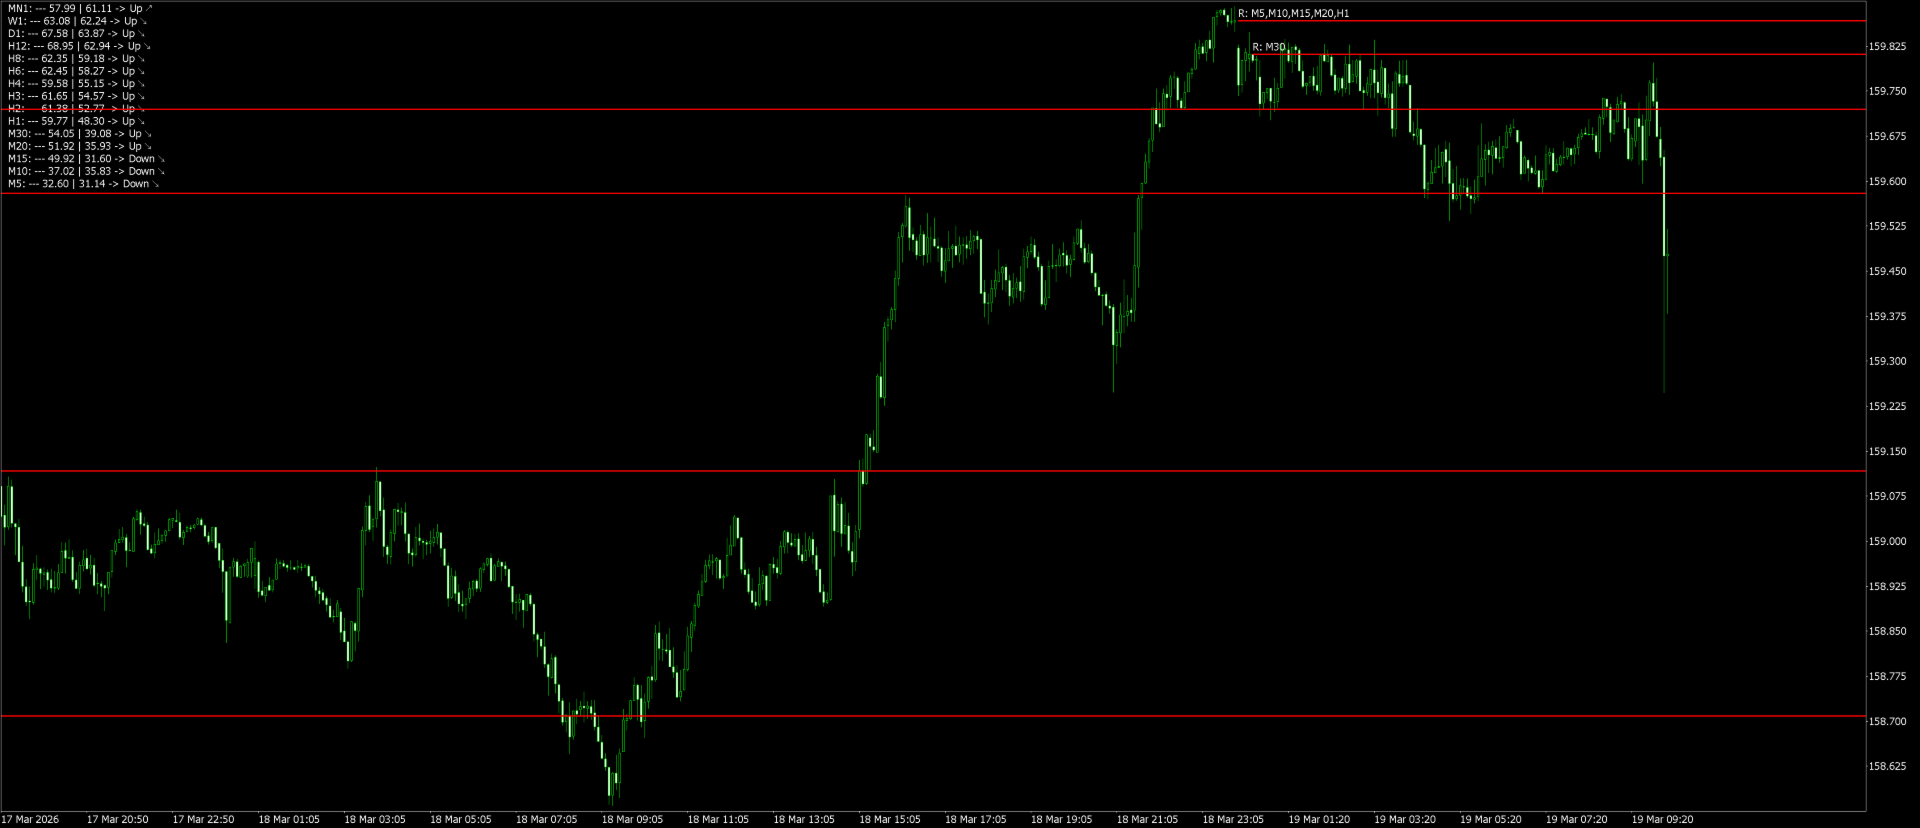
For more information, you can enable the display of RSI values for the most recently closed bars in the upper left corner.
It also displays information about whether the RSI indicators are in the overbought or oversold zone.
All timeframes are available.
Can be enabled or disabled in any combination.
The indicator is based on the algorithm of this free indicator: https://www.mql5.com/en/market/product/71793