Trend Hunter MT5
- インディケータ
-
Andrey Tatarinov
 Robot for trading on news
https://www.mql5.com/en/market/product/10427
Trend Hunter indicator with the ability to send signals to Telegram - バージョン: 4.1
- アップデート済み: 18 7月 2025
- アクティベーション: 12
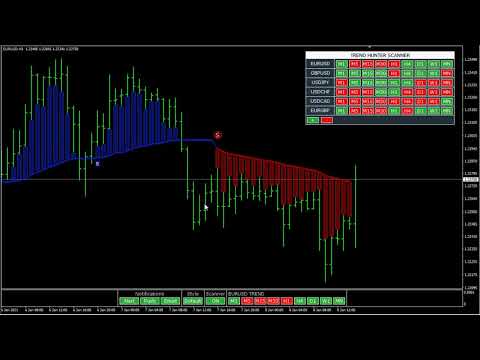
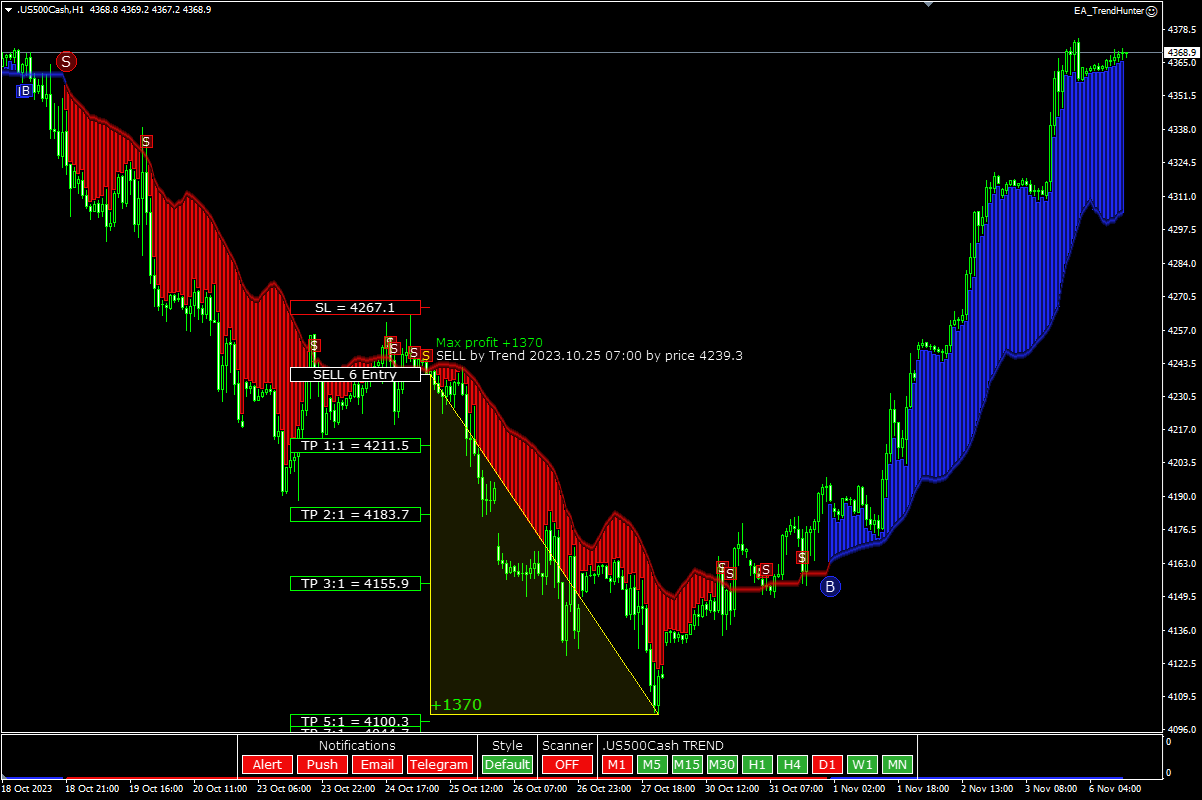
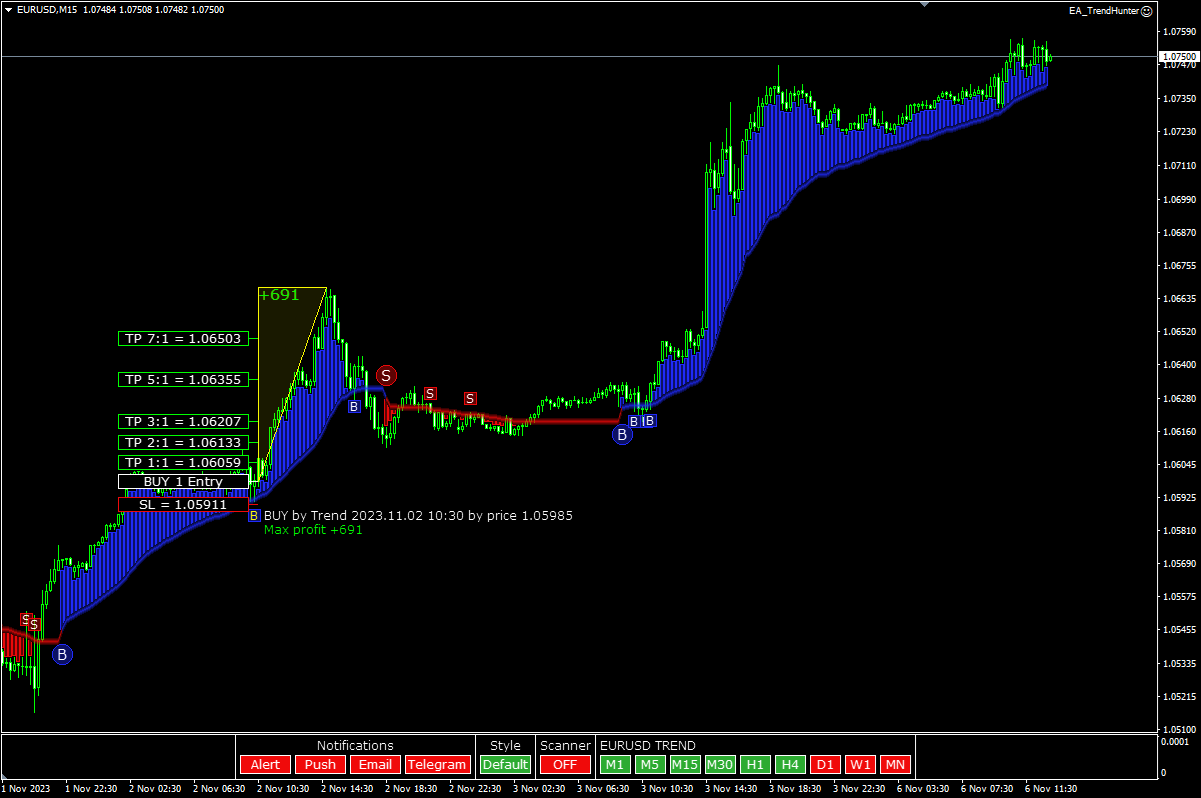
Trend Hunter は、外国為替、仮想通貨、CFD 市場におけるトレンド指標です。 このインジケーターの特別な特徴は、価格がトレンドラインをわずかに突き抜けたときにシグナルを変更することなく、自信を持ってトレンドに従うことです。
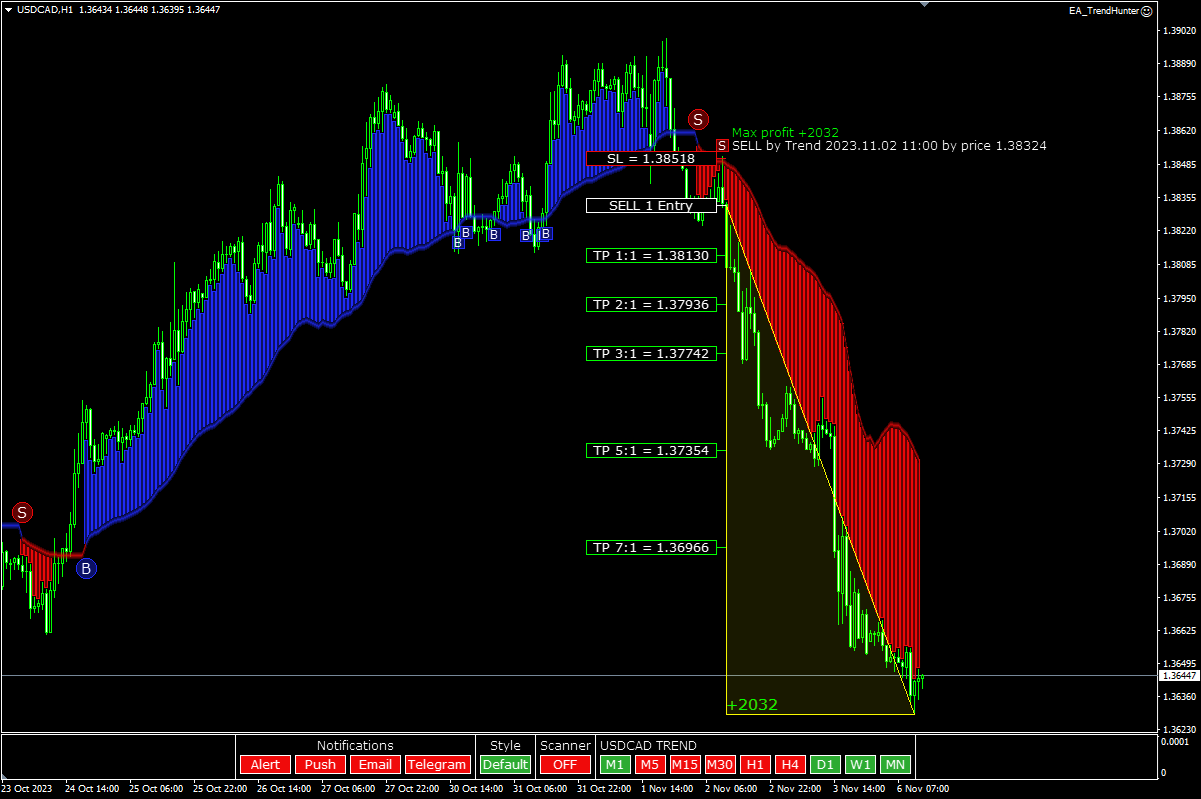
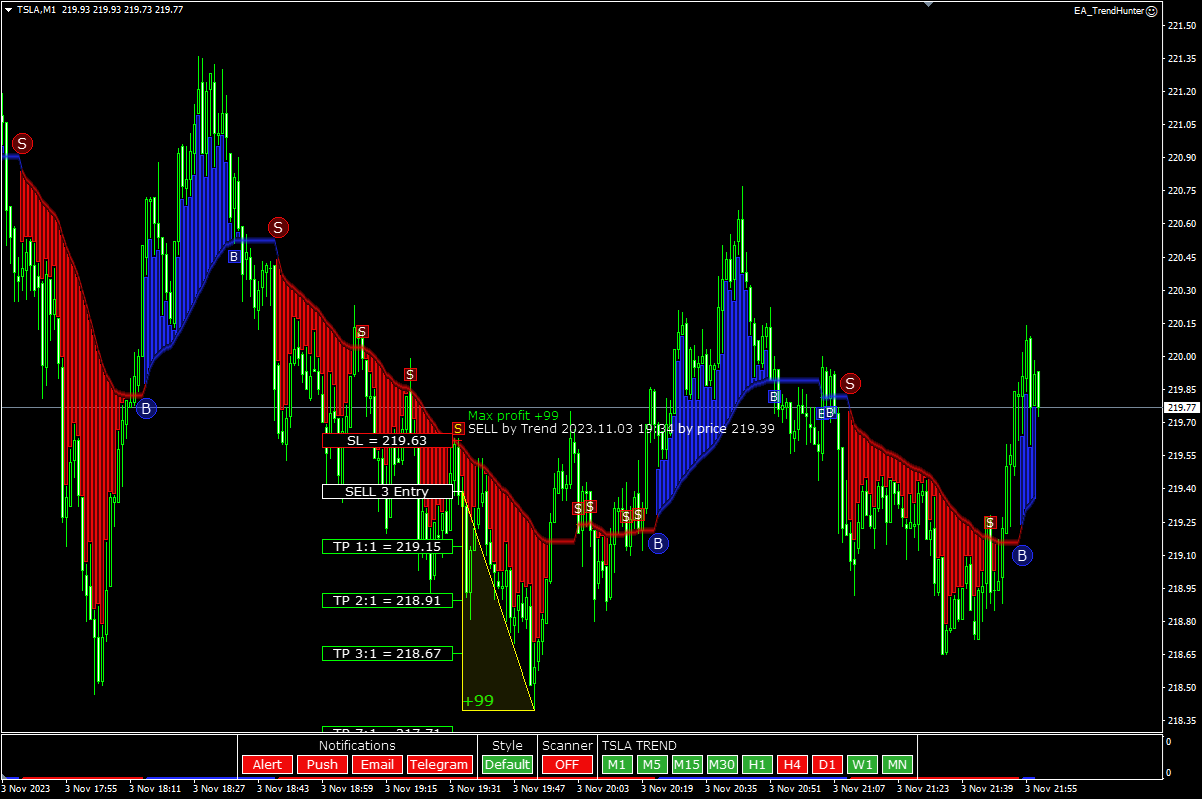
インジケーターは再描画されず、バーが閉じた後に市場に参入するシグナルが表示されます。
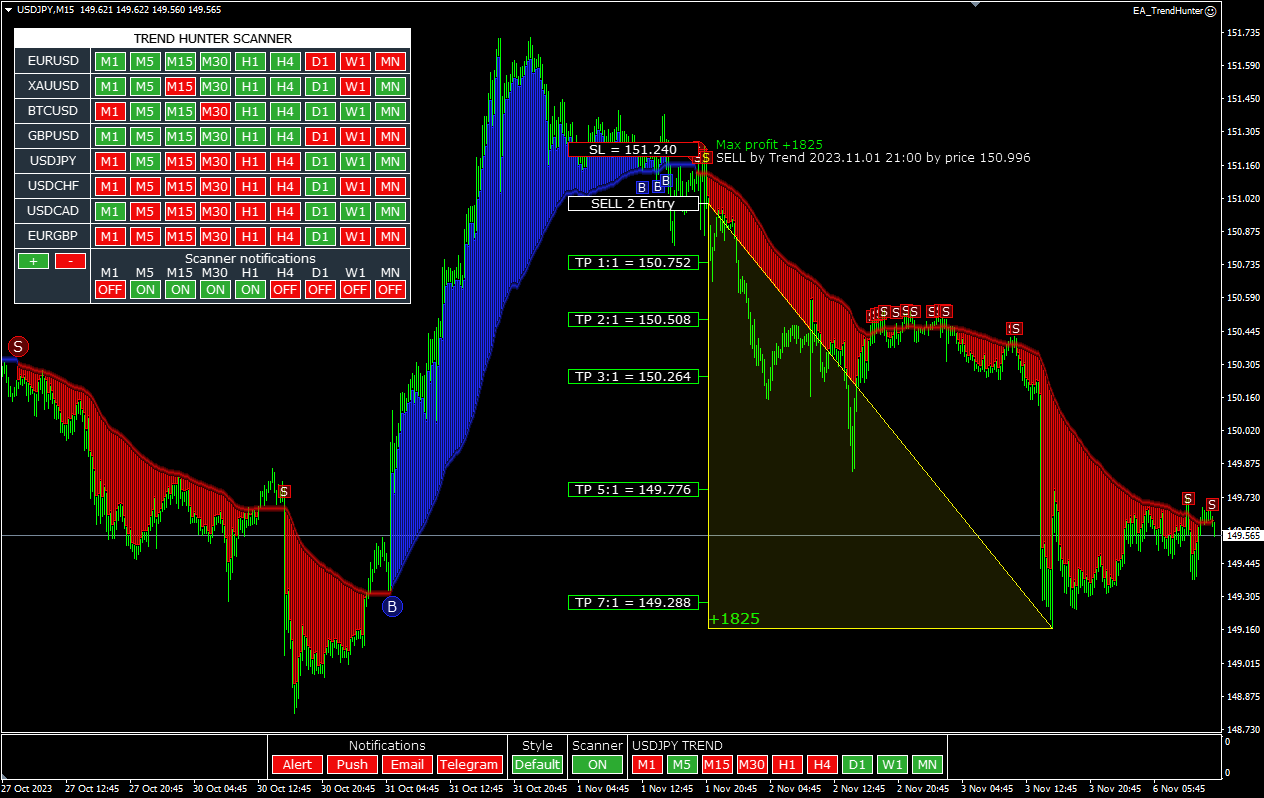
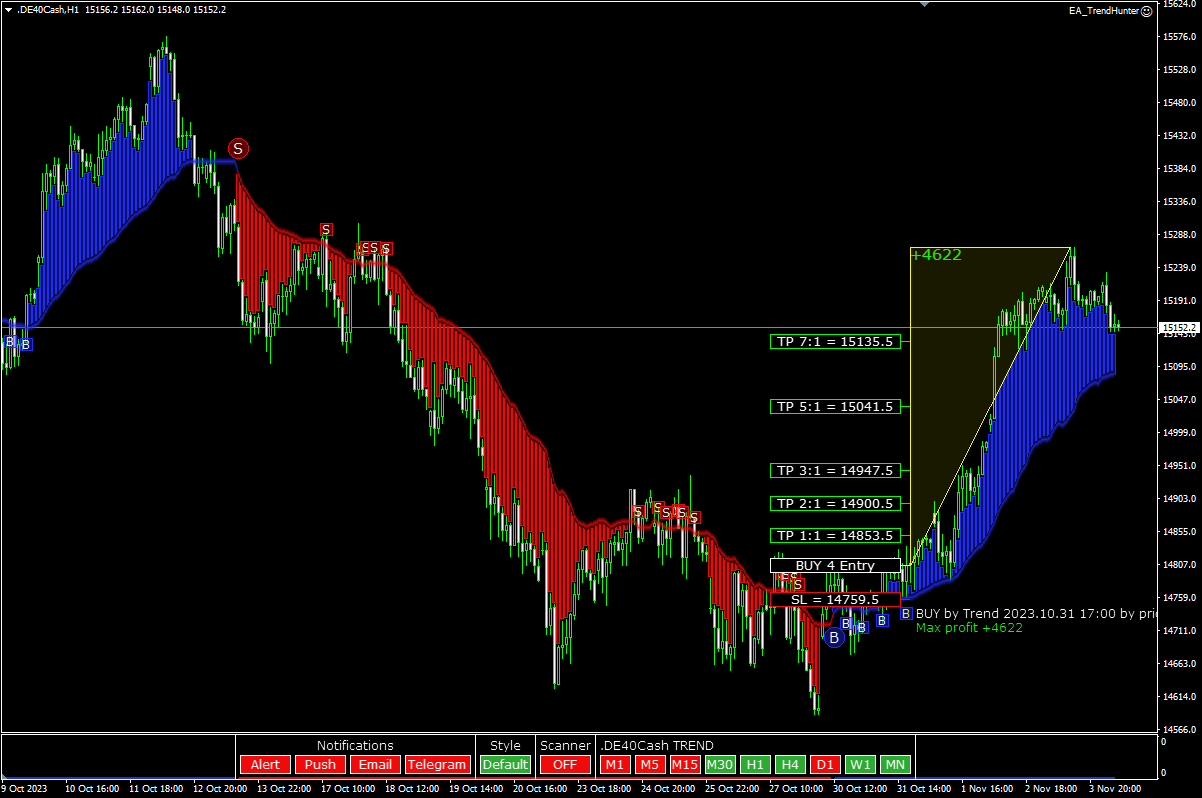
トレンドに沿って移動すると、インジケーターにはトレンドの方向に追加のエントリーポイントが表示されます。 これらのシグナルに基づいて、小さなストップロスで取引できます。
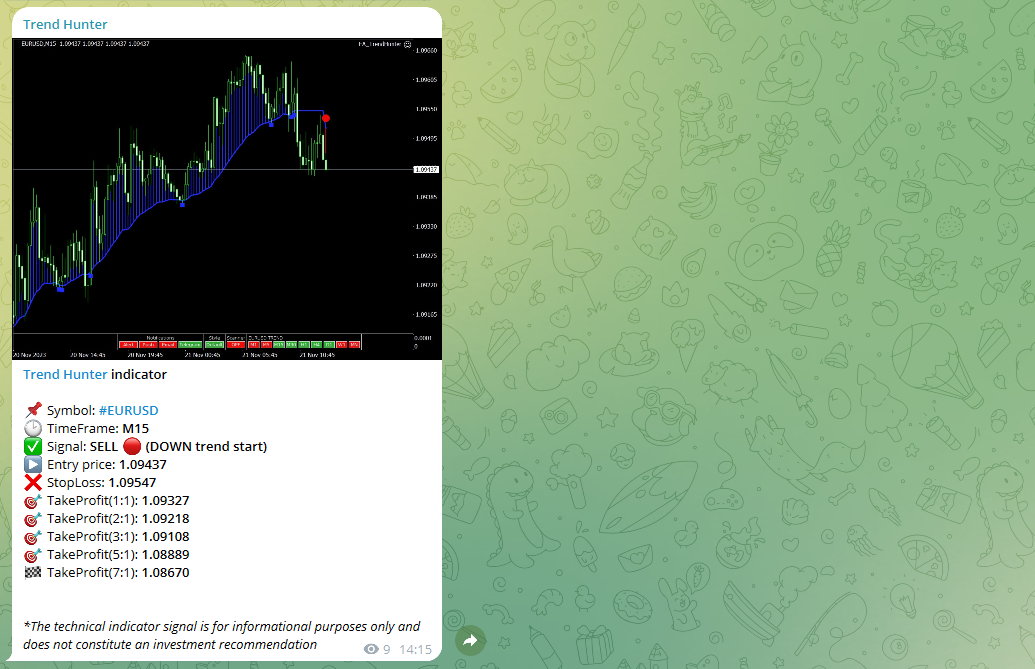
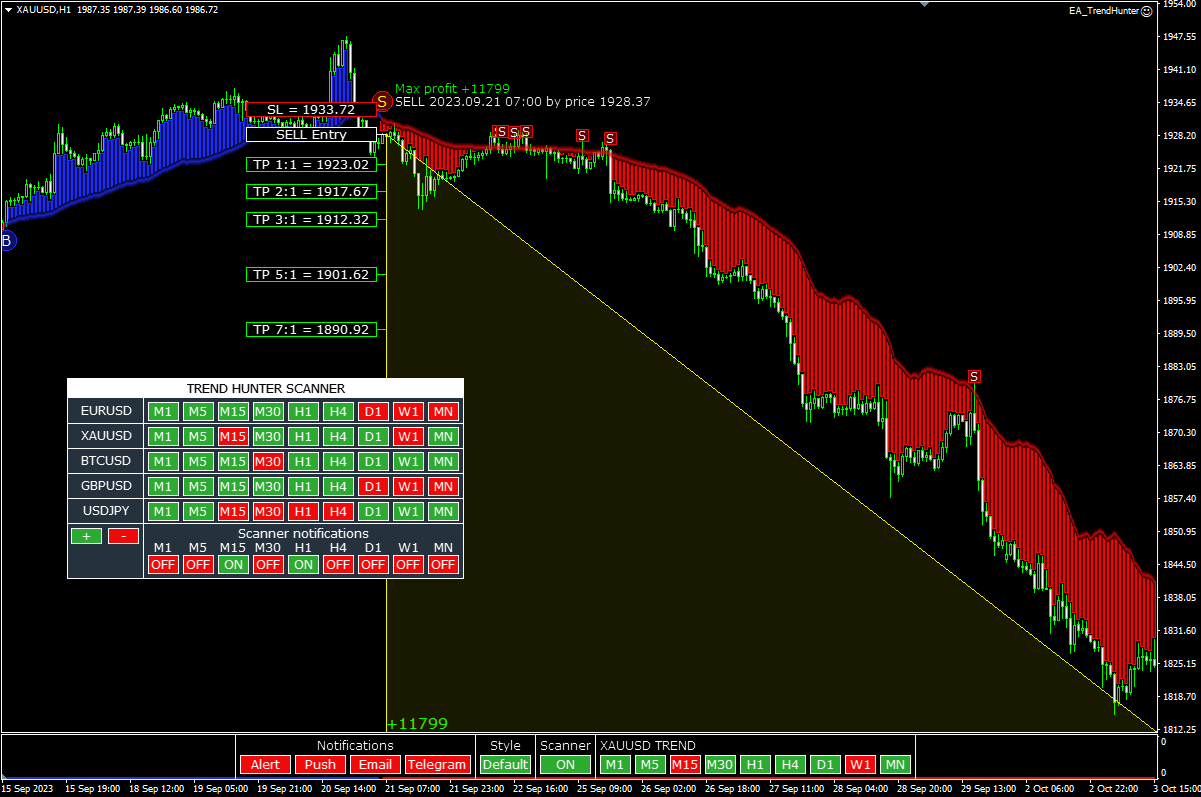
トレンドハンターは正直な指標です。 インジケーター信号の上にマウスを置くと、信号の潜在的な利益と可能なストップが表示されます。
新しい信号が表示されると、次の通知を受け取ることができます。
- アラート
- プッシュ通知
- メールによる通知
- 電報での通知
チャートのスクリーンショットも Telegram に送信されるため、取引を決定するために端末を開く必要はありません。
インジケーターシグナルは、電報チャネル https://www.mql5.com/ja/market/product/11085#!tab=comments&page=13&comment=50356403 でオンラインで表示できます。
トレンドハンタースキャナーは、他の通貨ペアや時間枠のトレンドの方向を評価するのに役立ちます。 スキャナーを使用して、他の機器のエントリー信号を受信することもできます。
取引を自動化するには、インジケーターシグナルを使用して取引するアドバイザーを使用できます
インジケーターは、チャートの下にある便利なパネルを通じて制御されます。
オプション
- Alert - 端末に通知を表示します
- EMail - 電子メールで通知を送信します
- Push - スマートフォンにプッシュ通知を送信します
- Telegram - Telegram に信号を送信する
- Style - インジケーターの描画スタイル
- Scanner - 通貨ペアスキャナーを有効にします。
- Notifications Start Time - Notifications End Time - シグナルを送信する期間
- NotificationsType - 送信するシグナルのタイプ (トレンド変化および/またはトレンド)
- ScreenWidth - Telegram のスクリーンショットの幅
- ScreenHeight - Telegram のスクリーンショットの高さ
- VisualBars - インジケーターを計算するためのバーの数。

This is solid trend indicator that filters false breakouts very well and it is also non-repaints. Another big plus is that author provides EA automation for indicator. I do recommend it.