Trendline Equalizer

1.5
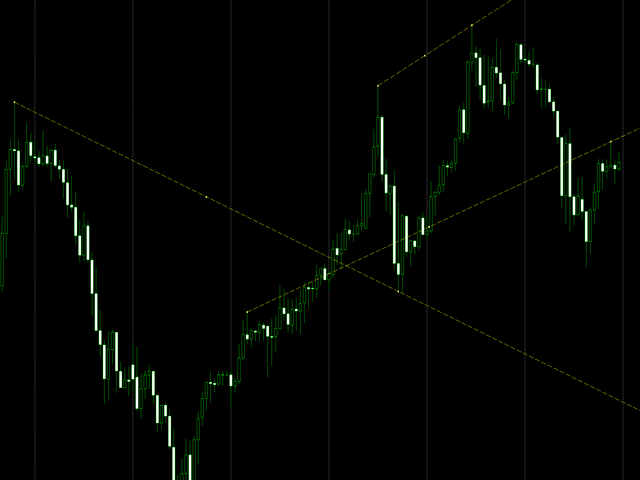
When creating, modifying and moving a trend line, two anchor points will be selected: high / low, open / close, median or weighted from the candlestick prices.

For high / low, open / close, if the anchor point is above the candlestick, the upper price will be taken, below the candlestick - the lower one. If the point is inside the candlestick, then if the first point is higher than the second, then the first one goes up, the second goes down. Conversely, if the second is higher than the first.

For the median or weighted, the position of the point above the candles, below the candles, or inside the candlestick does not matter.


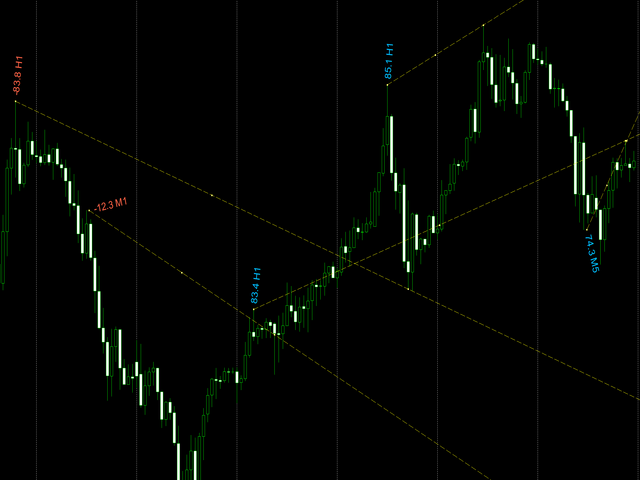
There is a setting for displaying the slope angles of the line.
おすすめのプロダクト
Prop Edge Heartbeat
Nuno Madeira Amaro Pire Costa
EA to prevent inactivity violations on prop firms. This EA will scout for your most recent trade and if it is older than the number of days defined, will enter a micro lot position size 0.01 on the pair defined. It is recommended to use a tight spread pair like EURUSD. This EA will not act as long as you have at least one trade in the last X days (defined on config). This EA will not place other trades or modify existing position.
FREE
Important Lines
Terence Gronowski
4.88 (24)
This indicator displays Pivot-Lines, preday high and low, preday close and the minimum and maximum of the previous hour. You just have to put this single indicator to the chart to have all these important lines, no need to setup many single indicators. Why certain lines are important Preday high and low : These are watched by traders who trade in a daily chart. Very often, if price climbs over or falls under a preday low/high there is an acceleration in buying/selling. It is a breakout out of a
FREE
Position Selective Close MT5
Francisco Manuel Vicente Berardo
The Position Selective Close is a multi-symbol multi-timeframe script used to close simultaneously various positions.  General Description   The Position Selective Close   possesses   three operation modes (Intersection,   Union   and All) that control the way   as   four position features (symbol, magic number,   type   and profit) are used. The modes, available through the Selection Mode input parameter, relate to the features, available through the “Select by Feature” and “Feature” input pa
FREE
Core Positioning Advanced analytical tool designed specifically for MT5, providing in-depth analysis of trading history, uncovering data insights, optimizing strategies, and enhancing profitability. Core Usage Strategy Performance Evaluation: Analyzes profitability, stability, and risk to provide an objective rating from A+ to D. Trading Pattern Discovery: Identifies high-quality assets, time periods, and profit-making habits suited to different market conditions. Risk Management Optimization: C
FREE
概要 このインジケーターは、クラシックな ドンチャンチャネル を強化したバージョンで、実践的なトレード機能を追加しています。 標準の3本線(上限、下限、中央線)に加え、 ブレイクアウト を検出し、チャート上に矢印で視覚的に表示します。また、チャートを見やすくするために、 現在のトレンド方向と逆側のラインのみを表示 します。 インジケーターの機能: 視覚的シグナル :ブレイクアウト時にカラフルな矢印を表示 自動通知 :ポップアップ、プッシュ通知、Eメール RSIフィルター :市場の相対的な強弱に基づいてシグナルを検証 カスタマイズ可能 :色、ラインの太さ、矢印コード、RSI閾値など 動作原理 ドンチャンチャネルは次のように計算します: 上限線 :直近N本のクローズ済みローソク足の最高値 下限線 :直近N本のクローズ済みローソク足の最安値 中央線 :最高値と最安値の平均値 上方ブレイクアウト は終値が上限線を超えたときに発生し、 下方ブレイクアウト は終値が下限線を下回ったときに発生します。 インジケーターは以下を行います: 3本のドンチャンラインを描画 方向転換後の最初のブレイクアウト
FREE
Statistical Arbitrage Spread Generator for Cointegration [MT5] What is Pair Trading? Pair trading is a market-neutral strategy that looks to exploit the relative price movement between two correlated assets — instead of betting on the direction of the market. The idea? When two assets that usually move together diverge beyond a statistically significant threshold, one is likely mispriced. You sell the expensive one, buy the cheap one , and profit when they converge again. It’s a statistica
FREE
One Click Trading – Auto TP SL Developer TraderLinkz Version 1.00 Category Utility What it does Adds missing TP and SL to your manual trades and pending orders Sets them once per ticket Lets you move TP and SL afterward Works on hedging and netting accounts Scans on every tick and reacts on trade events Why you want it You place faster entries You get consistent risk and exit targets You reduce fat finger errors You keep full manual control Quick start Attach the EA to any chart Keep TP and SL e
FREE
Risk Calculator EA – Utility for Precise Trade Sizing If you find this tool useful consider to  Buy me a coffee!   The Ultimate Risk Calculator is a lightweight in-chart Expert Advisor (EA) designed to help you easily and quickly calculate position size and set stop-loss / take-profit levels with full control over risk management directly on the chart. What it does? It turns manual risk decisions into fast, visual, and accurate calculations. You draw or adjust the Entry, Stop-Loss and Take-P
FREE
This MQL4 code is a   custom indicator   that draws multiple colored rectangles on a chart, spaced apart by a defined pip distance, and projected into the future. Here's a brief breakdown: Purpose: Draws several horizontal rectangles (zones) starting from a specified price. Rectangles are spaced apart vertically by a pip distance. Colors alternate between FirstColor and SecondColor . Rectangles can be drawn behind candles and optionally filled. Each rectangle extends into the future for a specif
FREE
Total Closed Trades – MT5 Indicator The Total Closed Trades indicator for MetaTrader 5 provides a quick, visual overview of your trading performance by displaying a simple and intuitive 3-value breakdown : Total Trades – The total number of closed trades. Winning Trades – Number of profitable trades. Losing Trades – Number of losing trades. Instead of digging through reports, traders can instantly monitor their historical performance with a compact and elegant pie chart-style widget. Key
FREE
The Arbitrage365 EA is a basic script for MetaTrader that implements a triangular arbitrage strategy. It identifies and exploits price discrepancies between EURUSD, GBPUSD, and EURGBP to profit from temporary market mispricing. This EA capitalizes on the law of one price by simultaneously buying and selling currency pairs. Its advantages include speed, accuracy, scalability, consistency, cost-effectiveness, contribution to market liquidity, and portfolio diversification. However, it's a basic E
FREE
The Zigzag Price Arrow indicator is an enhanced version of the classic Zigzag indicator, combining the traditional zigzag pattern with advanced visual features. It not only identifies major market turning points but also provides clear trading signals through: • Directional arrows: Displays colored arrows (green for buy, magenta for sell) indicating potential trend directions. • Price labels: Shows the exact price values at each pivot point directly on the chart. • Improved visual clarity: Make
FREE
V-Connect Tick Data Validator is a utility for MetaTrader 5. It checks each tick and rejects invalid data. Features - Checks bid and ask prices - Checks spread and time - Uses only MQL5 functions - Logs results in the Experts tab - Real-time filtering: - Negative or zero spreads - Stale timestamps (>60 seconds) - Reversed bid/ask - **<1ms overhead** — runs on low-spec VPS - **Journal audit trail** — "TICK PASSED" / "TICK REJECTED" How to Use Attach to a chart. In your EA: if (validate_tick(tick
FREE
## Version 2.50 I created this EA with the intention of making it free for everyone to use. It serves as a tool to assist in trading with money management, entering order lots according to a percentage of the account balance, and automatically setting TP/SL based on high/low prices. In Version 2.50, The Auto TP/SL feature adjusts from the Line In (entry point), and Auto price in this version only shifts the entry line to the current price. Input settings: Ato update SL/TP Line >>> In version
FREE
Value Chart Candlesticks
Flavio Javier Jarabeck
4.69 (13)
The idea of a Value Chart indicator was presented in the very good book I read back in 2020 , " Dynamic Trading Indicators: Winning with Value Charts and Price Action Profile ", from the authors Mark Helweg and David Stendahl. The idea is simple and the result is pure genius: Present candlestick Price analysis in a detrended way! HOW TO READ THIS INDICATOR Look for Overbought and Oversold levels. Of course, you will need to test the settings a lot to find the "correct" one for your approach. It
FREE
Order Book, known also as Market Book, market depth, Level 2, - is a dynamically updated table with current volumes of orders to buy and to sell specific financial instument at price levels near Bid and Ask. MetaTrader 5 provides the means for receiving market book from your broker, but in real time only, without access to its history. This expert adviser OrderBook History Playback allows you to playback the market book events on the history using files, created by OrderBook Recorder . The exper
FREE
This indicator show the candle remaining time on the chart and/or in the corner of the window. It also display notificaton (popup and push) when a new candle is formed (optional). You configure the timer on candles and at chart corner. I don't need to explain the functions because are very simple. MT4 version:  https://www.mql5.com/en/market/product/38677 Any doubt or suggestion please contact us. Enjoy! This is a free indicator, but it took hours to develop. If you want to pay me a coffee, I a
FREE
AutoLotEqualizer – Smart Position Balancing Tool AutoLotEqualizer is a precision trade management utility designed to keep your total BUY and SELL volumes balanced automatically. It detects differences between your open BUY and SELL positions and opens compensating trades — ensuring both sides stay equal in exposure. This helps grid, hedge, and basket systems maintain symmetry and control over total position risk — all while saving you time and manual effort. ️ Key Features Automatic Lot Ba
FREE
Swing Low
Teerathad Booranawisedkul
Key Features: Automatic swing detection on any timeframe (M1 to MN1) Visual arrow indicators (red for swing highs, blue for swing lows) Adjustable sensitivity with customizable swing strength parameter Dynamic arrow positioning that never overlaps with candles Instant display when changing timeframes - no delays Compatible with MT4 and MT5 platforms Clean, professional interface with minimal screen clutter Lightweight code for fast performance Customizable colors and arrow sizes Customizable S
FREE
この情報インジケーターは、アカウントの現在の状況を常に把握したい人にとって役立ちます。 VERSION MT 4 -   More useful indicators このインジケーターには、ポイント、パーセンテージ、通貨での利益、現在のペアのスプレッド、現在の時間枠でバーが閉じるまでの時間などのデータが表示されます。 チャート上に情報線を配置するには、いくつかのオプションがあります。 価格の右側 (価格の後ろにあります)。 コメントとして (グラフの左上隅に); 画面の選択した隅。 情報区切り記号を選択することもできます。 | / \ # このインジケーターは使いやすく、非常に有益です。設定で不要な情報項目を無効にすることも可能です。 設定 外観の種類     - 情報行の表示タイプ。次の 3 つのオプションがあります。 価格に従ってください     - 価格に従う。 コメントとして     - コメントとして; 画面の選択した隅に     - 画面の選択した隅にあります。 添付用グラフコーナー     - 表示タイプを選択した場合 画面の選択されたコーナーでは、この項目を使用して
FREE
Calculating the volume of orders every time you create an order is an extremely important thing in risk management Let this tool simplify your work! ----------------------------------------------------- How to use? Attach the indicator to the chart and set its parameters:  Risk size in %  or money and Risk Reward Ratio. Click on the ON button and locate the horizontal line to your would-be StopLoss level. Options: Click on the Pending/Instant button to locate the horizontal line  to your would-b
FREE
Girassol Sunflower MT5 Indicator
Saullo De Oliveira Pacheco
3.86 (7)
This is the famous Sunflower indicator for Metatrader5. This indicator marks possible tops and bottoms on price charts. The indicator identifies tops and bottoms in the asset's price history, keep in mind that the current sunflower of the last candle repaints, as it is not possible to identify a top until the market reverses and it is also not possible to identify a bottom without the market stop falling and start rising. If you are looking for a professional programmer for Metatrader5, please
FREE
This indicator is especially for the binary trading. Time frame is 1 minutes and exp time 5 or 3 minutes only. You must be use martingale 3 step. So you must put lots size is 10 % at most. You should use Mt2 trading platform to connect with my indicator to get more signal without human working. This indicator wining rate is over 80% but you may get 100% of profit by using martingale 3 step. You should use MT2 Trading Platform to connect meta trader platform and binary platform . You can get mt2
FREE
The Penta-O is a 6-point retracement harmonacci pattern which usually precedes big market movements. Penta-O patterns can expand and repaint quite a bit. To make things easier this indicator implements a twist: it waits for a donchian breakout in the right direction before signaling the trade. The end result is an otherwise repainting indicator with a very reliable trading signal. The donchian breakout period is entered as an input. [ Installation Guide | Update Guide | Troubleshooting | FAQ | A
FREE
VolumeBasedColorsBars — Free Powerful Volume Analysis for All Traders Unlock the hidden story behind every price bar! VolumeBasedColorsBars is a professional-grade, 100% FREE indicator that colorizes your chart candles based on real, adaptive volume analysis. Instantly spot surges in market activity, identify exhaustion, and catch the moves that matter. This indicator gives you:    • Dynamic color-coded bars for instant volume context    • Adaptive thresholds based on historical, session-awar
FREE
Indicator and Expert Adviser  EA Available in the comments section of this product. Download with Indicator must have indicator installed for EA to work. Mt5 indicator alerts for bollinger band and envelope extremes occurring at the same time. Buy signal alerts occur when A bullish candle has formed below both the lower bollinger band and the lower envelope  Bar must open and close below both these indicators. Sell signal occur when A bear bar is formed above the upper bollinger band and upper
FREE
Know the Candle Close Time
Benbyaanda Silvere Henri Sedric Kabore
This indicator allows to know the remaining time before the closing of the candle. It works on every timeframe. It is very usefull when your trading strategy depend of the close or the open of a specific candle. So use it like you want. Don't forget to leave a comment or a request for a EA or an indicator. Also spread it to your friends and don't hesitate to visit my profile to see others tools.
FREE
Automatic Trade Protection EA For MT5 Overview Trade Equity Guardian is a lightweight, always-on Expert Advisor that continuously monitors all open positions on your account and automatically closes any trade that breaches your predefined risk thresholds. It acts as a safety net — protecting your account from oversized positions, runaway losses, or locking in profits when targets are hit. Attach it to any chart and let it run in the background. It works alongside your other EAs and manual trades
FREE
Free automatic Fibonacci is an indicator that automatically plots a Fibonacci retracement based on the number of bars you select on the BarsToScan setting in the indicator. The Fibonacci is automatically updated in real time as new highest and lowest values appears amongst the selected bars. You can select which level values to be displayed in the indicator settings. You can also select the color of the levels thus enabling the trader to be able to attach the indicator several times with differe
FREE
このプロダクトを購入した人は以下も購入しています
Trade Assistant MT5
Evgeniy Kravchenko
4.42 (208)
取引 ごとのリスクの 計算、新規注文 の 簡単 な 設置、部分的 な 決済機能 を 持 つ 注文管理、 7 種類 のトレーリングストップなど 、便利 な 機能 を 備 えています 。 追加の資料と説明書 インストール手順   -   アプリケーションの手順   -   デモアカウント用アプリケーションの試用版 ライン機能 チャート上にオープニングライン、ストップロス、テイクプロフィットを表示します。この機能により、新規注文を簡単に設定することができ、注文を出す前にその特徴を確認することができます。   リスク計算 リスク計算機能は、設定されたリスクとストップロス注文のサイズを考慮して、新規注文のボリュームを計算します。ストップロスの大きさを自由に設定できると同時に、設定したリスクを守ることができます。 Lot calc ボタン - リスク 計算 を 有効 / 無効 にします 。 Risk フィールドでは 、必要 なリスクの 値 を 0 から 100 までのパーセンテージまたは 預金通貨 で 設定 します 。 設定」 タブで 、 リスク 計算 の 種類 を 選択 します :「 $ 通
Trade Manager EAへようこそ。これは、取引をより直感的、正確、そして効率的にするために設計された究極の リスク管理ツール です。これは単なるオーダー実行ツールではなく、包括的な取引計画、ポジション管理、リスク管理のためのソリューションです。初心者から上級者、迅速な実行を必要とするスキャルパーまで、Trade Manager EAはあらゆるニーズに対応し、為替、指数、商品、暗号通貨などさまざまな市場で柔軟に対応します。 Trade Manager EAを使用すると、複雑な計算が過去のものになります。市場を分析し、エントリーポイント、ストップロス、テイクプロフィットのレベルをチャート上のラインでマークし、リスクを設定するだけで、Trade Managerが最適なポジションサイズを即座に計算し、SLとTPをピップ、ポイント、口座通貨でリアルタイムに表示します。すべての取引が簡単かつ効果的に管理されます。 主な機能: ポジションサイズ計算機 :定義されたリスクに基づいて取引サイズを瞬時に決定します。 簡単な取引計画 :エントリー、ストップロス、テイクプロフィットを設定するためのド
Local Trade Copier EA MT5
Juvenille Emperor Limited
4.96 (130)
Local Trade Copier EA MT5 による、驚くほど高速な取引コピーを体験してください。1分で簡単にセットアップできるこの取引コピー機は、同じWindowsコンピュータまたはWindows VPS上の複数のMetaTrader端末間で取引をコピーすることができ、0.5秒未満の高速コピースピードを実現します。 初心者であろうとプロのトレーダーであろうと、 Local Trade Copier EA MT5 には、あなたの特定のニーズに合わせてカスタマイズするための幅広いオプションが用意されています。これは、利益の可能性を高めたい人にとって究極のソリューションです。 今すぐ試してみて、これが市場で最も速くて簡単なトレードコピー機である理由を理解してください。 ヒント: デモアカウントで Local Trade Copier EA MT5 デモバージョンをダウンロードして試すことができます: ここ ダウンロードした無料のデモ ファイルを MT5 >> ファイル >> データ フォルダを開く >> MQL5 >> Experts フォルダに貼り付けて、ターミナルを再起動しま
TradePanel MT5
Alfiya Fazylova
4.86 (148)
Trade Panel は、多機能の取引アシスタントです。このアプリケーションには手動取引用の 50 を超える取引機能が含まれており、ほとんどの取引操作を自動化できます。 注意、アプリケーションはストラテジー テスターでは動作しません。購入する前に、デモアカウントでデモ版をテストできます。デモ版 ここ 。 完全な手順 こちら 。 取引。 ワンクリックで取引操作を実行できます: 自動リスク計算を使用して未決の注文とポジションをオープンします。 ワンクリックで複数の注文とポジションをオープンします。 注文グリッドを開きます。 未決の注文とポジションをグループごとにクローズします。 ポジション反転 (買いを閉じて売りを開く、または売りを閉じて買いを開く)。 ポジションをロックします(買いポジションと売りポジションの量を均等にする追加のポジションをオープンします)。 ワンクリックですべてのポジションを部分的にクローズします。 すべてのポジションのテイクプロフィットとストップロスを同じ価格レベルに設定します。 すべてのポジションのストップロスをポジションの損益分岐点レベルに設定します。 注文とポ
ベータリリース Telegram to MT5 Signal Trader はまもなく正式なアルファ版をリリースします。いくつかの機能はまだ開発中で、小さな不具合に遭遇する可能性があります。問題が発生した場合はぜひご報告ください。皆さまのフィードバックがソフトウェア改善に役立ちます。 Telegram to MT5 Signal Trader は、 Telegram のチャンネルやグループからの取引シグナルを自動的に MetaTrader 5 にコピーする強力なツールです。 パブリックおよびプライベートの両方のチャネルに対応し、複数のシグナル提供元を複数のMT5口座に接続可能です。ソフトウェアは高速で安定し、すべての取引を細かく制御できます。 インターフェースは直感的で、ダッシュボードとチャートは見やすく設計されており、リアルタイムで動作状況をモニターできます。 必要環境 MQL の制限により、EA は Telegram と通信するためのデスクトップアプリが必要です。 インストーラーは公式の インストールガイド にあります。 主な機能 マルチプロバイダー: 複数の Telegram
VERIFIED TRADING RESULTS - Farmed Hedge Yield Axi Copy:  https://www.mql5.com/en/signals/2356376 - Farmed Hedge Yield Exn Copy:   https://www.mql5.com/en/signals/2356404 - Farmed Hedge Yield V Copy:  https://www.mql5.com/en/signals/2357156 Contact me via private message to receive the User Manual and Setup. * Thai Lauguage Support Available Farmed Hedge Yield Farming - Professional Pair Trading Dashboard (Manual - Hybrid - Semi/Automated EA) VERSION 3 - WILD HARVEST UPDATE Trading Approac
Tired of complex order placement and manual calculations? Trade Dashboard is your solution. With its user-friendly interface, placing orders becomes effortless, by a single click, you can open trades, set stop loss and take profit levels, manage trade lot size, and calculate risk to reward ratios, allowing you to only focus on your strategy. Say goodbye to manual calculations and streamline your trading experience with Trade Dashboard. Download  Demo Version  right now. You can find  Details of
HINN MAGIC ENTRY – the ultimate tool for entry and position management! Place orders by selecting a level directly on the chart! full description   ::  demo-version  :: 60-sec-video-description Key features: - Market, limit, and pending orders - Automatic lot size calculation - Automatic spread and commission accounting - Unlimited partitial take-profits  - Breakeven and trailing stop-loss and take-profit  functions - Invalidation leves - Intuitive, adaptive, and customizable interface - Works
MT5 to Telegram Signal Provider は、Telegramのチャット、チャンネル、またはグループに 指定された シグナルを送信することができる、完全にカスタマイズ可能な簡単なユーティリティです。これにより、あなたのアカウントは シグナルプロバイダー になります。 競合する製品とは異なり、DLLのインポートは使用していません。 [ デモ ] [ マニュアル ] [ MT4版 ] [ Discord版 ] [ Telegramチャンネル ]  New: [ Telegram To MT5 ] セットアップ ステップバイステップの ユーザーガイド が利用可能です。 Telegram APIの知識は必要ありません。必要な全ては開発者から提供されます。 主な特長 購読者に送信する注文の詳細をカスタマイズする機能 例えば、Bronze、Silver、Goldといった階層型のサブスクリプションモデルを作成できます。Goldサブスクリプションでは、すべてのシグナルが提供されます。 id、シンボル、またはコメントによって注文をフィルターできます 注文が実行されたチャート
この製品は、ニュースタイム中にすべてのエキスパートアドバイザーと手動チャートをフィルタリングするため、急激な価格変動によるマニュアルトレードのセットアップの破壊や他のエキスパートアドバイザーによって入力された取引について心配する必要はありません。この製品には、ニュースのリリース前にオープンポジションとペンディングオーダーを処理できる完全な注文管理システムも付属しています。 The News Filter  を購入すると、将来のエキスパートアドバイザーのためにビルトインのニュースフィルターに頼る必要はなく、今後はすべてのエキスパートアドバイザーをここからフィルタリングできます。 ニュース選択 ニュースソースは、Forex Factoryの経済カレンダーから取得されます。 USD、EUR、GBP、JPY、AUD、CAD、CHF、NZD、CNYなど、任意の通貨数に基づいて選択できます。 Non-Farm(NFP)、FOMC、CPIなどのキーワード識別に基づいて選択することもできます。 影響レベルによってフィルタリングするニュースを選択することができ、低、中、高の影響範囲から選択できます。
Copy Cat More Trade Copier MT5 (コピーキャット MT5) は、今日の取引課題に対応して設計されたローカルトレードコピーシステムと完全なリスク管理・実行フレームワークです。プロップファームのチャレンジから個人ポートフォリオ管理まで、堅牢な実行、資本保護、柔軟な設定、高度な取引処理の組み合わせで、あらゆる状況に適応します。 コピーシステムはマスター(送信側)とスレーブ(受信側)の両方のモードで動作し、成行注文と指値注文、取引修正、部分決済、両建て決済操作のリアルタイム同期を行います。デモ口座とライブ口座、取引ログインまたは投資家ログインの両方に対応し、EA、ターミナル、またはVPSが再起動してもパーシスタント取引メモリシステムを通じて復旧を保証します。複数のマスターとスレーブをユニークIDで同時に管理でき、ブローカー間の違いはプレフィックス/サフィックス調整またはカスタムシンボルマッピングを通じて自動的に処理されます。 マニュアル/設定  | Copy Cat More MT4 | チャンネル  特別機能: 設定が簡単 — わずか30秒で完了(ビデオをご覧
Smart Stop Manager – プロレベルの精度でストップロスを自動実行 概要 Smart Stop Manager は Smart Stop ラインナップの「実行レイヤー」であり、複数ポジションを持つトレーダーのために構築された、構造化された信頼性の高い完全自動ストップロス管理システムです。すべての保有中ポジションを継続的に監視し、Smart Stop のマーケットストラクチャー・ロジックを用いて最適なストップレベルを計算し、明確で透明性のあるルールに従ってストップを自動更新します。 単一の銘柄から複数銘柄のポートフォリオ全体まで、Smart Stop Manager は各トレードに規律、安定性、そして完全なリスク可視化をもたらします。感情的判断を排除し、手作業を大幅に削減し、すべてのストップが常に市場構造に基づいた論理的なプロセスに従うことを保証します。 ハイライト マーケットストラクチャーに基づく自動ストップ配置 • Smart Stop ロジックに基づき、各オープンポジションへ最適なストップロスを自動適用します。 ポートフォリオ全体を一目で把握 • 銘柄、方向
Trade Manager DashPlus
Henry Lyubomir Wallace
5 (13)
DashPlus は、MetaTrader 5プラットフォーム上での取引効率と効果を向上させるために設計された高度なトレード管理ツールです。リスク計算、注文管理、高度なグリッドシステム、チャートベースのツール、パフォーマンス分析など、包括的な機能を提供します。 主な機能 1. リカバリーグリッド 逆境の市場環境下で取引を管理するための平均化および柔軟なグリッドシステムを実装します。 取引回復のための戦略的なエントリーおよびエグジットポイントを可能にします。 2. スタックグリッド 強い市場の動きの中でポジションを追加することで、有利な取引での潜在的なリターンを最大化するように設計されています。 トレンド市場で利益を得られるよう、勝ち取引を拡大します。 3. 損益(P&L)ライン チャート上に直接、潜在的な利益と損失のシナリオを視覚的に表示します。 設定を調整し、P&Lラインをドラッグして、実行前にさまざまな取引結果を評価します。 4. バスケットモード 同じシンボルでの複数ポジションの管理を簡素化し、それらを単一の集約ポジションにまとめます。 平均価格に基づいて、ストップロスやテイクプ
Custom Alerts AIO:マルチマーケット監視を一括で実現 — 設定不要ですぐに使えるインテリジェントツール 概要 Custom Alerts AIO は、追加のインジケーター設定が不要で、インストール後すぐに利用できる高機能マーケットスキャナーです。FX Power、FX Volume、FX Dynamic、FX Levels、IX Power を内部にすべて統合し、主要なすべての資産クラス(為替、金属、指数、暗号資産)を一括監視できます。MetaTrader の仕様により、株式は個別のシンボルとして追加可能ですが、一般的には利用頻度は低めです。 1. なぜ Custom Alerts AIO を選ぶべきか 追加ライセンス不要 • 必要なすべての Stein Investments インジケーターが内蔵されており、すぐに使用可能です。 • チャートに表示されるグラフィックは省略されており、アラート生成に特化した構成です。 市場を広範囲にカバー • 為替、金属、暗号資産、株価指数に対応(株式は手動追加可能)。 • シンボル名を入力する必要はなく、プロパティで資産クラス
Trade copier MT5
Alfiya Fazylova
4.63 (38)
Trade Copierは、取引口座間の取引をコピーして同期するように設計された専門的なユーティリティです。 コピーは、同じコンピューターまたはvps にインストールされている、サプライヤーのアカウント/端末から受信者のアカウント/端末に行われます。 購入する前に、デモ アカウントでデモ バージョンをテストできます。 デモ版 こちら 。 詳細な説明は こちら 。 主な機能と利点: MT5ネッティングアカウントを含む、MT5> MT5、MT4> MT5、MT5> MT4のコピーをサポートします。 高いコピー速度(0.5秒未満)。 ベンダーモードと受信者モードは同じ製品内に実装されています。 チャートから直接リアルタイムでコピーを制御できる、簡単で直感的なインターフェイス。 接続が切断されたり、端末が再起動されたりしても、設定と位置が失われることはありません。 コピーするシンボルを選択できます。また、受信者のシンボルを置き換えることもできます(例:EURUSD> USDJPY)。 バックコピーをサポートします。 特定の注文のみのコピーを有効にする機能。 取引開始価格の最大差と最大遅延時間を
The product will copy all telegram signal to MT5 ( which you are member) , also it can work as remote copier.  Easy to set up, copy order instant, can work with almost signal formats, image signal,  s upport to translate other language to English Work with all type of channel or group, even channel have "Restrict Saving Content", work with  multi channel, multi MT5 Work as remote copier: with signal have ticket number, it will copy exactly via ticket number. Support to backtest signal. How to s
Ultimate Extractor - Professional Trading Analytics for MT5 *****this is the local HTML version of Ultimate Extractor. Check out Ultimate Extractor Cloud on mql5 for the Cloud version****** Ultimate Extractor transforms your MetaTrader 5 trading history into actionable insights with comprehensive analytics, interactive charts, and real-time performance tracking. What It Does Automatically analyzes your MT5 trading history across all Expert Advisors and generates detailed HTML reports with inte
Smart Stop Scanner – マルチアセット対応の市場構造型ストップロス分析システム 概要 Smart Stop Scanner は、複数の市場にわたるストップロス構造をプロフェッショナル品質で監視するために設計されたツールです。 実際の市場構造、重要なブレイクアウト、価格アクションロジックに基づいて最も意味のあるストップゾーンを自動的に検出し、 高精細(DPI対応)で見やすい統一パネルに表示します。 Forex、ゴールド、インデックス、メタル、暗号資産など幅広い市場に対応しています。 ストップレベルの算出方法 従来型のインジケーターや任意の計算式は使用していません。 代わりに、 ブレイクアウト、より高い高値、より低い安値 といった実際の市場構造イベントを検出します。 ストップレベルはこれらの構造ポイントから直接生成されるため、より自然で信頼性が高く、 実際の市場動向に即したストップ設定が可能になります。 主なハイライト • 高精度のマルチアセット対応 Forex、メタル、ゴールド、インデックス、暗号資産など、幅広い銘柄をサポートし、桁数やティックサイズを自動処
MT5のエキスパートアドバイザーリスクマネージャーは非常に重要であり、私の意見ではすべてのトレーダーにとって必要なプログラムです。 このエキスパートアドバイザーを使用すると、取引口座のリスクを管理することができます。リスクと利益の管理は、金銭的およびパーセンテージの両方で実行できます。 エキスパートアドバイザーが機能するには、それを通貨ペアチャートに添付し、許容可能なリスク値を預金通貨または現在の残高の%で設定するだけです。 [Instruction for Risk Manager parameters] アドバイザ機能 このリスクマネージャーは、リスクの管理を支援します。 -取引のために -1日あたり - 1週間 - ひと月ほど 制御することもできます 1)取引時の最大許容ロット 2)1日あたりの最大注文数 3)1日あたりの最大利益 4)エクイティを引き受ける利益を設定する それだけではありません。設定で自動設定を指定した場合、アドバイザーはデフォルトのSLとTPを設定することもできます。 アドバイザーは各イベントにアラートを添えて、注文を削除する理由を説明し
Seconds Chart — MetaTrader 5で秒足チャートを作成するユニークなツールです。 Seconds Chart を使用すると、秒単位のタイムフレームでチャートを構築でき、標準的な分足や時間足チャートでは得られない柔軟性と分析精度を実現します。例えば、 S15 は15秒足を表します。カスタムシンボルをサポートしているインジケーターやEAをすべて使用できます。標準的なチャートと同様に便利に操作できます。 標準的なツールとは異なり、 Seconds Chart は超短期のタイムフレームでも高い精度と遅延なく作業できるように設計されています。 Seconds Chartの利点 1秒から900秒 までのタイムフレームをサポート。 組み込みのティックデータベースにより、ヒストリカルデータを 瞬時にロード 。 リアルタイムでデータが更新され、 遅延やラグなし 。 複数の秒足チャートを同時に作成可能。 Seconds Chartが最適な用途 スキャルピング や高頻度取引。 正確なエントリーとエグジット。 短期タイムフレームでの取引戦略のテスト。 タイムフレームの設定 デフォルトの設
TelegramからMT5へ: 究極のシグナルコピーソリューション Telegram to MT5 を使えば、取引がシンプルになります。DLL を必要とせず、Telegram のチャンネルやチャットから MetaTrader 5 プラットフォームに取引シグナルを直接コピーできる最新ツールです。この強力なソリューションは、正確なシグナル実行、豊富なカスタマイズオプション、時間の節約、そして効率性の向上を実現します。 [ Instructions and DEMO ] 主な特徴 直接的なTelegram API統合 電話番号とセキュアコードで認証します。 ユーザーフレンドリーな EXE ブリッジを通じてチャット ID を簡単に管理できます。 複数のチャネル/チャットを追加、削除、更新して、同時に信号をコピーします。 高度なフィルターによる信号解析 例外的な単語 (例: 「レポート」、「結果」) を含む不要な信号をスキップします。 柔軟な SL および TP 形式 (価格、ピップ、ポイント) をサポートします。 価格ではなくポイントを指定するシグナルのエントリ ポイントを自動的に計算します。
Trade Manager は、リスクを自動的に計算しながら、取引を迅速に開始および終了するのに役立ちます。 過剰取引、復讐取引、感情的な取引を防止する機能が含まれています。 取引は自動的に管理され、アカウントのパフォーマンス指標はグラフで視覚化できます。 これらの機能により、このパネルはすべてのマニュアル トレーダーにとって理想的なものとなり、MetaTrader 5 プラットフォームの強化に役立ちます。多言語サポート。 MT4バージョン  |  ユーザーガイド + デモ Trade Manager はストラテジー テスターでは機能しません。 デモについてはユーザーガイドをご覧ください。 危機管理 % または $ に基づくリスクの自動調整 固定ロットサイズを使用するか、ボリュームとピップに基づいた自動ロットサイズ計算を使用するオプション RR、Pips、または価格を使用した損益分岐点ストップロス設定トレーリングストップロス設定 目標に達したときにすべての取引を自動的に終了するための 1 日あたりの最大損失 (%)。 過度のドローダウンからアカウントを保護し、オーバートレードを防ぎます
Exp COPYLOT CLIENT for MT5
Vladislav Andruschenko
3.82 (34)
MT5のトレードコピー機は、МetaТrader5プラットフォームのトレードコピー機です 。 それは間の 外国為替取引をコピーします   任意のは 、MT5 - MT5、MT4 - MT5   COPYLOT MT5版の アカウント (またはを MT4 - MT4   MT5 - MT4   COPYLOT MT4版用) 信頼できるコピー機! MT4のバージョン 完全な説明   +DEMO +PDF 購入する方法 インストールする方法     ログファイルの取得方法     テストと最適化の方法     Expforex のすべての製品 МТ4ターミナルでトレードをコピーすることもできます(   МТ4   -   МТ4、МТ5   -   МТ4   ):   MT4のCOPYLOT CLIENT このバージョンには、端末間 МТ5   -   МТ5、МТ4   -   МТ5が含まれ ます。 ディールコピー機は、2/3/10端末間でディール/ポジションをコピーするために作成されます。 デモ口座と投資口座からのコピーがサポートされています。 プログラムは、複数の端末バインデ
あなたがメンバーである任意のチャネルから(プライベートおよび制限されたものを含む)シグナルを直接あなたのMT5にコピーします。  このツールは、トレードを管理し監視するために必要な多くの機能を提供しながら、ユーザーを考慮して設計されています。 この製品は使いやすく、視覚的に魅力的なグラフィカルインターフェースで提供されています。設定をカスタマイズして、数分で製品を使用を開始できます! ユーザーガイド + デモ  | MT4版 | Discord版 デモを試してみたい場合は、ユーザーガイドにアクセスしてください。 Telegram To MT5 受信機は、ストラテジーテスターで動作しません! Telegram To MT5の特徴 複数のチャネルから一度にシグナルをコピー プライベートおよび制限されたチャネルからシグナルをコピー BotトークンまたはChat IDは必要ありません   (必要に応じて使用することができます) リスク%または固定ロットを使用して取引 特定のシンボルを除外 すべてのシグナルをコピーするか、コピーするシグナルをカスタマイズするかを選択 すべてのシグナルを認
Unlimited Trade Copier Pro MT5 is a tool to copy trade remotely to multiple MT4, MT5 and cTrader accounts at different computers/locations over internet. This is an ideal solution for you if you are a signal provider and want to copy your trades to other receivers globally on your own rules. One provider can copy trades to multiple receivers and one receiver can get trade from multiple providers as well. The provider can even set the subscription expiry for each receiver, so that receiver will n
DrawDown Limiter
Haidar Lionel Haj Ali
5 (20)
Drawdown Limiter EA You are in the right place if you were searching for Drawdown control, Drawdown limiter, Balance protection, Equity Protection or Daily Drawdown Limit related to Prop Firm, FTMO, or Funded account trading, or if you want to protect your trading account. Have you suffered from controlling your drawdown when trading funded accounts? This EA is meant for you. Prop firms usually set a rule called “Trader Daily Drawdown”, and if it is not respected, you are disqualified.  I am an
Timeless Charts
Samuel Manoel De Souza
5 (3)
Timeless Charts is an advanced charting solution designed for professional traders seeking for custom charts / custom timeframes , including seconds charts / seconds timeframe, renko charts / renko bars, cluster charts / footprint charts and advanced tools present in most of the popular platforms. Unlike traditional offline charts or simplistic custom indicators, this solution constructs fully custom bars with true timestamp accuracy , down to miliseconds, allowing for a powerful and precise tr
The Expert Advisor is a comprehensive risk manager helping users to control their trading activities. With this tool being a safeguard you can easily configure various risk parameters. When any limit is exceeded, the risk manager can force close opened positions, close other EAs, and even close the terminal to prevent emotional trading that doesn't correspond to your trading strategy. Risk Manager Settings Account Protection Check min equity limit to close all (account currency) - check the min
THIS EA IS A SEMI-AUTO EA, IT NEEDS USER INPUT. Manual & Test Version Please TEST this product before BUYING  and watch my video about it. The price of the ManHedger will increase to 250$ after 20 copies sold. Contact me for user support or bug reports or if you want the MT4 version! MT4 Version  I do not guarantee any profits or financial success using this EA. With this Expert Advisor, you can: Implement your own Zone Recovery strategy to capitalize on trending markets. Create Grid trading s
ワンクリックで取引できるトレーディングパネル。ポジションと注文の操作!チャートまたはキーボードから取引。 当社の取引パネルを使用すると、チャートから直接シングルクリックで取引を実行でき、標準の MetaTrader コントロールよりも 30 倍高速に取引操作を実行できます。 パラメータと関数の自動計算により、トレーダーにとって取引がより速く、より便利になります。 グラフィックのヒント、情報ラベル、取引取引に関する完全な情報はチャート MetaTrader にあります。 MT4のバージョン 完全な説明   +DEMO +PDF 購入する方法 インストールする方法     ログファイルの取得方法     テストと最適化の方法     Expforex のすべての製品 手動取引用の取引パネル。チャート(チャートウィンドウ)またはキーボードから取引できます。  開閉、リバース、ロックポジションと注文を処理する МetaТrader5 のメインオーダーのトレーディングコントロールパネル:売買、売却、売却、売却、売却、閉じる、削除、修正、トレーリングストップ、ストップロス、takeproft
作者のその他のプロダクト
Looks for strong price movements and draws levels upon their completion. You determine the strength of the movement yourself by specifying in the settings the number of points and the number of candles of the same color in a row in one direction. There are 2 types of building in the settings: extrenum - high / low close - close price You can also adjust the number of displayed levels and the number of candles for calculations. By default, the settings indicate 5 levels for 360 candles. That
FREE
RSI Chart Levels
Nikolay Mitrofanov
4.83 (6)
The indicator draws levels based on the overbought and oversold values ​​of the RSI indicator. The maximum values ​​are taken into account, which are equal to or exceeded certain limits. That is, for example, when the price has gone into the overbought zone, the highest price is selected from all prices in this zone for this period of time, and as soon as the indicator value returns to a value below the overbought value, the level is fixed and the calculation of new values ​​begins. The same
FREE
The indicator draws a normal chart by coloring it in colors based on prices calculated by the Heiken Ashi indicator algorithm. That is, the shape of the candles does not change. In fact, this is the same Heiken Ashi that does not distort the price chart. Then there will be a drawing of a cat, because there is nothing more to write about the indicator. .                                                       
FREE
The utility draws pivot levels based on a selection from day week month The previous candlestick of the selected timeframe is taken and the values for the levels are calculated using the following formulas: Pivot = (high + close + low) / 3 R1 = ( 2 * Pivot) - low S1 = ( 2 * Pivot) - high R2 = Pivot + (R1 -S1) R3 = high + ( 2 * (Pivot - low)) S2 = Pivot - (R1 - S1) S3 = low - ( 2 * (high - Pivot)); The style and thickness for all lines are adjusted. The colors for the R, Pivot and S lines ar
FREE
The indicator makes calculations based on data obtained from one of seven (7) moving averages and colors the chart. Simple moving averages are those that have only one important calculation parameter - the period. The shift in the indicator is not used. There is a shift trick setting, it is used to smooth the result of calculations. You can see the changes if you reduce this parameter to 1 (minimum value). shift trick must always be less than the period value. Available averages: MA Simpl
FREE
The utility automatically sets take-profit and stop-loss levels specified by the user in the parameters and moves the stop-loss line when the specified number of positive pips exceeds the trade price. Trailing stop can be disabled in the settings. That's all the functionality. ________ _____ __ ️️️️️️️️ ️️️️️️️️️️️️ ️️️️️️️️️️️️ ️️️️️
FREE
The indicator highlights in color the places on the chart where the price moves in one direction continuously from the selected number of candles. You can specify the number of points from the beginning of the movement to select only movements from this amount. It can be useful for looking for reversals or sharp impulses. I also recommend purchasing this utility to determine local weekly / monthly trends and support and resistance lines. https://www.mql5.com/en/market/product/61401
FREE
Calculates pivot levels. It paints the histogram depending on the location of prices relative to these levels. Parameter values: style - select the type of display (Histogram, Line, Arrow) price - price, has little effect on the final look, but this can be customized timeframe - select a timeframe for calculating levels. color over pivot line - color of everything above the pivot level color under pivot line - color of everything below the pivot level pivot line intersection color - the color
FREE
The utility draws reversal levels using the formulas for each of the selected number of candles: Pivot = (high + close + low) / 3 R1 = ( 2 * Pivot) - low S1 = ( 2 * Pivot) - high R2 = Pivot + (R1 -S1) R3 = high + ( 2 * (Pivot - low)) S2 = Pivot - (R1 - S1) S3 = low - ( 2 * (high - Pivot)) H = high L = low U = if the candle is bullish, then close. Otherwise - open D = if the candle is bullish, then open. Otherwise - close On any timeframe. After a new candle closes on the calculated timeframe
FREE
Draws trend lines from the high and / or low values ​​of the week. The color and thickness of the levels are customizable. All trend lines can be edited. Suitable levels of the past can be renamed and other properties changed. Levels are re-read only on the H1 timeframe once an hour. ...
FREE
The indicator draws a colored histogram from comparisons of the strengths of bulls and bears. It works like this: The values ​​of two indicators Bears and Bulls are taken, who is stronger on the candlestick is compared, the column is filled in. It's all. .
FREE
The indicator draws levels based on the overbought and oversold values ​​of the RSI indicator. All timeframes are available. Can be enabled or disabled in any combination. The most recently closed overbought levels are selected based on the bar's closing price or the level of the first RSI indicator intersection with the 50% line. For more information, you can enable the display of the most recently closed bars (candles) of selected indicators in the upper left corner. It also displays informa
The indicator averages the price using one of four methods: Simple Exponential Linear Weighted Smoothed Tema Dema None Then filters the result through the RSI values. This results in a line drawn that approximates the trend change in the RSI peak zones. The last three screenshots show two indicators on a single chart with RSI high and low prices and the rest of the default parameters. The up color (red) for the high prices is set to None, while the down color (blue) for the low prices is set to
The indicator uses moving average reversal values ​​on all selected timeframes to plot levels where the moving average has reversed, which can be considered support or resistance levels, as well as trend change signals on the timeframe of the newly drawn line. The moving average is passed through the RSI indicator. The line colors are customizable and, by default, indicate the following: 1. Purple - the moving average has changed direction downwards. 2. Gold - the moving average has changed di
フィルタ:
faithdefender
1736
faithdefender 2022.01.18 14:37 
 

It is hard to be critical of an indicator that is free, but it still should be reviewed. The indicator requires the user add a trendline to the chart and it applies (like a magnet) to the area it deems worthy. . But it does not seem to help when looking for a critical area. It bounces around too many places in the general area. I will continue to experiment with it and if things change, I will add new comments.

Nikolay Mitrofanov
17609
開発者からの返信 Nikolay Mitrofanov 2022.01.18 14:51
This is not an indicator. This is a help utility.
There are no "common or critical areas". Magnetization occurs to the candle, over which the mouse pointer is located.
This is obvious and directly described in the description.
If it worked by area and adjusted, as you probably expected, then it would be described in the description .. I won't remake anything.
topline8000
1144
topline8000 2021.10.19 13:04 
 

does not work

Nikolay Mitrofanov
17609
開発者からの返信 Nikolay Mitrofanov 2021.10.19 21:09
レビューに返信