Volume Force MT5
-
Indicatori
-
-
Versione:
6.44
-
Aggiornato:
1 aprile 2026
-
Attivazioni:
20
**V-FORCE PRO - L'INDICATORE DI VOLUME AVANZATO PER METATRADER 5**
**Scopri la Potenza del Volume Reale con V-Force Pro - La Rivoluzione nell'Analisi di Mercato!**
**Smetti di Operare al Buio! Visualizza la Forza dei Grandi Player in Tempo Reale.**
**Il Problema che Ogni Trader Affronta:**
Ti sei mai chiesto perché alcuni movimenti di mercato falliscono anche quando tutti gli indicatori tecnici puntano nella stessa direzione? La risposta sta nel **VOLUME REALE** - il pezzo più importante del puzzle che la maggior parte dei trader ignora!
**Presentiamo V-Force Pro 5.3 - Speed Edition**
L'unico indicatore di volume che va oltre il semplice istogramma, rivelando la **VERA INTENSITÀ** dietro ogni movimento!
**CARATTERISTICHE ESCLUSIVE:**
**1. ANALISI DI DOMINANZA MULTILIVELLO**
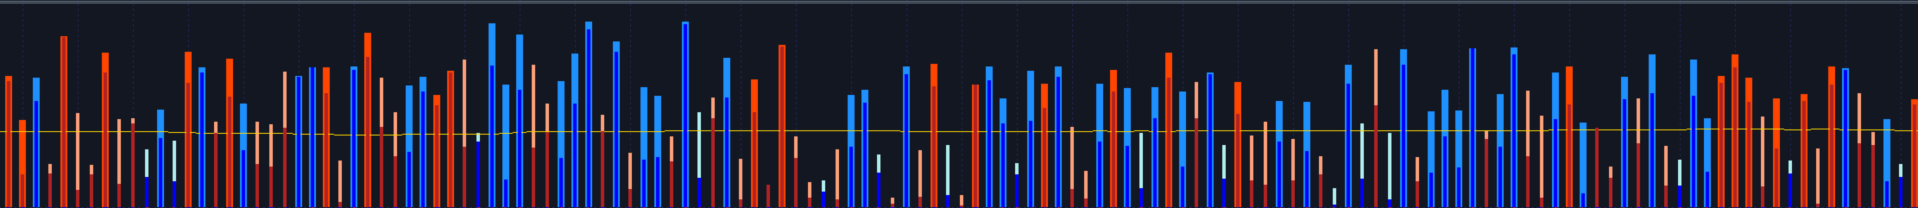
* **Toro Forte (Blu Scuro):** Volume **ACQUISTI** dominante con forte convinzione
* **Toro Debole (Blu Chiaro):** Pressione d'acquisto, ma con esitazione
* **Orso Forte (Rosso Scuro):** Volume **VENDITE** aggressivo
* **Orso Debole (Rosso Chiaro):** Pressione di vendita debole
* **Assorbimento/Neutro (Grigio):** Conflitto tra tori e orsi - **ALLERTA DI INVERSIONE!**
**2. SISTEMA DI VELOCITÀ (SPEED EDITION)**
* Rilevamento dell'**ACCELERAZIONE DEL VOLUME** in tempo reale
* Identifica i momenti di **INGRESSO AGGRESSIVO** dei grandi player
* Filtra i movimenti "vuoti" senza volume reale dietro
**3. AVVISI INTELLIGENTI PERSONALIZZABILI**
* *Scegli come vuoi essere avvisato:*
* **Suono + Pop-up:** Non perdere nessuna opportunità
* **Solo Suono:** Per chi opera su più grafici
* **Solo Pop-up:** Per ambienti silenziosi
* **Disabilitato:** Per analisi visiva pura
**4. MEDIANA DEL VOLUME DINAMICA**
* Linea che mostra il volume medio degli ultimi X periodi
* Avviso automatico quando il volume supera il 200% della mediana (regolabile)
* Filtra il rumore ed evidenzia i movimenti significativi
**5. SISTEMA FADE-OUT PROFESSIONALE**
* Mantiene la "memoria" della forza del volume dopo movimenti forti
* Evita falsi segnali nelle fasi di consolidamento
* Rivela la persistenza della pressione rialzista/ribassista
**COME V-FORCE PRO TRASFORMA LA TUA OPERATIVITÀ:**
**Per i Day Trader:**
* Ingresso preciso sui breakout **CONFERMATI** dal volume
* Evita i "falsi breakout" - il volume non mente!
* Identifica l'esaurimento dei movimenti dal cambiamento del profilo di volume
**Per gli Swing Trader:**
* Conferma delle tendenze dall'aumento progressivo del volume
* Rilevamento precoce dei cambiamenti nella forza del trend
* Identifica la distribuzione/accumulo su larga scala
**Per gli Scalper:**
* Velocità di esecuzione ottimizzata
* Avvisi sonori per movimenti bruschi
* Visualizzazione chiara anche sui timeframe bassi
**PERSONALIZZAZIONE TOTALE:**
Regola **TUTTO** secondo il tuo stile: colori, spessori, livelli di avviso, sensibilità e molto altro.
**CONFRONTO CON GLI INDICATORI TRADIZIONALI:**
| Caratteristica | Volume Comune | VWAP | V-Force Pro |
|------------------------|----------------|-----------|-------------|
| Forza Relativa | No | Parziale | **SÌ** |
| Avvisi Personalizzabili| No | No | **SÌ** |
| Rilevamento Velocità | No | No | **SÌ** |
| Sistema Fade-Out | No | No | **SÌ** |
| Analisi Multilivello | No | No | **SÌ** |
**CASI D'USO PRATICI:**
**Scenario 1: Rottura di una Resistenza**
* Volume comune: Mostra aumento, ma non l'**INTENSITÀ**
* V-Force Pro: Rivela se è "Toro Forte" (rottura valida) o "Toro Debole" (possibile fallimento)
**Scenario 2: Test di un Supporto**
* Volume comune: Volume alto durante il test
* V-Force Pro: Mostra se è "Orso Forte" (rottura probabile) o "Assorbimento" (inversione imminente)
**Scenario 3: Accelerazione di un Trend**
* Volume comune: Volume crescente
* V-Force Pro: Attiva "Velocità Toro/Orso" - ingresso dei grandi player confermato!
---
**CONSIGLIO PROFESSIONALE:**
Combina V-Force Pro con:
* **Supporti/Resistenze:** Volume forte a questi livelli = alta probabilità
* **Medie mobili:** Volume che conferma gli incroci = setup più affidabile
* **Pattern di candele:** Volume che convalida i pattern = ingresso di qualità