VForce Pro
- 지표
- 버전: 6.44
- 업데이트됨: 1 4월 2026
- 활성화: 20
**V-FORCE PRO - MetaTrader 5를 위한 고급 거래량 지표**
**V-Force Pro로 실제 거래량의 힘을 발견하세요 - 시장 분석의 혁명!**
**더 이상 어둠 속에서 거래하지 마세요! 실시간으로 대형 투자자들의 힘을 시각화하세요.**
**모든 트레이더가 직면하는 문제:**
모든 기술적 지표가 같은 방향을 가리키는데도 왜 일부 시장 움직임은 실패할까요? 그 해답은 **실제 거래량**에 있습니다 - 대부분의 트레이더들이 간과하는 퍼즐의 가장 중요한 조각입니다!
**V-Force Pro 5.3 - Speed Edition을 소개합니다**
단순한 히스토그램을 넘어서, 각 움직임 뒤에 숨겨진 **진정한 강도**를 드러내는 유일무이한 거래량 지표입니다!
**독점적인 기능:**
**1. 다단계 지배력 분석**
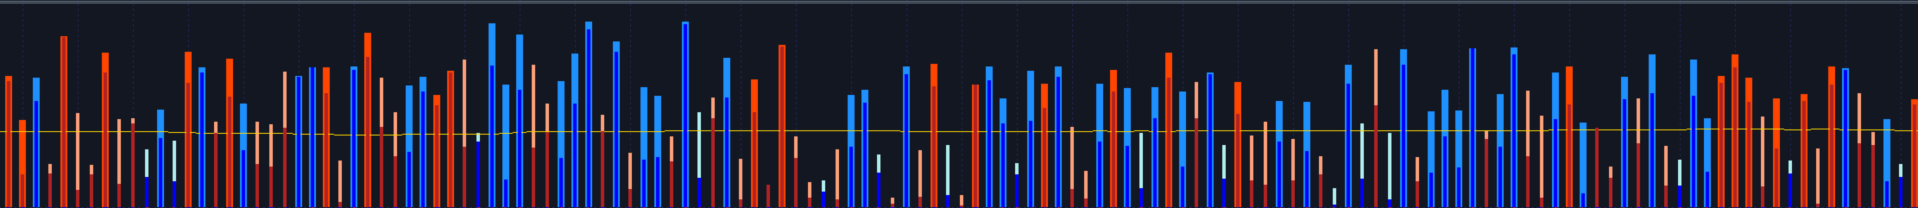
* **강력한 강세(진한 파랑):** 강한 확신을 가진 **매수** 거래량이 지배적
* **약한 강세(연한 파랑):** 매수 압력은 있지만 주저함이 보임
* **강력한 약세(진한 빨강):** 공격적인 **매도** 거래량
* **약한 약세(연한 빨강):** 약한 매도 압력
* **흡수/중립(회색):** 강세와 약세의 갈등 - **반전 경고 신호!**
**2. 스피드 에디션 시스템**
* 실시간 **거래량 가속도** 감지
* 대형 투자자들의 **공격적인 진입** 시점 식별
* 실제 거래량이 없는 "빈" 움직임을 필터링
**3. 맞춤형 지능형 알림**
* *원하는 알림 방법을 선택하세요:*
* **소리 + 팝업:** 어떤 기회도 놓치지 마세요
* **소리만:** 여러 차트를 운영하는 트레이더에게 적합
* **팝업만:** 조용한 환경에 적합
* **비활성화:** 순수 시각적 분석용
**4. 동적 거래량 중앙값**
* 최근 X 기간의 평균 거래량을 보여주는 선
* 거래량이 중앙값을 200% 초과하면 자동 알림(조정 가능)
* 노이즈를 걸러내고 중요한 움직임을 강조
**5. 전문적인 페이드아웃 시스템**
* 강한 움직임 후에도 거래량 강도의 "기억"을 유지
* 조정국면에서의 잘못된 신호 방지
* 매수/매도 압력의 지속성을 드러냄
**V-FORCE PRO가 여러분의 거래를 바꾸는 방법:**
**데이트레이더를 위해:**
* 거래량으로 **확인된** 돌파에서의 정밀한 진입
* "가짜 돌파" 회피 - 거래량은 거짓말을 하지 않습니다!
* 거래량 프로필 변화를 통한 움직임 고갈 식별
**스윙트레이더를 위해:**
* 점진적인 거래량 증가를 통한 추세 확인
* 추세 강도 변화의 조기 발견
* 대규모 분배/축적 단계 식별
**스캘퍼를 위해:**
* 최적화된 실행 속도
* 급격한 움직임에 대한 소리 알림
* 낮은 타임프레임에서도 명확한 시각화
**완전한 맞춤화:**
색상, 두께, 알림 수준, 민감도 등 **모든 것**을 여러분의 스타일에 맞게 조정할 수 있습니다.
**기존 지표와의 벤치마크:**
| 기능 | 일반 거래량 | VWAP | V-Force Pro |
|------|------------|------|-------------|
| 상대적 강도 | 아니오 | 부분적 | **예** |
| 맞춤형 알림 | 아니오 | 아니오 | **예** |
| 속도 감지 | 아니오 | 아니오 | **예** |
| 페이드아웃 시스템 | 아니오 | 아니오 | **예** |
| 다단계 분석 | 아니오 | 아니오 | **예** |
**실전 사용 사례:**
**시나리오 1: 저항선 돌파**
* 일반 거래량: 증가는 보이지만 **강도**는 보이지 않음
* V-Force Pro: "강력한 강세"(유효한 돌파)인지 "약한 강세"(실패 가능성)인지 드러냄
**시나리오 2: 지지선 테스트**
* 일반 거래량: 테스트 시 높은 거래량
* V-Force Pro: "강력한 약세"(파손 가능성 높음)인지 "흡수"(임박한 반전)인지 보여줌
**시나리오 3: 추세 가속화**
* 일반 거래량: 거래량 증가
* V-Force Pro: "강세/약세 스피드" 활성화 - 대형 투자자들의 진입이 확인됨!
---
**프로 팁:**
V-Force Pro를 다음과 결합하여 사용하세요:
* **지지/저항선:** 이러한 수준에서의 강한 거래량 = 높은 확률
* **이동 평균선:** 교차를 확인하는 거래량 = 더 신뢰할 수 있는 설정
* **캔들 패턴:** 패턴을 검증하는 거래량 = 고품질 진입