Pointer Trend Switch

Pointer Trend Switch — precision trend reversal indicator

Pointer Trend Switch is a high-precision arrow indicator designed to detect key moments of trend reversal based on asymmetric price behavior within a selected range of bars. It identifies localized price impulses by analyzing how far price deviates from the opening level, helping traders find accurate entry points before a trend visibly shifts.

This indicator is ideal for scalping, intraday strategies, and swing trading, and performs equally well in both trending and ranging market conditions.

Key Features

  • Accurate buy and sell arrows generated in real-time;

  • Detects hidden price impulses using deviation from open price;

  • Customizable logic for trend analysis based on historical or predictive data;

  • Compatible with all symbols and timeframes;

  • Optimized for MT5 architecture with fast execution and low resource usage;

  • Supports neural network mode for forward-looking training datasets.

How It Works

Pointer Trend Switch operates by analyzing how far the price deviates from the opening of the current bar, within a given historical window ( PeriodBars ). It compares the highest highs and lowest lows from this window against the current open price to detect price imbalance.

  • If the low falls significantly below the open — a sell signal is generated.

  • If the high rises significantly above the open — a buy signal is generated.

A multiplier coefficient ( Changes ) controls how strong the imbalance must be to trigger a signal, ensuring reliability in noisy market conditions.

The indicator also supports a predictive calculation mode ( OnIdealSiglan ) where signal logic is inverted to look into the future window — making it highly valuable for algorithmic model training and machine learning purposes.

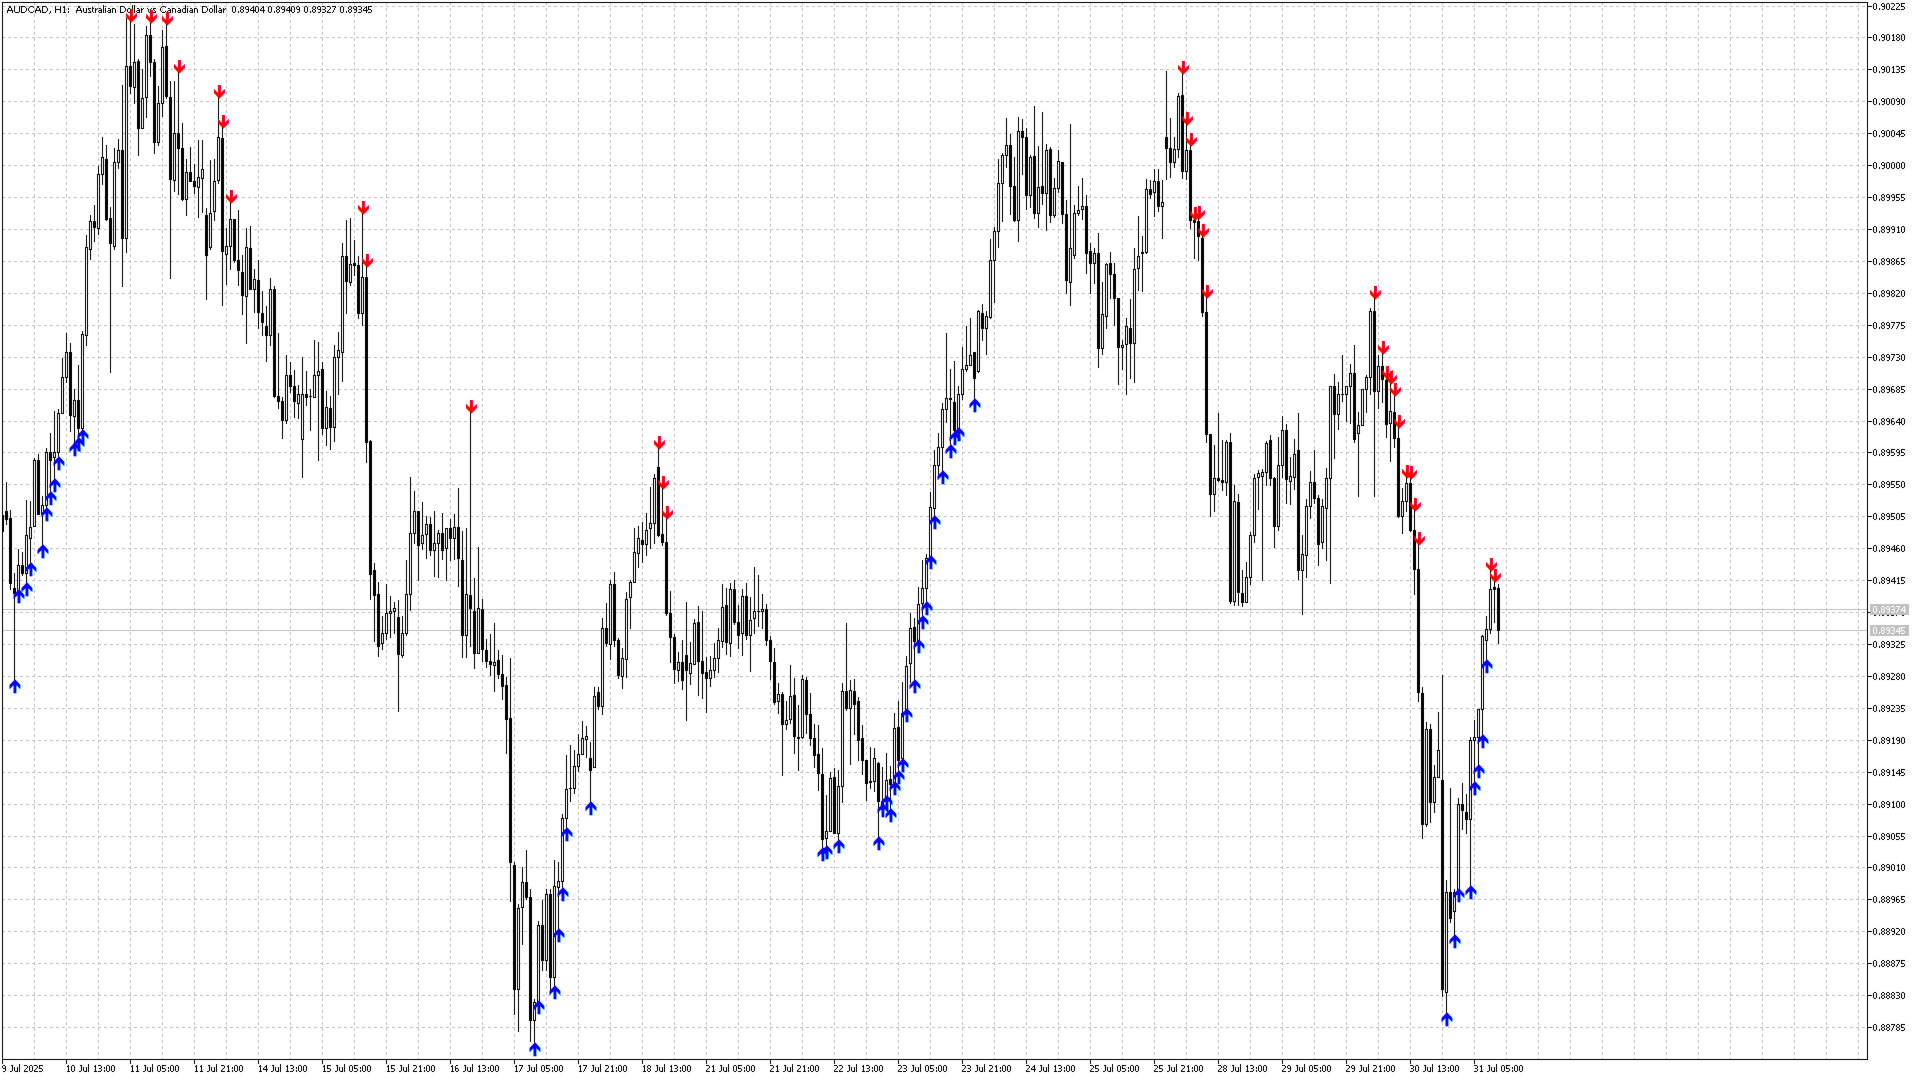
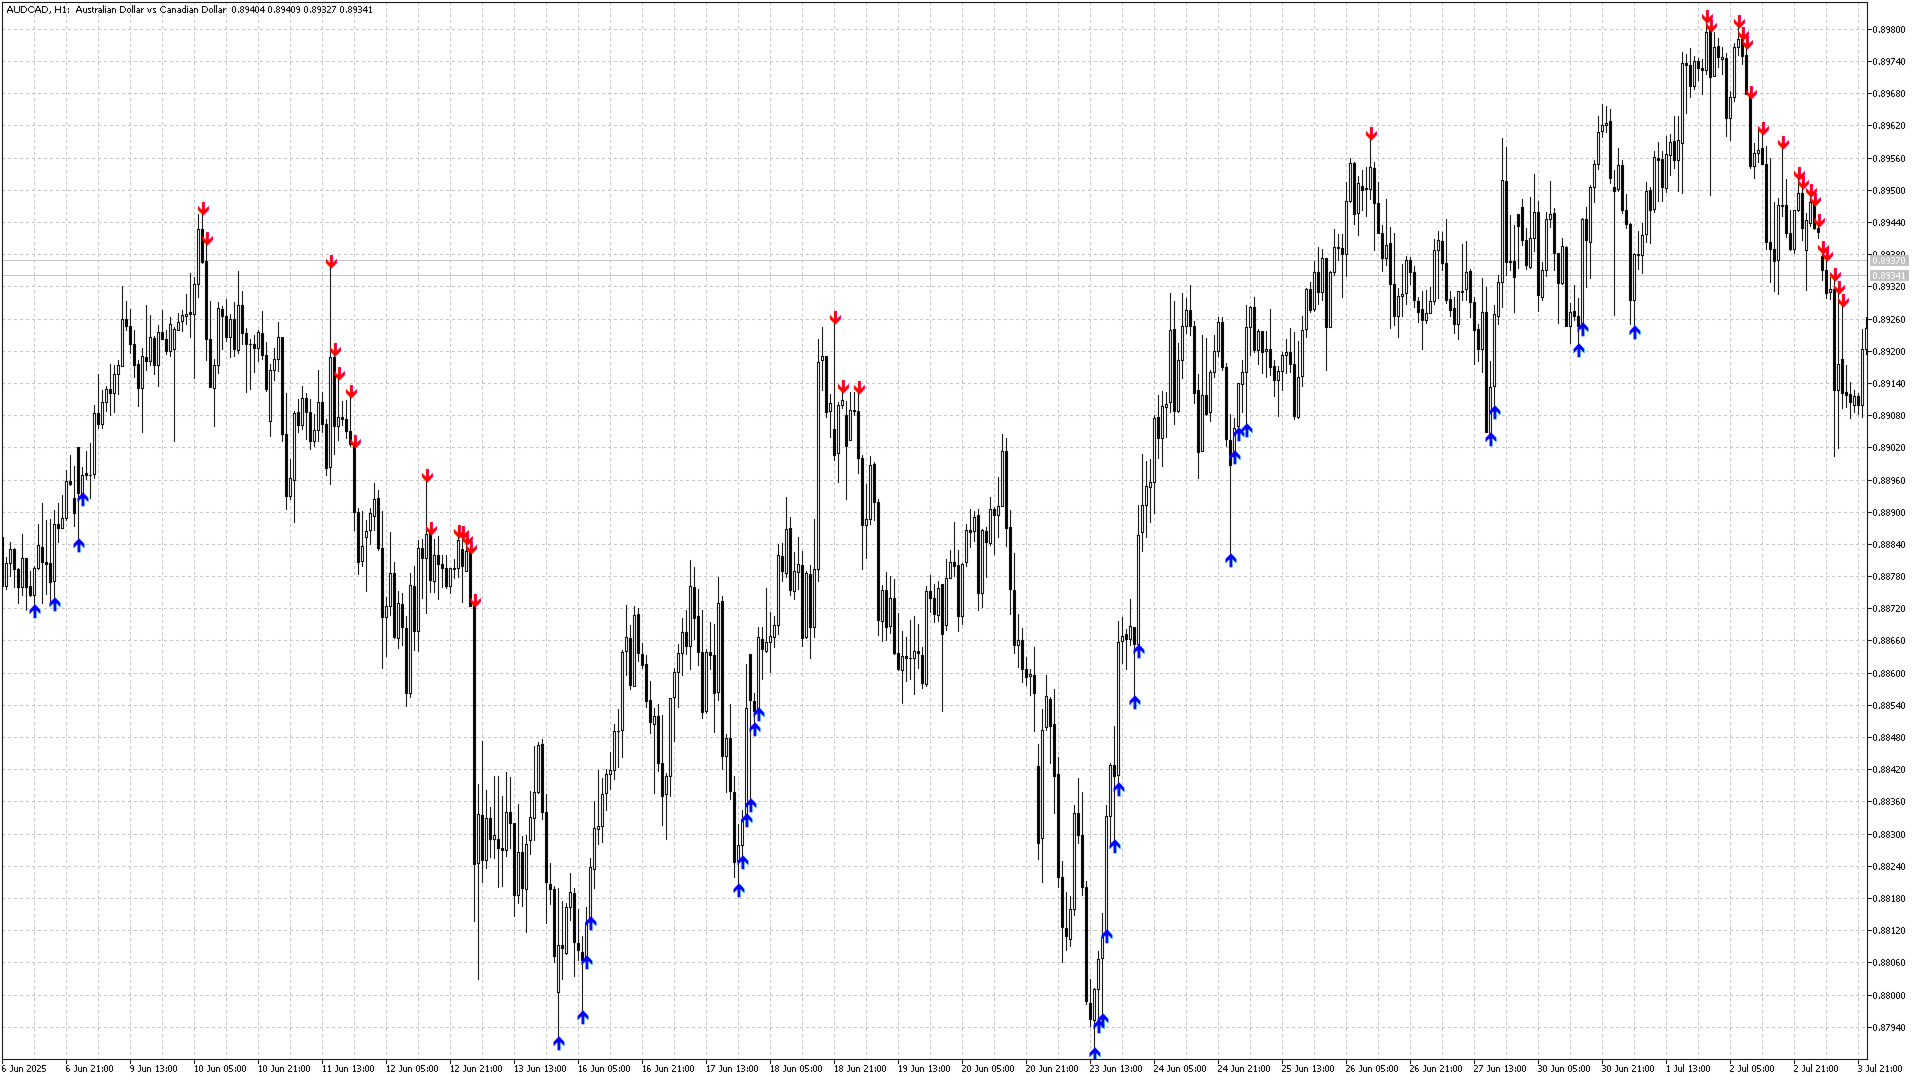
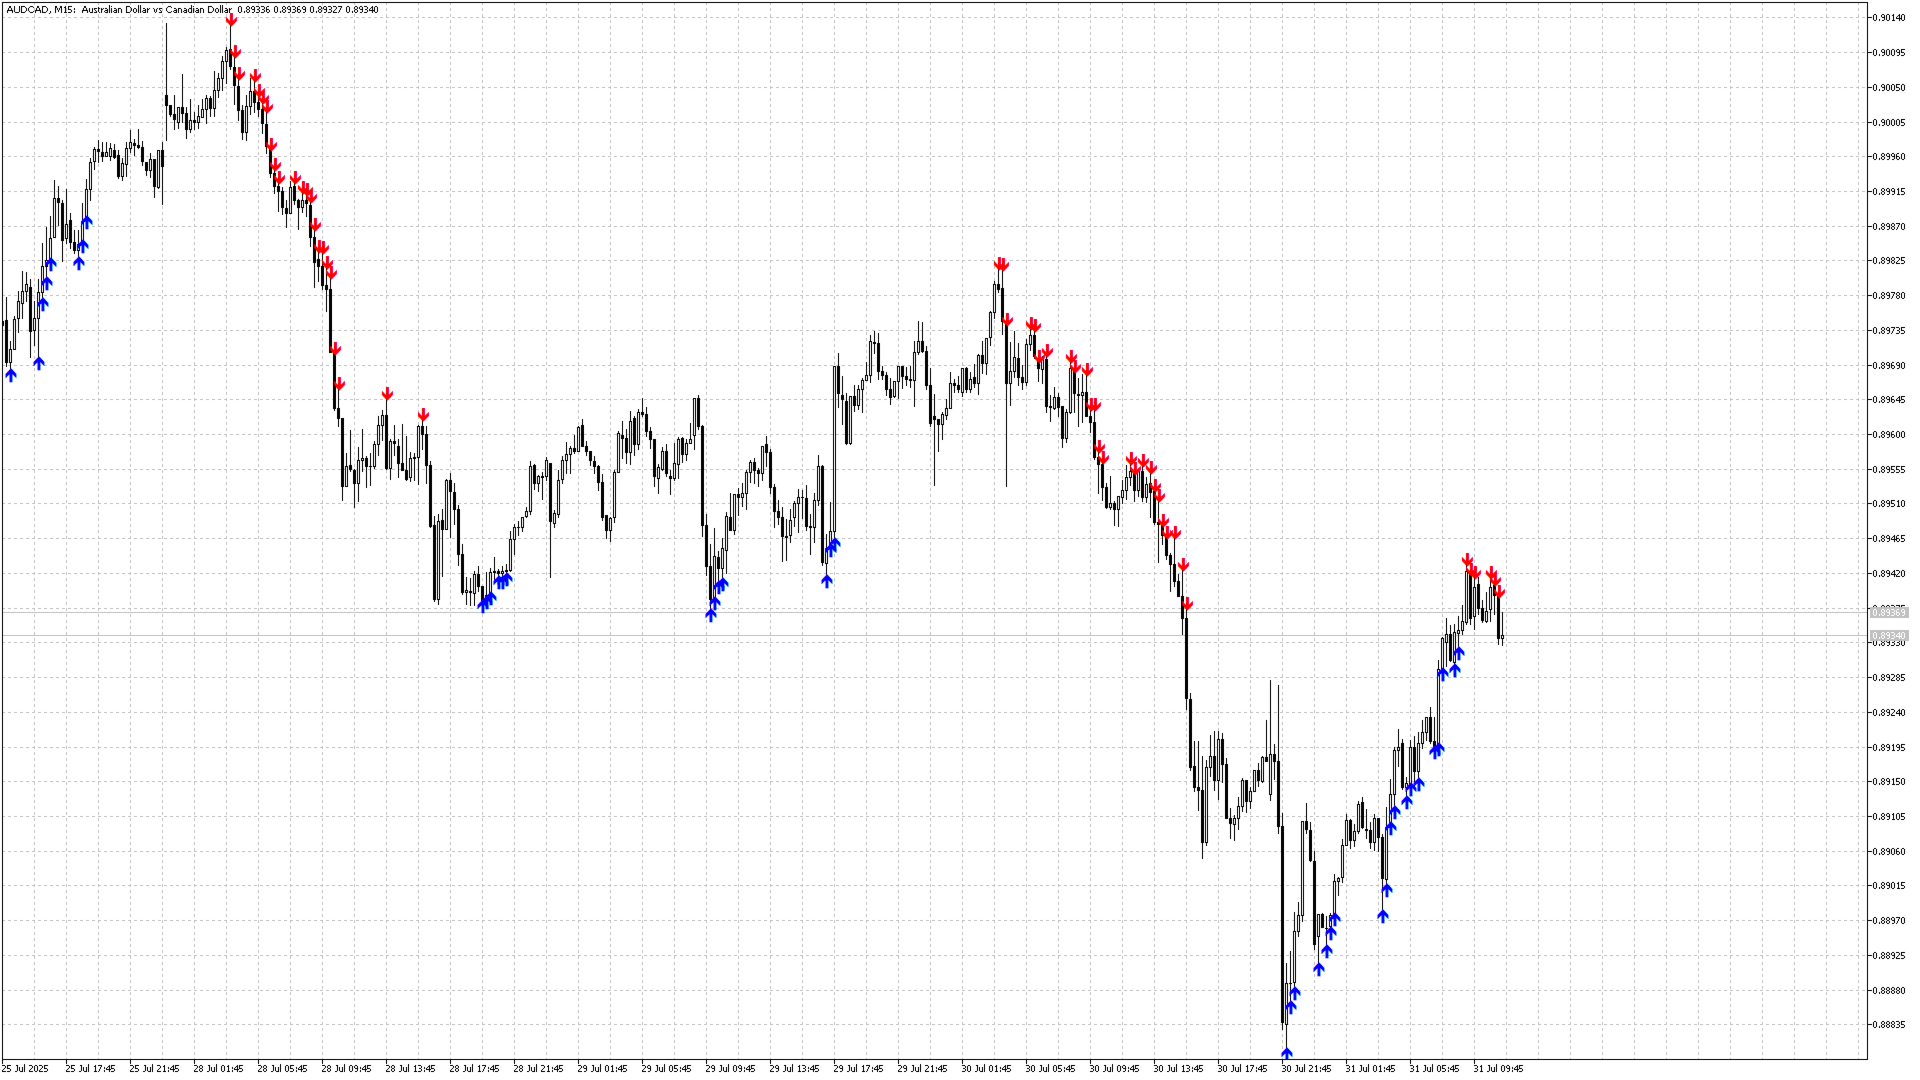
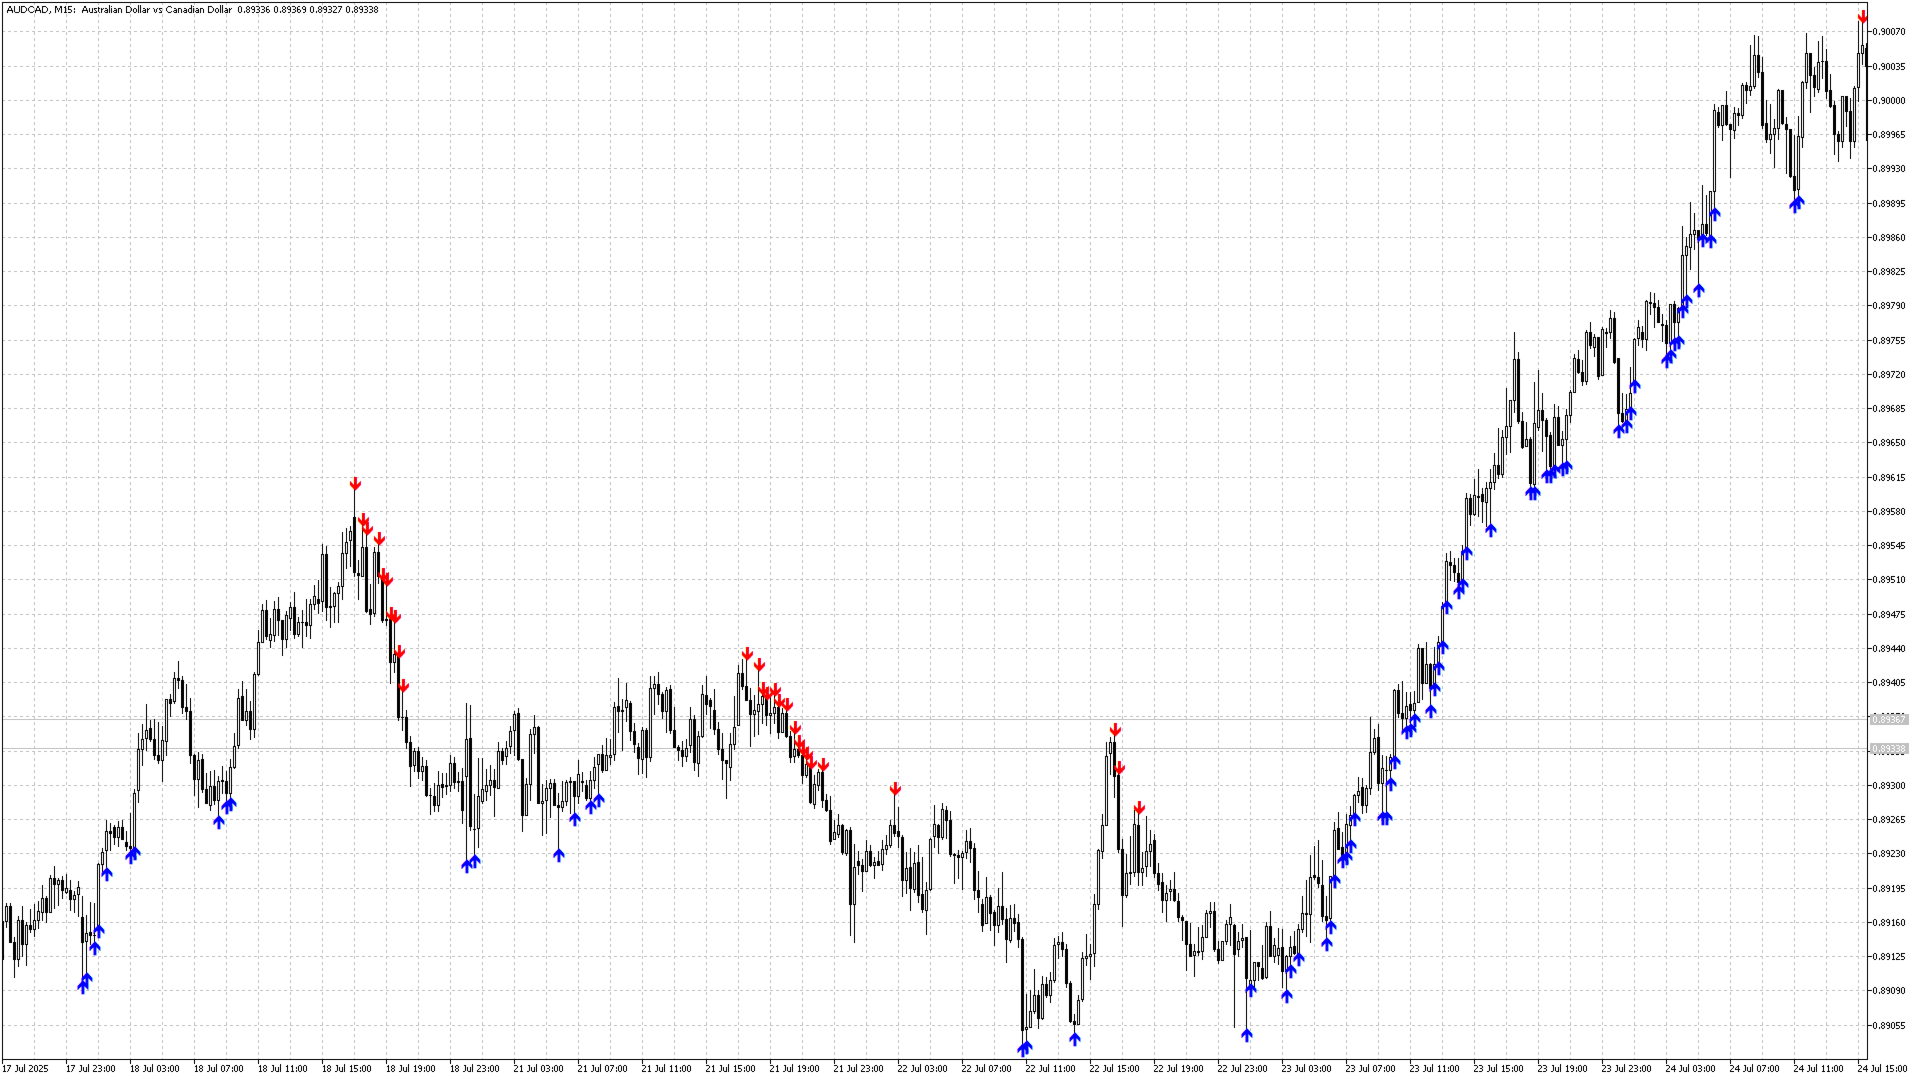
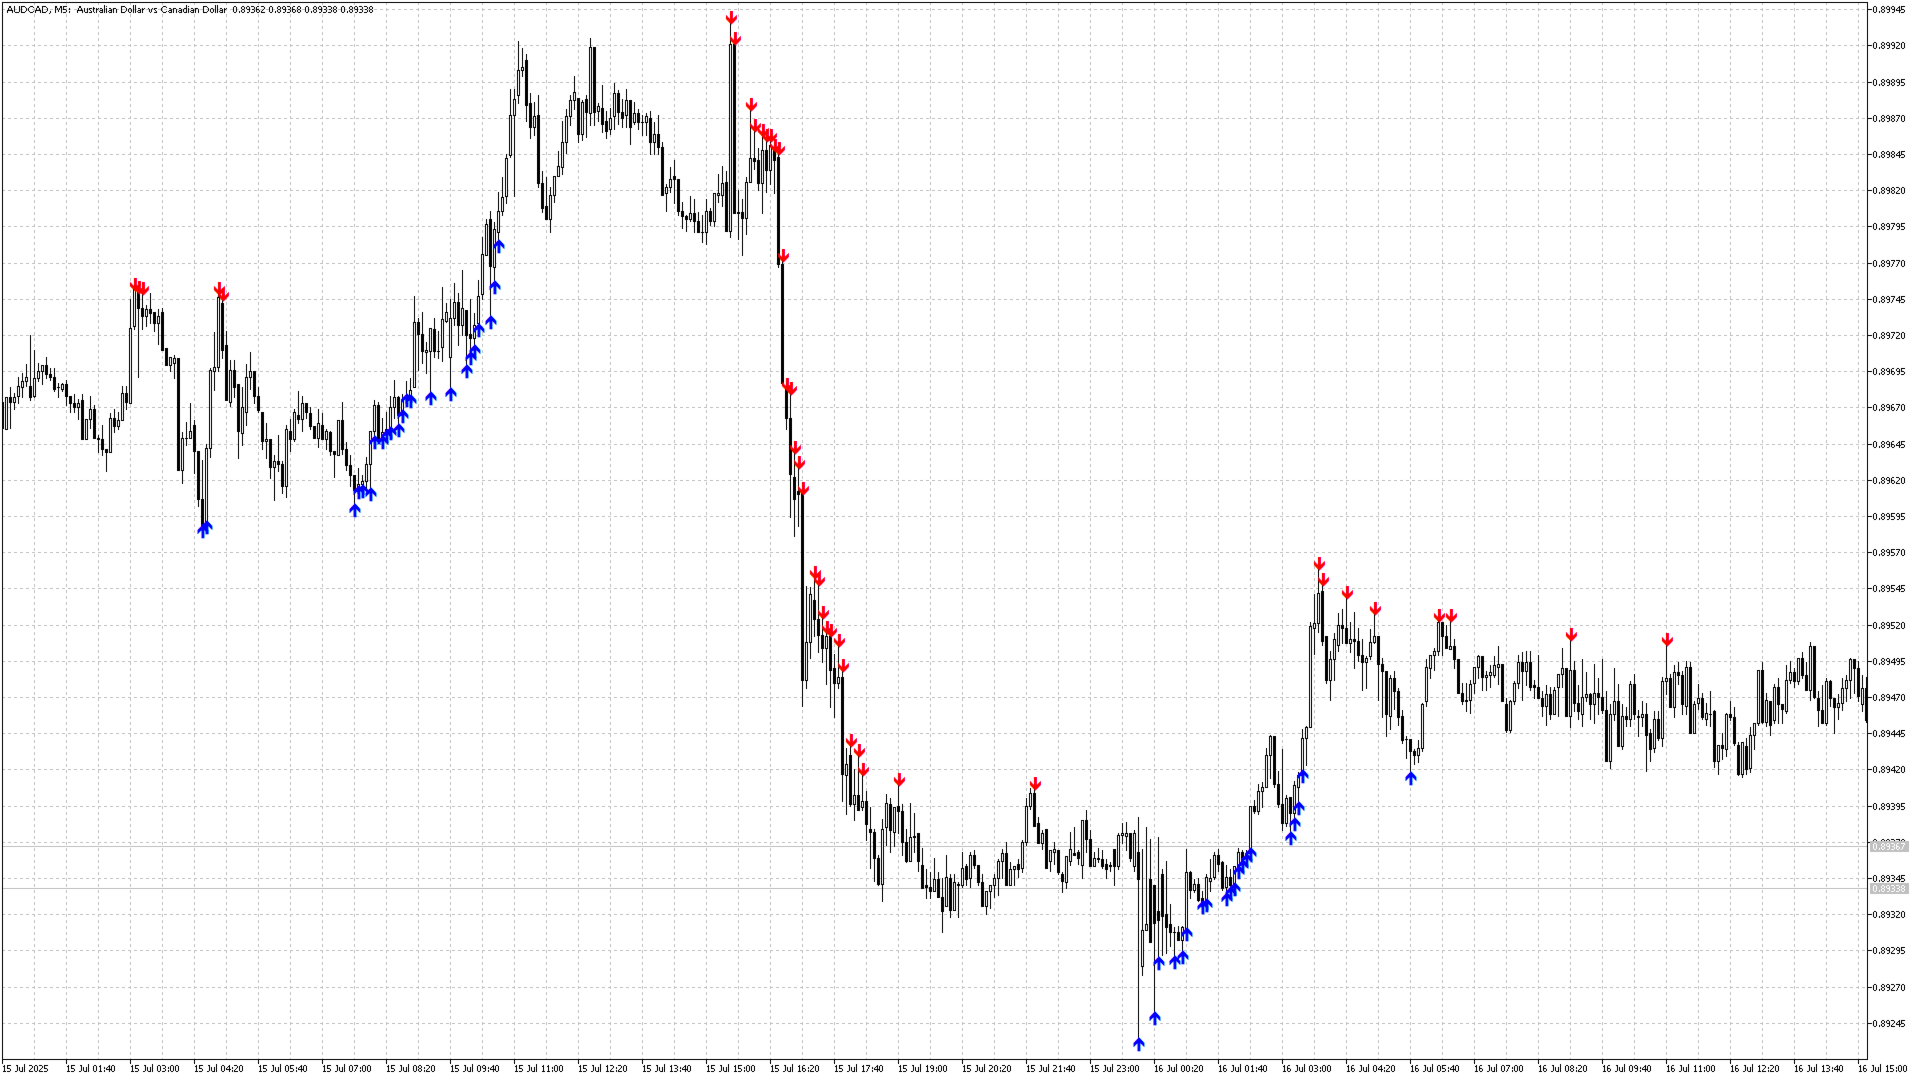
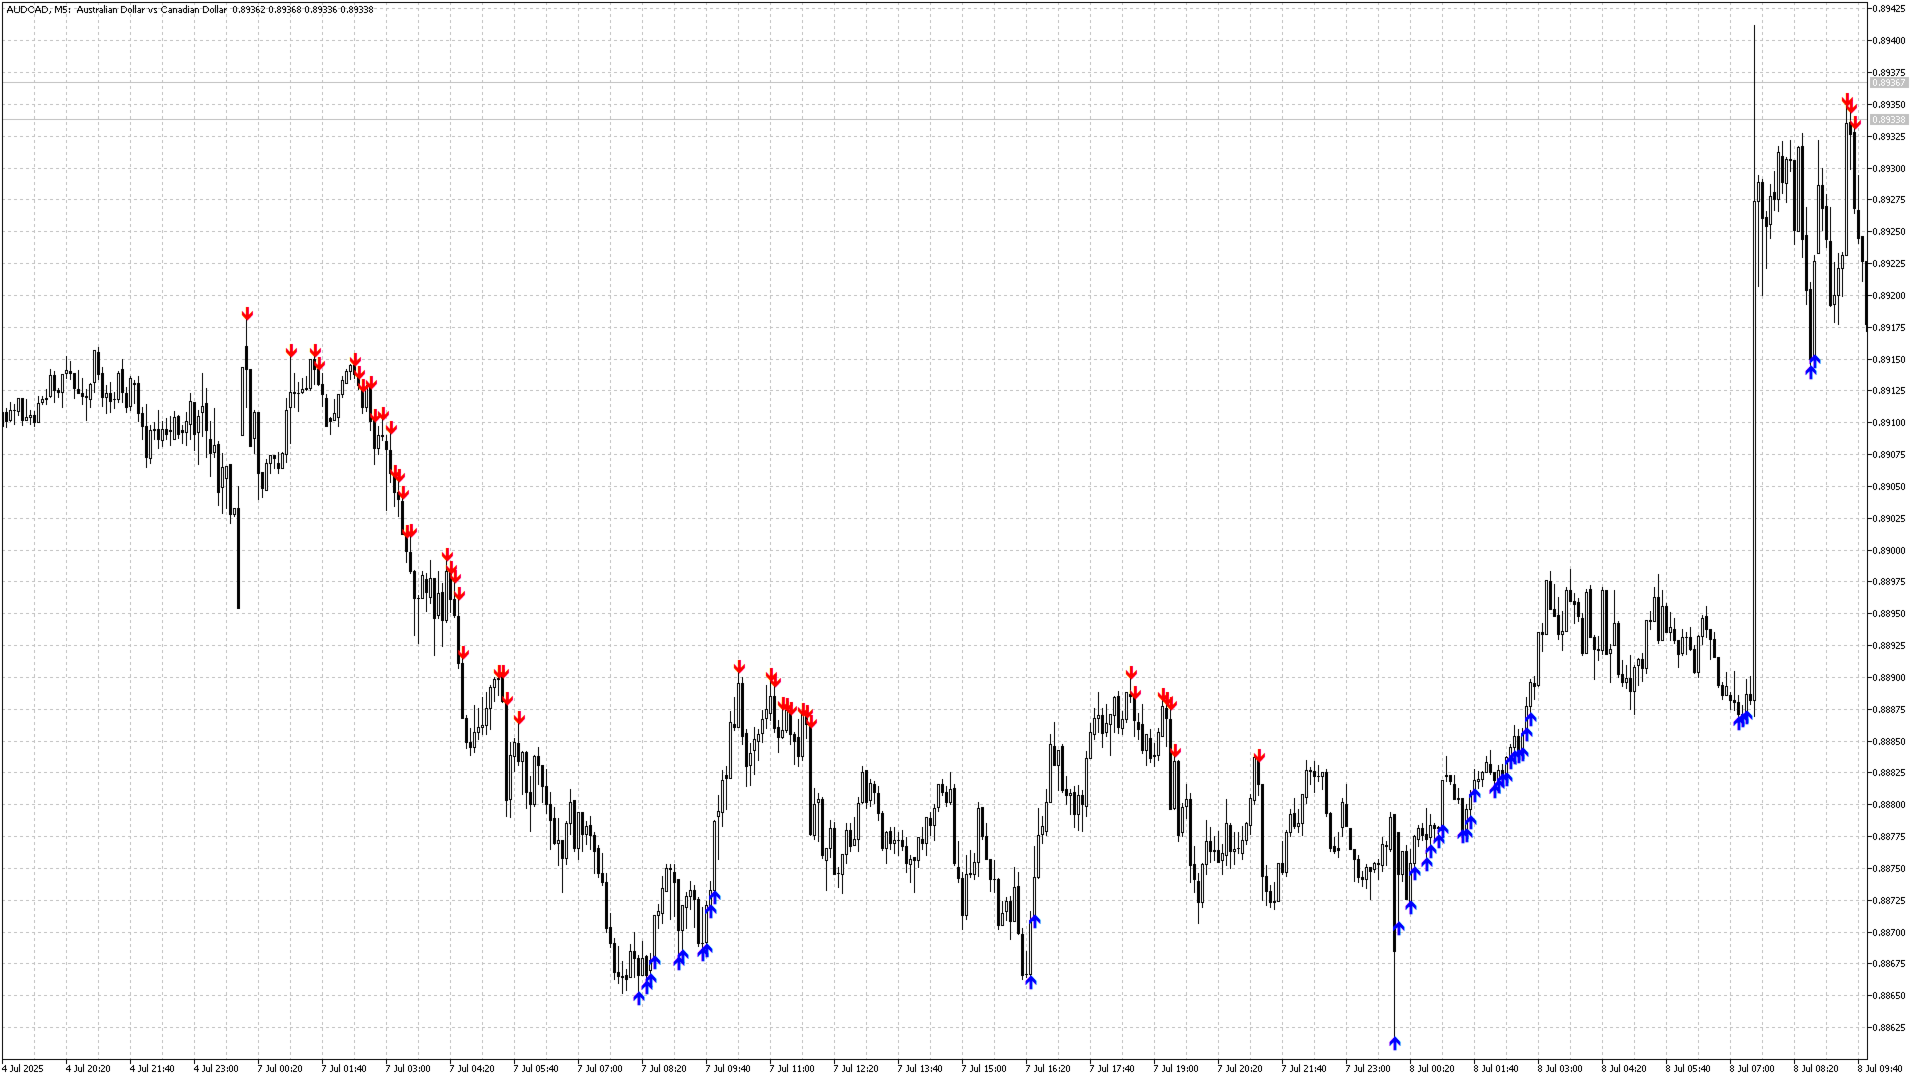
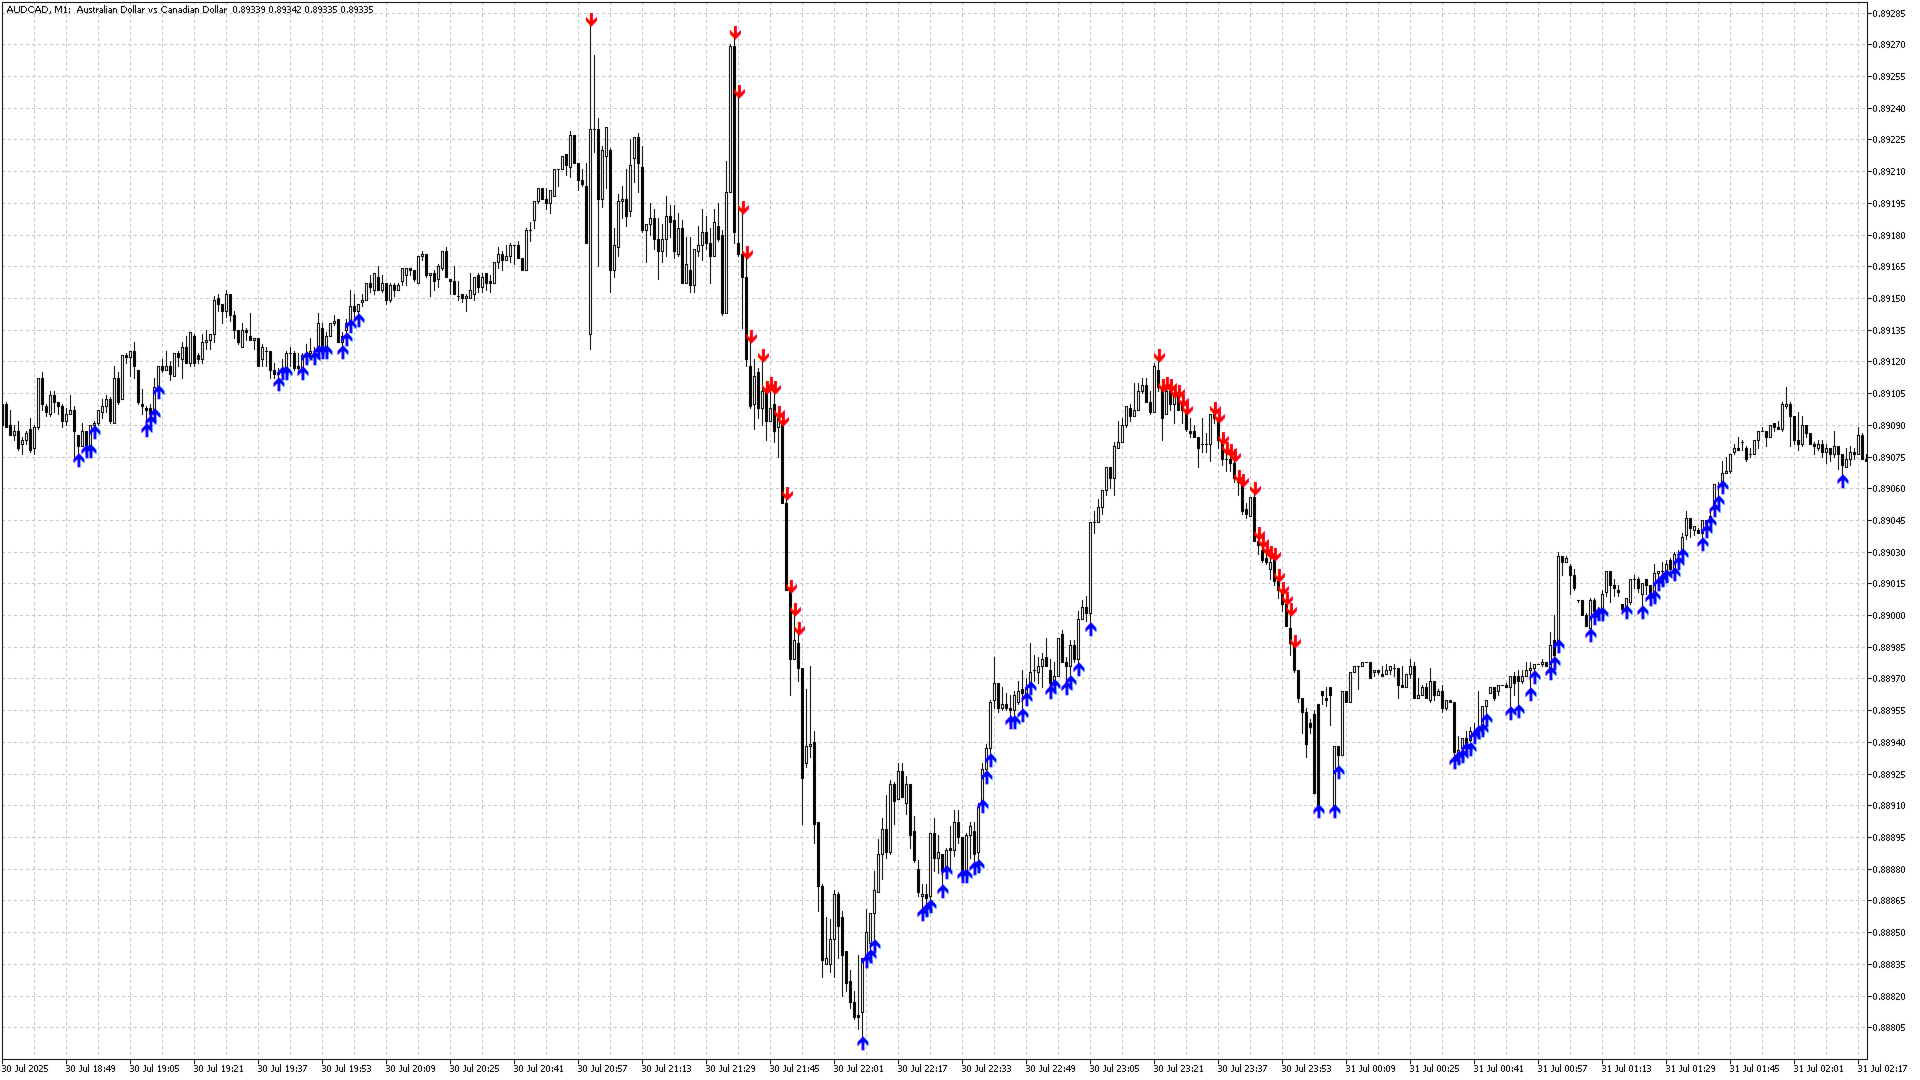
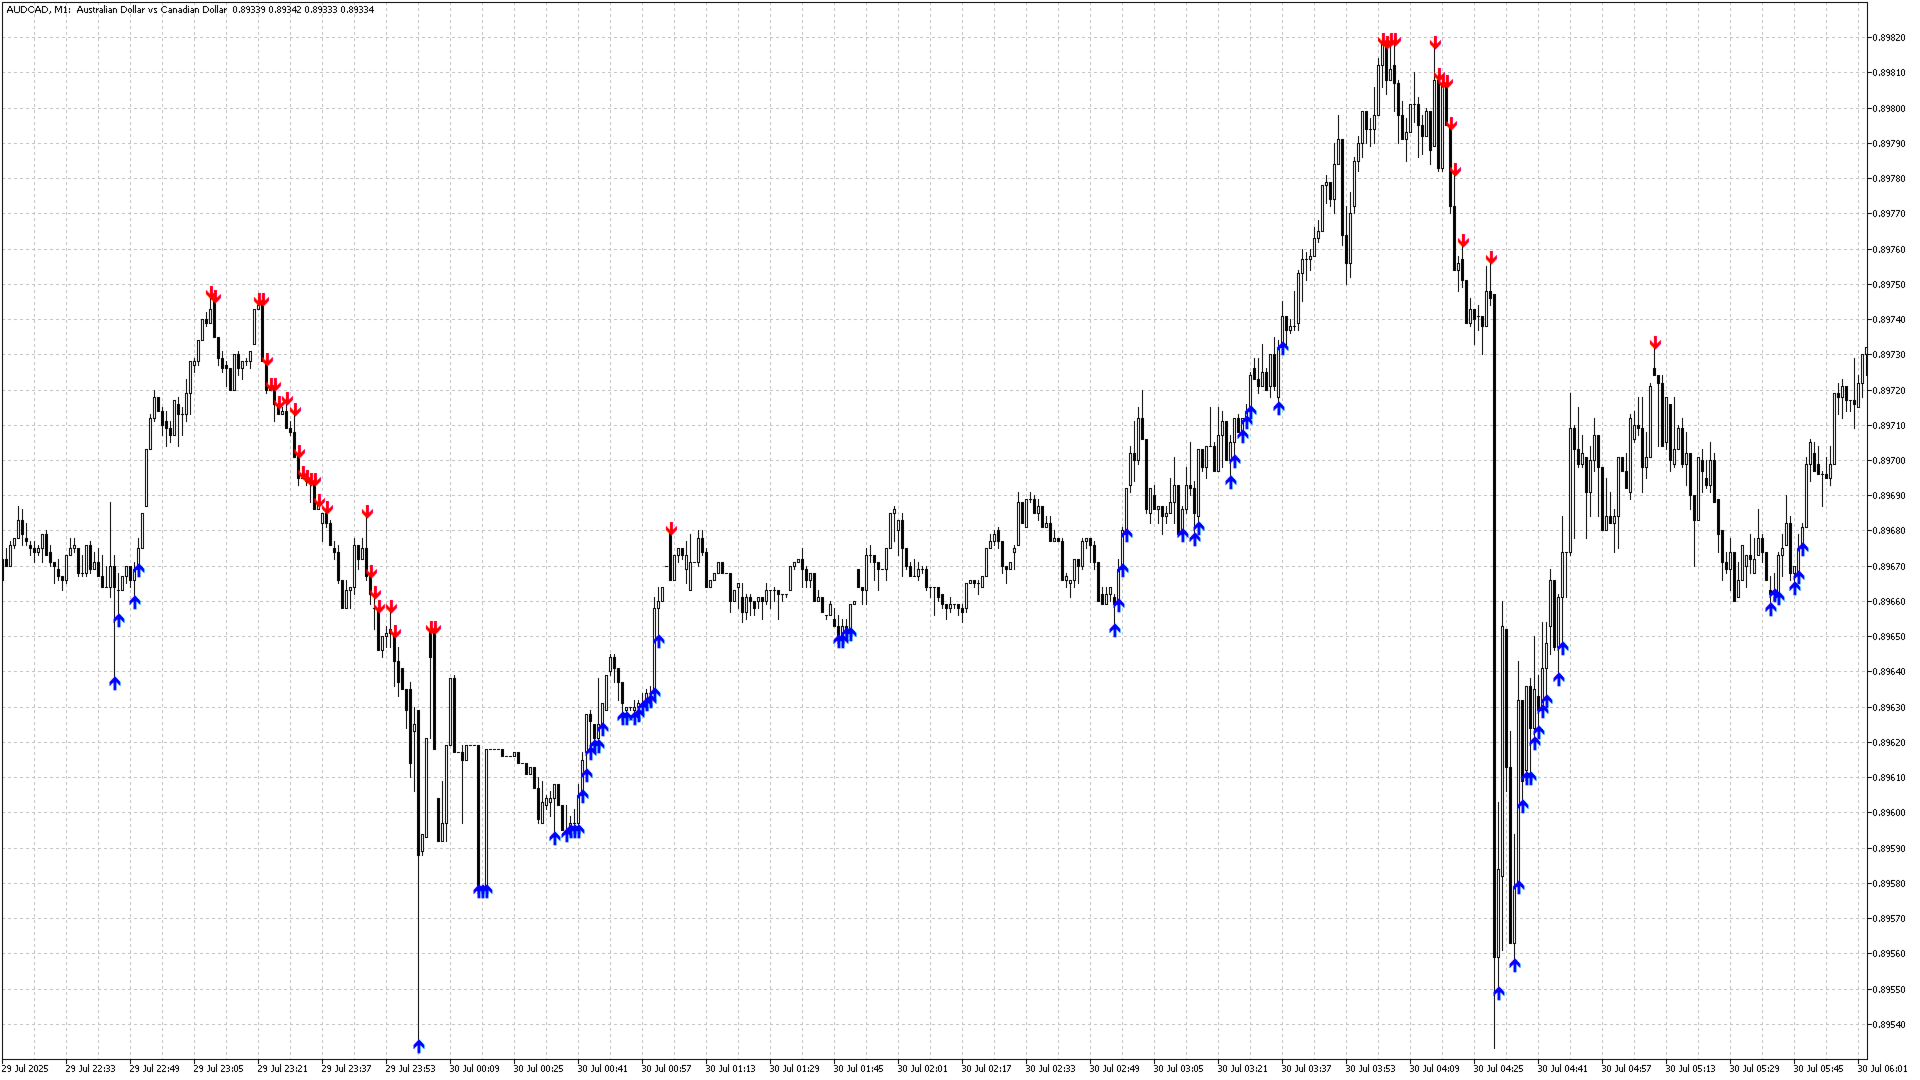
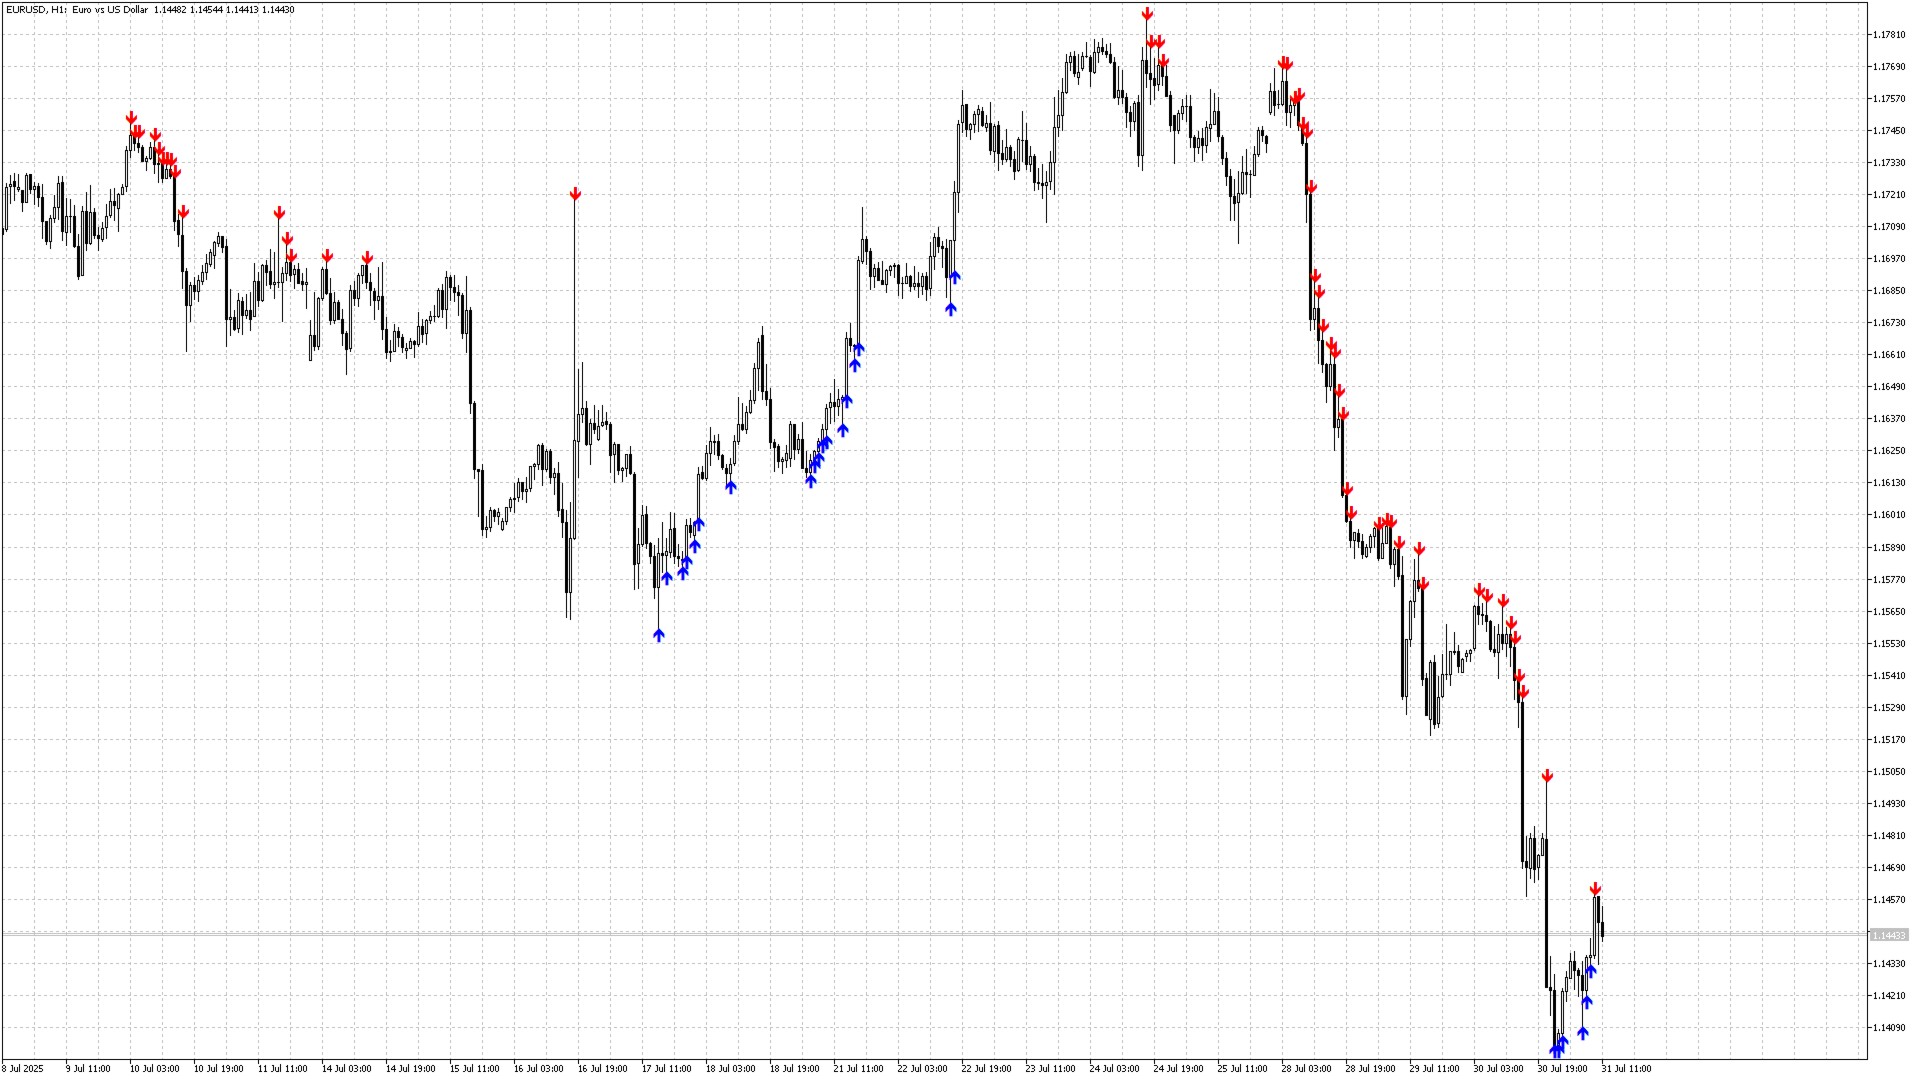
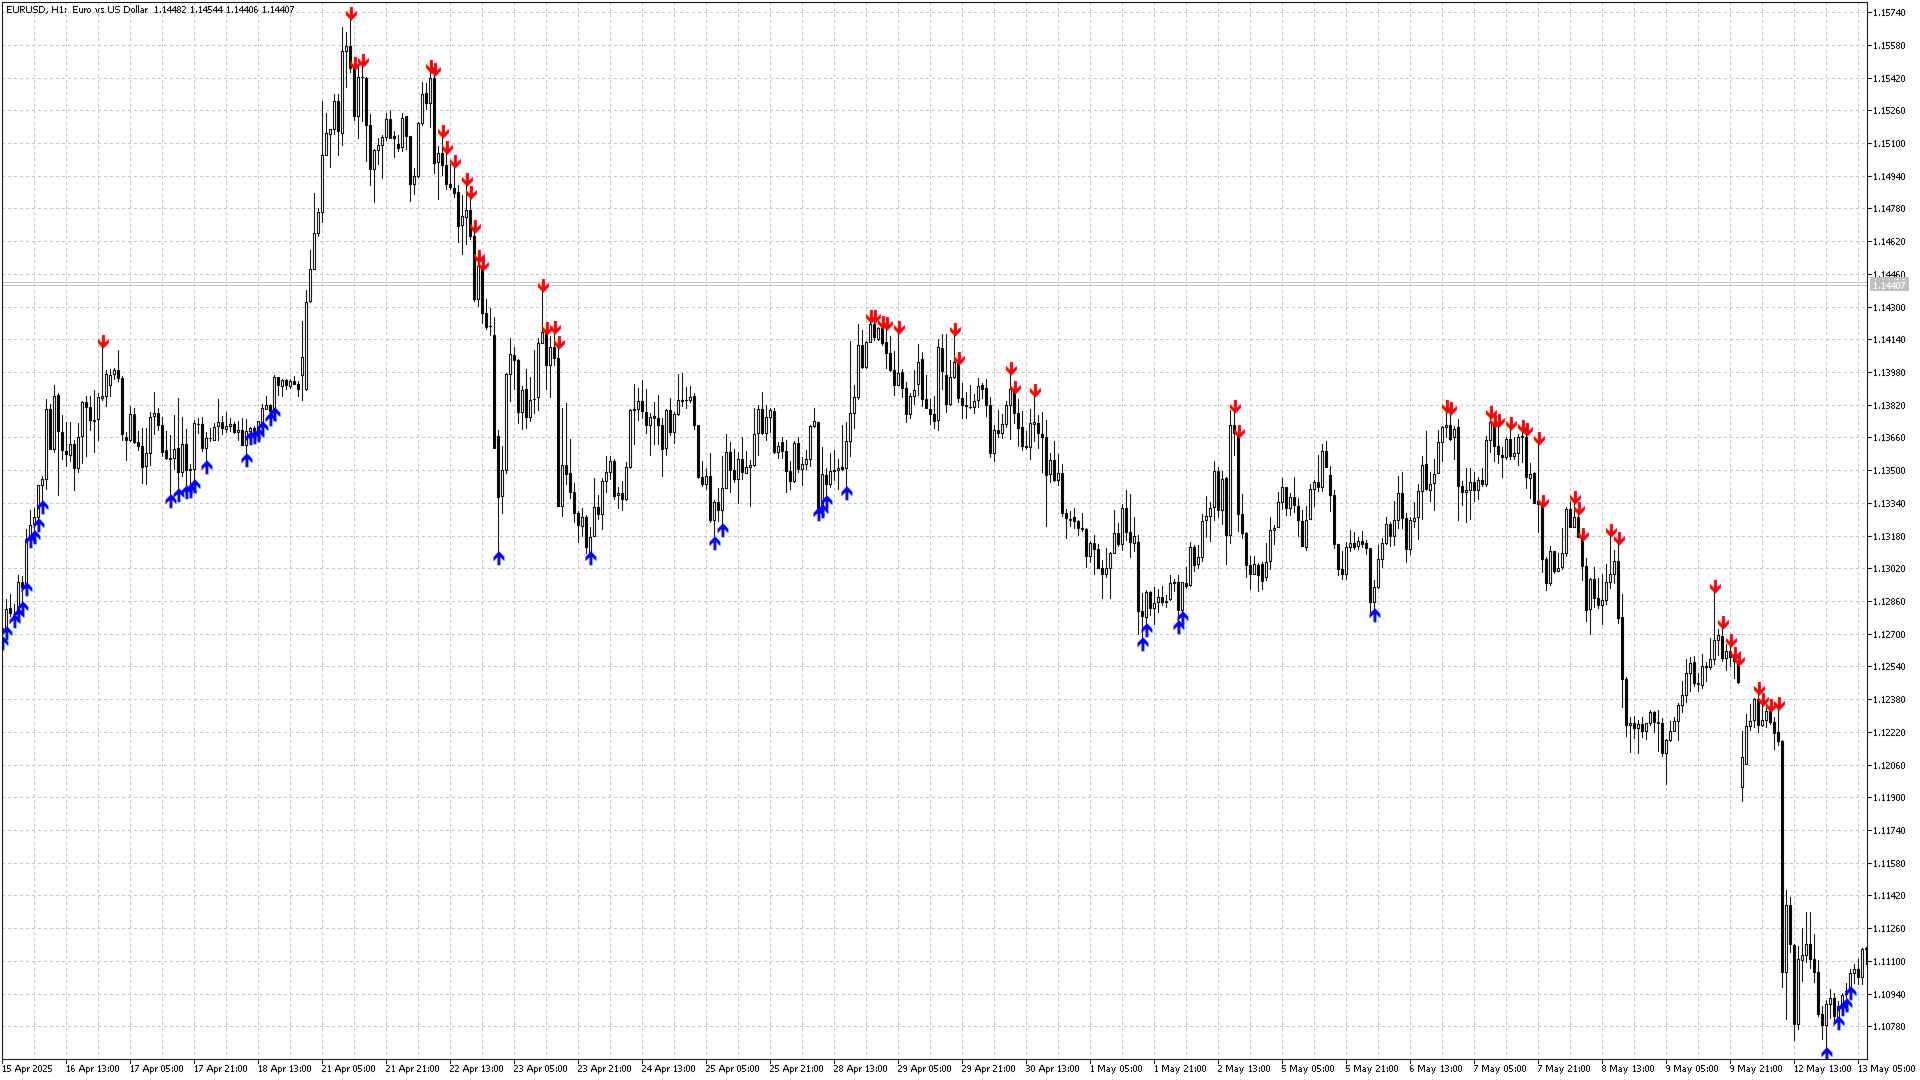
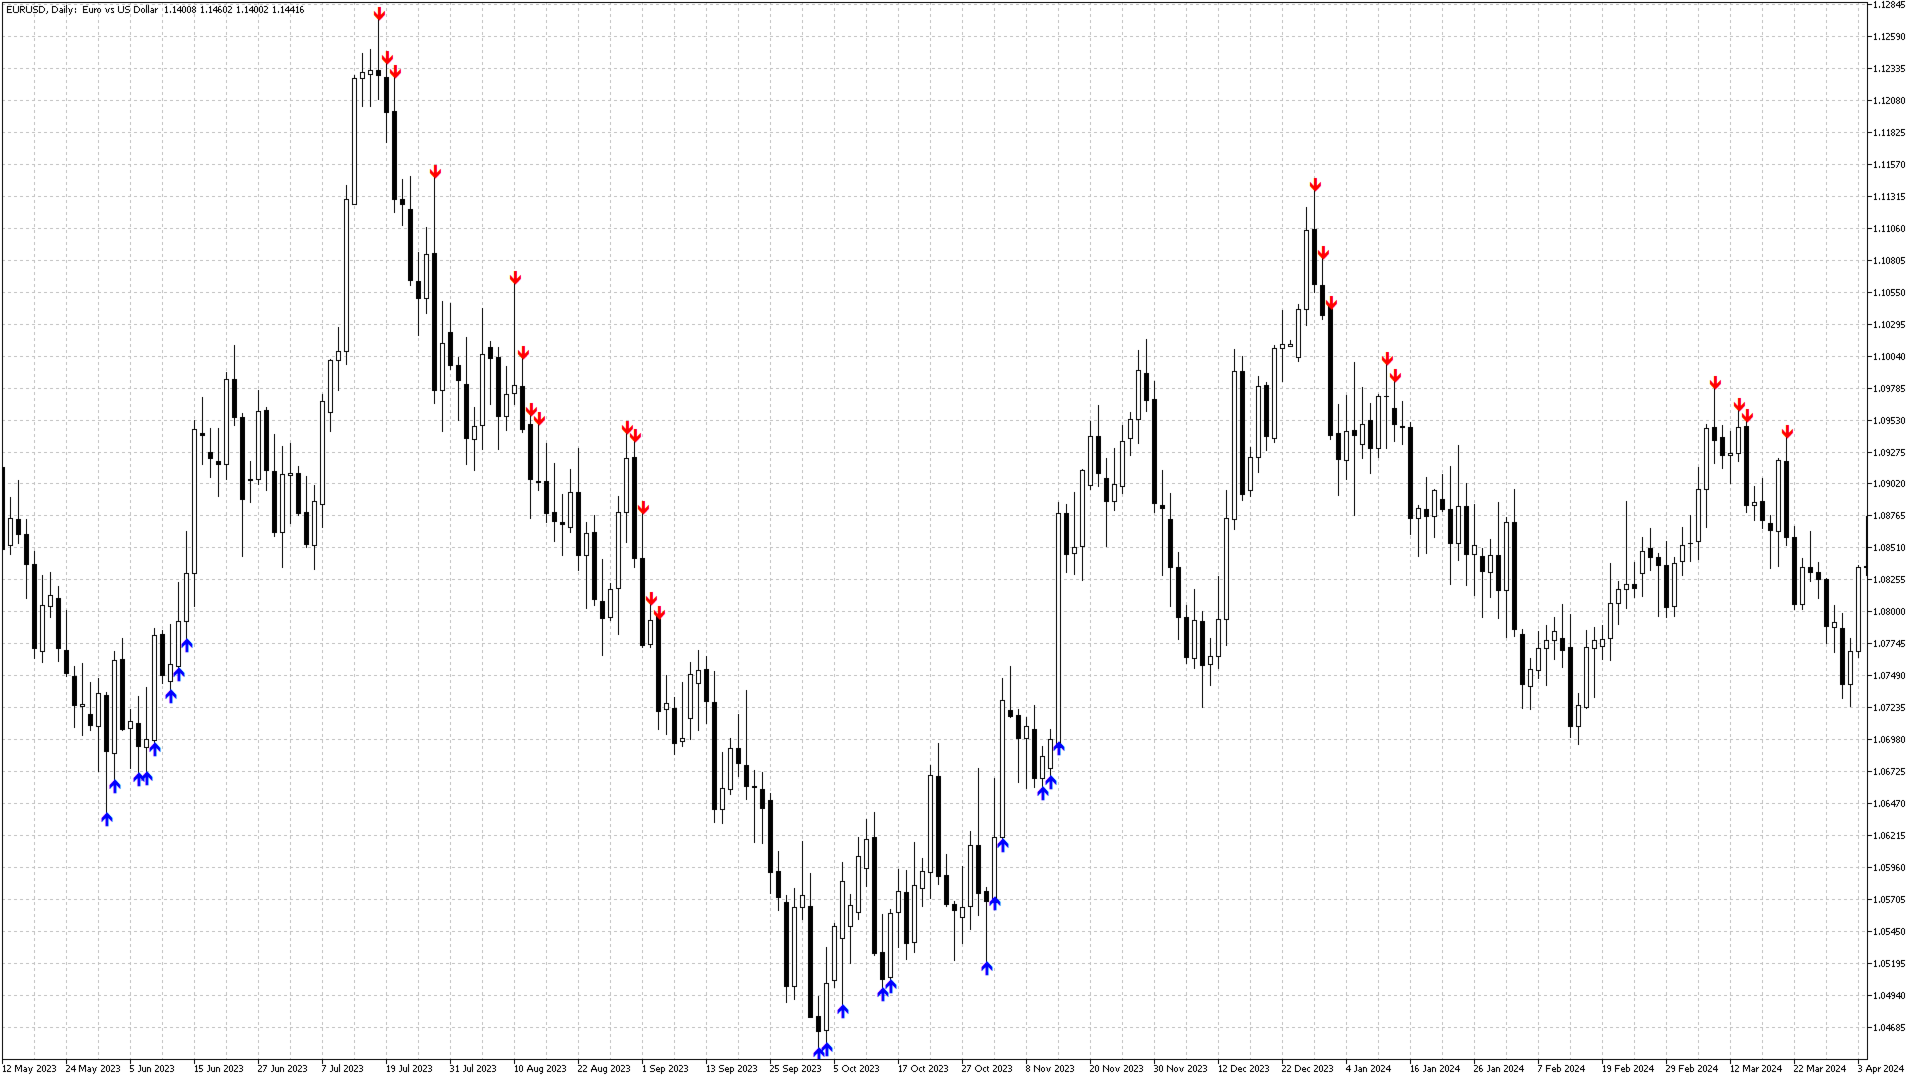
Buffers & Visualization

Pointer Trend Switch uses four separate buffers for signal plotting:

  • ExtPointBuy — standard buy signal (blue upward arrows);

  • ExtPointSell — standard sell signal (red downward arrows);

  • ExtPointBigBuy — stronger buy impulse (alternative conditions);

  • ExtPointBigSell — stronger sell impulse (alternative conditions);

All signals are drawn directly on the main chart window, making them easy to interpret during live trading or backtesting.

Input Parameters

  • PeriodBars — number of bars to scan for highs/lows (default: 50);

  • OnIdealSiglan — enables forward-looking mode (true/false);

  • Changes — internal coefficient to balance signal sensitivity;

  • Discreteness — minimal movement threshold to filter out noise;

  • OnA — enables main signal logic.

These settings allow traders to adapt the indicator to different asset classes, timeframes, and volatility conditions.

Recommendations

  • Works on all assets: Forex, stocks, indices, crypto, and commodities;

  • Best suited for M15 to H1 charts, but flexible across all timeframes;

  • Can be used standalone or as part of multi-indicator systems;

  • Performs well when combined with volume or momentum filters (e.g., RSI, CCI, OBV).

Why Choose Pointer Trend Switch?

Pointer Trend Switch offers a unique technical advantage by quantifying short-term market asymmetry. Instead of reacting to lagging indicators, it anticipates price pressure before it escalates into visible trend moves.

Whether you're a manual trader looking for high-probability entries or a strategy developer needing consistent signal logic — Pointer Trend Switch is your reliable solution.

Get Pointer Trend Switch today and enhance your ability to read price dynamics with precision, confidence, and speed. Ideal for professionals, discretionary traders, and AI modelers alike.


おすすめのプロダクト
Manyal trading system, CovEchoTrend Robot, focuses on reliability and flexibility. By employing statistical analysis methods to study the relationships between the base indicator and market patterns, the system enables a deeper understanding of market processes. Intelligent pattern analysis: The application of statistical data processing helps identify key trend reversal points more accurately, signaling significant market shifts. Informed decision-making is based on the intersection of indicato
Range Directional Force Indicator – Designed for You to Optimize! The Range Directional Force Indicator is a cutting-edge tool designed to empower traders by visualizing market dynamics and directional strength. Built to offer insights into market trends and reversals, this indicator is an invaluable asset for traders seeking precision in their strategies. However, it is important to note that this indicator is not optimized, leaving room for you to tailor it to your unique trading preferences.
This is a powerful multi cycle, multi currency pair, and multi indicator monitoring tool for MT5 version, with main functions including: 1. Monitor real-time performance of multiple indicators, including RSI, MACD, MA, and STO. 2. Monitor multiple currency pairs, customizable to add or delete currency pairs, and automatically update indicators. 3. Monitor multiple currency pairs over multiple cycles. 4. After clicking, you can directly switch to the chart and cycle you want to view. 5. Click th
PipFinite Exit EDGE MT5
Karlo Wilson Vendiola
4.87 (31)
Did You Have A Profitable Trade But Suddenly Reversed? In a solid strategy, exiting a trade is equally important as entering. Exit EDGE helps maximize your current trade profit and avoid turning winning trades to losers. Never Miss An Exit Signal Again Monitor all pairs and timeframes in just 1 chart www.mql5.com/en/blogs/post/726558 How To Trade You can close your open trades as soon as you receive a signal Close your Buy orders if you receive an Exit Buy Signal. Close your Sell orders if
uGenesys AI - 90% Accurate Daytrading Indicator Introducing the ultimate forex trading indicator system, uGenesys AI, powered by cutting-edge AI technology and advanced analytical techniques, including Time-Series Analysis and Genetic Algorithms. Our AI-powered trading system leverages the power of time-series analysis to identify trends and patterns in historical price data, allowing traders to make informed predictions about future market movements. By analyzing vast amounts of data, our syst
QuantXMarketScanner is a multi assets indicator for MT5 - Mathematical model based on 7 custom moving averages indicators  - Adaptable on Currencies, Stocks and Crypto - Automatic setup, self optimized About QuantXsystem Products: –         Simple installation & integration into MT5   –         Unlimited License after purchase (for one user) –         Automatic pattern recognition to identify the best timing and price levels. –         Trading indicators are displayed directly and automaticall
SMC Venom Model BPR インジケーターは、スマート マネー (SMC) コンセプトで取引するトレーダー向けのプロフェッショナル ツールです。価格チャート上の 2 つの主要なパターンを自動的に識別します。 FVG   (フェアバリューギャップ) は、3 本のローソク足の組み合わせで、最初のローソク足と 3 番目のローソク足の間にギャップがあります。ボリュームサポートのないレベル間のゾーンを形成し、価格修正につながることがよくあります。 BPR   (バランス価格範囲) は、2 つの FVG パターンの組み合わせで、「ブリッジ」を形成します。これは、価格がボリュームアクティビティの少ない動きで動くときに、ブレイクアウトしてレベルに戻るゾーンで、ローソク足の間にギャップを作成します。 これらのパターンは、大規模な市場プレーヤーと一般参加者の相互作用が発生するチャート上のボリュームと価格動向の分析に基づいて、トレーダーが主要なサポート/レジスタンス レベル、ブレイクアウト ゾーン、エントリ ポイントを識別するのに役立ちます。 インジケーターは、長方形と矢印の形でパターンを視覚
KingTrend — Price Action Trend Analysis Tool KingTrend is a trend-following indicator based on long-standing price action principles involving Highs, Lows, Open, and Close. The logic behind this tool comes from concepts passed on to me by my mentor and translated into code for consistent structure recognition. Features: Identifies market structure using price action logic Detects trend direction and key turning points Marks Higher Highs, Lower Lows, and extensions Suitable for discretionary or
FRONTIER PIVOTS - Geometric Levels Indicator This indicator plots support and resistance levels/ranges on the chart using mathematical calculations. It helps traders identify potential price reaction zones based on geometric patterns. Main Features: Automatically calculates and displays key price levels Plots both support and resistance lines Uses daily price data for level calculation Clean visual presentation with different colors for different level types No repainting - levels remain static
Advanced MT5 Indicator: Precision-Powered with Pivot Points, MAs & Multi-Timeframe Logic Unlock the full potential of your trading strategy with this precision-engineered MetaTrader 5 indicator —an advanced tool that intelligently blends Pivot Points , Adaptive Moving Averages , and Multi-Timeframe Analysis to generate real-time Buy and Sell signals with high accuracy.    If you want to test on Real Market, Let me know. I will give the Demo file to run on Real Account.    Whether you're a scal
The  SuperTrend Advance Trading  is a widely-used technical indicator based on  SuperTrend Strategy + Price Action + EMA . How it works: -  Buy/Sell Signals  can be generated when the trend reverses, the conditions of Price action, TrendLine and EMA are met. - After the  Signal  appears, be patient and wait until the candle closes, at that time place the order as soon as possible. You may have time to review your entry, consider whether it is a good entry or not. - Carefully review the entry, up
プレミアムレベルは、正しい予測の精度が80%を超える独自の指標です。 この指標は、最高のトレーディングスペシャリストによって2か月以上テストされています。 あなたが他のどこにも見つけられない作者の指標! スクリーンショットから、このツールの正確さを自分で確認できます。 1は、1キャンドルの有効期限を持つバイナリーオプションの取引に最適です。 2はすべての通貨ペア、株式、商品、暗号通貨で機能します 手順: 赤い矢印が表示されたらすぐにダウントレードを開き、青い矢印が表示されたら閉じます。青い矢印の後に開くこともできます。 試してテストしてください!推奨設定はデフォルトです! 日足チャートで最高の精度を示します! インディケータは、2600 Pipsの収益性に対して、約10Pipsという非常に小さなマージンを使用します。
PR EA - Engulfing Pattern Trading System Automated Engulfing Pattern Detection with MA Confirmation The PR EA is a Meta Trader 5 expert advisor that identifies and trades bullish/bearish engulfing candlestick patterns when confirmed by a moving average filter. Designed for swing trading on 30-minute charts with compatibility for M15 and H1 time frames. Key Features: Pattern Recognition - Detects valid bullish/bearish engulfing candle formations Trend Confirmation - 238-period SMA filter
My Trendline is an Indicator based on Upper and Lower Trendline which will Plot Automatically into the Chart. This Indicator will perfectly indicate you the Trend of the Market. It can be use in any Time Frame. The Indicator will automatically adjust according to the Current Time Frame. Steps to Setup the Indicator: Install the Custom Indicator; Set all the Inputs, Line Color, Width and Styles etc. (Can use the Default Setting also); Set visualization to All Timeframe; and DONE It can
Gioteen Volatility Index (GVI) - your ultimate solution to overcoming market unpredictability and maximizing trading opportunities. This revolutionary indicator helps you in lowering your losing trades due to choppy market movements. The GVI is designed to measure market volatility, providing you with valuable insights to identify the most favorable trading prospects. Its intuitive interface consists of a dynamic red line representing the volatility index, accompanied by blue line that indicate
Our BOOM SELL ALERT indicator is specifically engineered to   take candles on BOOM 1000 , BOOM 500 is tool is optimized for M1 (1-minute) timeframe, ensuring you receive timely and actionable insights.   The indicator is a combination of   many indicators. -        AO Oscillator -        Stochastic   HOW TO USE THIS INDICATOR To use well this indicator , it   need to use SCHAFF TREND RSX ( 5 MIN OR M5) IF SCHAFF trend RSX is GREEN and you have a signal then SELL when you have ENTRY and out with
回帰取引を意味する専門的かつ定量的なアプローチを実装する独自の指標。これは、価格が予測可能かつ測定可能な方法で迂回して平均に戻るという事実を利用しており、非定量的な取引戦略を大幅に上回る明確な出入りルールを可能にします。 [ Installation Guide | Update Guide | Troubleshooting | FAQ | All Products ] 明確な取引シグナル 驚くほど簡単に取引できます カスタマイズ可能な色とサイズ パフォーマンス統計を実装します ほとんどの取引戦略を上回ります 適切なSLおよびTPレベルを表示します 電子メール/音声/視覚アラートを実装します 使い方 インディケータは、より高い時間枠からの完全にカスタマイズ可能な移動平均の周りの標準偏差を測定し、トレンドフォローアプローチを使用して正確に取引を見つけます。取引は、現在のチャートの価格アクションに飛び込むことによって見つけられ、価格が選択したより高い時間枠から計算された平均価格帯に戻ったときに閉じられます。それがコード化される方法のために、指標は高ボラティリティと強いトレンドの市場か
Hello There, Today I want to show you my new researchable fore BUY SELL indicator, Golden Scalp System v2 it work all asset, it work all time frame, but i recommend start 5 minute to H1 when you receive a signal just take trade and stay wait for your take profit asset All Major Pair And minor IT WORK ALSO XAUUSD Fantastic results,  for more info,,, message us thank you 
##   ONLY GOLD ##   Тiльки Золото ## **Mercaria Professional Trading Zones - Complete Guide** ## **Mercaria Professional Trading Zones - Повний посібник** ### **How Mercaria Zones Work / Як працюють зони Mercaria** **English:** Mercaria Zones is an advanced trading indicator that identifies high-probability support and resistance areas using ZigZag extremes combined with mathematical zone calculations. The indicator works on multiple timeframes simultaneously, providing a comprehensive view
Noize Absorption Index - is the manual trading system that measures the difference of pressure between bears forces and bulls forces. Green line - is a noize free index that showing curent situation. Zero value of index shows totally choppy/flat market.Values above zero level shows how powerfull bullish wave is and values below zero measures bearish forces.Up arrow appears on bearish market when it's ready to reverse, dn arrow appears on weak bullish market, as a result of reverse expectation.
Equinox Gold
Dmitriq Evgenoeviz Ko
Equinox Gold is a high-tech trading expert advisor (EA) specifically designed for the gold market ( XAUUSD ). The system is based on a unique Market Equilibrium algorithm that identifies areas of imbalance between supply and demand during extreme volatility. Unlike most robots that use dangerous sit-and-wait methods, Equinox Gold relies on mathematical momentum confirmation and strict risk control for every trade. MAIN ADVANTAGES VRP Filter (Volatility Range Filter): The robot automatically ada
The new update makes this indicator a complete tool for studying, analyzing and operating probabilistic patterns. It includes: On-chart Multi-asset percentage monitor. Configurable martingales. Twenty-one pre-configured patterns, including Mhi patterns and C3. An advanced pattern editor to store up to 5 custom patterns. Backtest mode to test results with loss reports. Trend filter. Hit operational filter. Martingale Cycles option. Various types of strategies and alerts. Confluence between patter
The implementation of the Trend Turn trend indicator is simple - in the form of lines of two colors. The indicator algorithm is based on standard indicators as well as its own mathematical calculations. The indicator will help users determine the direction of the trend. It will also become an indispensable advisor for entering the market or closing a position. This indicator is recommended for everyone, both beginners and professionals. How to interpret information from the indicator. We sell
Limitless MT5 is a universal indicator suitable for every beginner and experienced trader. works on all currency pairs, cryptocurrencies, raw stocks Limitless MT5 - already configured and does not require additional configuration And now the main thing Why Limitless MT5? 1 complete lack of redrawing 2 two years of testing by the best specialists in trading 3 the accuracy of correct signals exceeds 80% 4 performed well in trading during news releases Trading rules 1 buy signal - the ap
4. 日本語 (Japonais) インジケーター Monthly Levels + Pin Bar Pro 説明 Monthly Levels + Pin Bar Pro は、 月足の主要レベル(高値、安値、始値、終値) と プライスアクション反転パターン(ピンバー) の自動検出を組み合わせたインジケーターです。 テクニカルトレーダーや機関投資家向けに設計され、市場の反応ゾーンを予測し、チャート上に明確なシグナルを表示します。 主な機能 月次レベルを自動表示 :高値、安値、始値、終値。 ピンバー検出 (強気・弱気)リアルタイム。 視覚的にわかりやすい表示 :水平ライン + シグナル矢印。 ️ カスタマイズ可能 :タイムフレーム、矢印コード、サイズ、オフセット。 最適化済み :軽量、スキャルピングやスイング取引に最適。 ️ EA互換 :自動売買戦略に統合可能。 ️ 使い方 任意のタイムフレームのチャートに追加します。 月次の 高値、安値、始値、終値 が自動で表示されます。 矢印を確認: 青い矢印 → 強気ピンバー (月次サポー
Crypto_Forex インジケーター   PINBAR パターン MT5用。リペイントなし、遅延なし。 - インジケーター「PINBARパターン」は、プライスアクション取引に非常に強力なインジケーターです。 - インジケーターはチャート上のピンバーを検出します。 - 強気のピンバー - チャート上に青い矢印シグナルを表示します(画像参照)。 - 弱気のピンバー - チャート上に赤い矢印シグナルを表示します(画像参照)。 - PC およびモバイルのアラート付き 。 - インジケーター「PINBARパターン」は、サポート/レジスタンスレベルと組み合わせるのに最適です。 高品質のトレーディングロボットとインジケーターをご覧になるにはここをクリックしてください! これは、このMQL5ウェブサイトでのみ提供されるオリジナル製品です。
Based on the trading model/strategy/system of gold double-position hedging and arbitrage launched by Goodtrade Brokers, problems encountered in daily operations: 1. Account B immediately places an order immediately following account A. 2: After account A places an order, account B will automatically copy the stop loss and take profit. 3: Account A closes the position of Account B and closes the position at the same time. 4: When account B closes the position, account A also closes the position.
Nrha
Ratna Purwantari
This indicator uses Fibonacci to determine your trading levels precisely and measurably. It helps you to earn big profits. This indicator can also be used for various currency charts. You can also combine it with other indicators that you like so that the profits you get are also even greater. I hope you give me input so that this indicator can be better. We recommend using for the period M1 to M15. feel free to discuss with me. Thanks. 
Jita Indicator Pro MT5 | All Timeframes Professional Trend Agreement System – Premium Edition ($500) What Is Jita Indicator Pro? Jita Indicator Pro is a structured trend-confirmation system designed for serious traders who value precision, alignment, and controlled signal behavior. It combines: Advanced band-based trend direction logic ATR-driven structural trigger engine Dual-confirmation agreement system Locked history update design This indicator prints signals only when multiple conditions
MarketMagnet
Kelly Adediran Raymond
Are you ready to take your trading journey to new heights? Look no further than MarketMagnet, this groundbreaking indicator designed to propel your trading success with excitement and accuracy. Powered by the convergence of Momentum and CCI (Commodity Channel Index), MarketMagnet equips traders with the ultimate tool to determine direction and entry prices for a wide range of recommended currency pairs and instruments. It is designed for traders seeking to scalp for a few pips on lower timeframe
このプロダクトを購入した人は以下も購入しています
ARIPoint is a powerful trading companion designed to generate high-probability entry signals with dynamic TP/SL/DP levels based on volatility. Built-in performance tracking shows win/loss stats, PP1/PP2 hits, and success rates all updated live. Key Features: Buy/Sell signals with adaptive volatility bands Real-time TP/SL/DP levels based on ATR Built-in MA Filter with optional ATR/StdDev volatility Performance stats panel (Success, Profit/Loss, PP1/PP2) Alerts via popup, sound, push, or email Cu
「 Dynamic Scalper System MT5 」インジケーターは、トレンド波の中でスキャルピング取引を行う手法のために設計されています。 主要通貨ペアと金でテスト済みで、他の取引商品との互換性があります。 トレンドに沿った短期的なポジションオープンのシグナルを提供し、追加の価格変動サポートも提供します。 インジケーターの原理 大きな矢印はトレンドの方向を決定します。 トレンド波の中では、小さな矢印の形でスキャルピングシグナルを生成するアルゴリズムが機能します。 赤い矢印は強気方向、青い矢印は弱気方向です。 トレンドの方向には敏感な価格変動ラインが描かれ、小さな矢印のシグナルと連動します。 シグナルは次のように機能します。適切なタイミングでラインが現れるとエントリーシグナルが形成され、ラインが開いている間はポジションが保持され、完了すると取引が終了します。 推奨される動作時間枠はM1~H4です。 矢印は現在のローソク足に形成され、次のローソク足が開いている場合は、前のローソク足の矢印は再描画されません。 入力パラメータ Trend Wave Period - トレ
note: this indicator is for METATRADER4, if you want the version for METATRADER5 this is the link:  https://www.mql5.com/it/market/product/108106 TRENDMAESTRO ver 2.5 TRENDMAESTRO recognizes a new TREND from the start, he never makes mistakes. The certainty of identifying a new TREND is priceless. DESCRIPTION TRENDMAESTRO identifies a new TREND in the bud, this indicator examines the volatility, volumes and momentum to identify the moment in which there is an explosion of one or more of these da
The Institutional Secret Method  represents a paradigm shift in market analysis, moving away from lagging indicators and into the realm of Topological Finance . It is engineered to decode the hidden geometry of price movement by calculating the most efficient path—the Geodesic —between current price action and institutional liquidity targets. The system views the market as a physical landscape where price is naturally drawn toward massive pools of liquidity (Stops). It uses two primary calculati
このインジケーターは、市場で 関心が示されたゾーン をハイライトし、その後に 注文の蓄積ゾーン を表示します。 これは、大規模な**板情報(オーダーブック)**のように機能します。 これは、 巨大な資金 のためのインジケーターです。その性能は卓越しています。 市場にどんな関心が存在していても、 必ず目に見えるようになります 。 (これは 完全に再設計され、自動化されたバージョン です。もはや手動分析は必要ありません。) トランザクションスピード(取引速度) は新しい概念のインジケーターで、市場で大口注文が どこに・いつ 集中しているかを示し、それに基づいたチャンスを提供します。 トレンドの変化を 非常に早い段階 で察知することができます。 FXでは「出来高」と呼ばれているものは誤解されています。実際には、これは 時間あたりの価格変動量 です。したがって、正しい名称は トランザクションスピード です。 考え方・行動・分析の仕方すべてが問われます。 分析パラダイムの転換は非常に重要です。 このインジケーターは、FXにおける出来高の考え方を 根本から再定義 し、論理的な形で正確に活用する、
ARIScalp is a powerful trading companion designed to generate high-probability entry signals with dynamic TP/SL/DP levels based on volatility. Built-in performance tracking shows win/loss stats, PP1/PP2 hits, and success rates all updated live. Key Features: Buy/Sell signals with adaptive volatility bands Real-time TP/SL/DP levels based on ATR Built-in MA Filter with optional ATR/StdDev volatility Performance stats panel (Success, Profit/Loss, PP1/PP2) Alerts via popup, sound, push, or email Cus
Weis Wave with Alert MT5
Trade The Volume Waves Single Member P.C.
4.94 (17)
Rental/Lifetime Package Options and Privileges  Rent Monthly Six Months   Yearly/Lifetime Weis Wave with Speed with Alert+Speed Index x x x Manual  x x x Quick Set up Video x x x Blog x x x Lifetime Updates x x x Setup and Training Material x x Discord Access Channel "The SI traders"          x Rectangle Break Alert Tool      x How to trade with it:    http://www.tradethevolumewaves.com   ** If you purchase please contact me to setup your  : Training Room and  complete manual access.  Wei
IVISTscalp5
Vadym Zhukovskyi
5 (6)
iVISTscalp5インジケーターをご紹介します。このインジケーターは、トレーディングにおいて独自でありながら効果的です。時間データに基づくこのインジケーターは、多年にわたる経験と金融市場の深い分析の結果です。iVISTscalp5インジケーターは、手動トレーディングにとって優れたツールです。便利さ、簡単さ、可視化 - すべての複雑さが内部に隠されています。私たちは、iVISTscalp5インジケーターの設定と使用を最大限に簡素化しました。このインジケーターは、MT5ターミナルにあるすべての金融商品に適しています。 稼働時間は、4時から20時(UTC+3)です。 iVISTscalp5インジケーターメニュー(スクリーンショット1を参照): History - 引用を計算する週数 dT_min - 時間間隔の選択(分) TFline - 水平ボリュームの作成(時間枠) BARSline - 水平ボリュームの作成(バー数) TFtrend1 - デイリーチャンネルの作成(時間枠) BARStrend1 - デイリーチャンネルの作成(バー数) TFtrend2 - 週次チャンネルの作成(時
Rtc ML Ai | Predictor CORE MACHINE LEARNING ENGINE Adaptive ML Market Predictor – Multi-Bar Trend & Candle Forecast What This Indicator Does This indicator is a  real-time market prediction engine  designed to analyze price behavior and estimate  future market tendencies . Unlike conventional indicators, this system  does not rely on static parameters or historical curve-fitting , but adapts its internal state dynamically during live market operation. Instead of using static rules, the indic
Recommended TimeFrame >= H1. 100% Non Repainted at any moment.  Use it carefully, only with Trend Direction. Trading Usage: 2 Variants: as Range System or as BreakOut System (Both Only With Trend Direction)::: (Always use StopLoss for minimise Risk); [1] as Range System: (Recommended) in UP TREND:  - BUY in Blue Line , then if price goes down by 50 points (on H1) open Second BUY.   Close in any Profit you wish: TrailingStop(45 points) or Close when Price touches upper Gold Line. in DOWN TREND
WARNING: This indicator is distributed EXCLUSIVELY on MQL5.com MT4 version:   https://www.mql5.com/it/market/product/160363 MT5 version:   https://www.mql5.com/it/market/product/160410 ============================================================================================= MAX RIBBON ver 1.00 The indicator that shows you the TREND clearly and unambiguously! ============================================================================================= DESCRIPTION MAX RIBBON is an advanced tre
AlgoEAs Trend Dashboard V1 Indicator for MT5 Introduction: This is a Dashboard Indicator based on 7 built in Multi Timeframe indicators. This strategy gives Buy/Sell Ideas based on 9 trend states. Easy to view gas guage to view current trend. Has as optional Alerts to enable with 9 messages. Run on M15 chart, with M15, H1, and H4 indicator time frames. Great tool! Features: Non-Repainting Dashboard For Desktop MT5 Only, Works On Any Mt5 Pair Great for Intraday and Swing Trading Easy view gas
MATADOR SILVER – XAGUSD MT5 M5 Timeframe Scalp Signals MATADOR SILVER is a professional signal and decision-support indicator developed specifically for XAGUSD (Silver) scalping on the M5 timeframe , designed for real market conditions and disciplined execution. This indicator does NOT open, manage, or close trades automatically . It provides structured BUY & SELL signals , intelligent filtering, and alerts, allowing traders to execute trades using their own strategy and risk management rules .
+++++++++++++++++++++++++++++++++++++++++++++++++++++++++++++++++++++++++++++++++++++++++++++++++ +++ Link to EURUSD Only Free Version -->  https://www.mql5.com/en/market/product/156904?source=Unknown +++++++++++++++++++++++++++++++++++++++++++++++++++++++++++++++++++++++++++++++++++++++++++++++++ Hallo Trader, This is a traditional GANN & FIBONACCI strategy based on detection of an impulsive move in the opposite direction. This is called a Breakout. At the moment of Breakout, the indicator draw
Big Player Range
Thalles Nascimento De Carvalho
5 (3)
BigPlayerRange — MT5向け最強インジケーター BigPlayerRange は、MetaTrader 5 で日経ミニやドル先物などの取引において、 最も効果的なインジケーター と評価されています。大口投資家(機関投資家)の行動を可視化し、高精度なテクニカル分析を可能にします。 どのように機能するのか? BigPlayerRangeは、買い圧力ゾーン(緑ライン)と売り圧力ゾーン(赤ライン)を描画し、価格がその範囲を超えるとトレンド方向への動きを示唆します。 緑のライン上で終値: 買いの勢いが強く、上昇トレンドの可能性。 赤のライン下で終値: 売り圧力が優勢で、下落が予想される。 範囲内での価格: レンジ相場でブレイクを待つ段階。 主なメリット: 機関投資家ゾーンの検出: 大口のエントリーポイントを視覚化。 自動ターゲット計算: 利確ポイントを戦略的に設定。 プルバックの可能性分析: リスク管理に役立つ情報提供。 推奨の使い方: Imbalance DOM Pro と併用してゾーンブレイクを確認。 SwingVolum
Historical Similarity Matcher Indicator (HI.SI.MA) Try it free today — demo version now available!   https://www.mql5.com/en/market/product/167114 Overview The Historical Similarity Matcher is a technical analysis indicator for MetaTrader 5. It scans historical price data to find segments that show statistical similarity to a user-selected reference period on the chart.
From The Sons comes the Alpha. Our intention is to bridge institutional with retail analysis just to ensure level ground at affordable rates for us all.  The Mathematical Inevitability of Alpha: ATHENA x PROMETHEUS = Predator Pulse AI (Alpha)  In the global theater of finance, the "retail trader" is often just liquidity for the giants. To survive, you don't need a better indicator; you need a fundamental shift in how you perceive reality. The ATHENA x PROMETHEUS system is not a tool—it is a mat
マーケットメーカーのためのツール。 Meravith は次の機能を提供します: すべての時間足を分析し、現在有効なトレンドを表示します。 強気と弱気の出来高が等しくなる流動性ゾーン(出来高均衡)を強調表示します。 異なる時間足のすべての流動性レベルをチャート上に直接表示します。 テキスト形式の市場分析を生成し、参考情報として表示します。 現在のトレンドに基づいて目標値、サポートレベル、ストップロスを計算します。 取引のリスクリワード比を算出します。 口座残高に基づいてポジションサイズを計算し、潜在的な利益を推定します。 また、市場に大きな変化があった場合には警告を表示します。 インジケーターの主要ライン: 強気/弱気の出来高エグゾーストライン ― 目標値として機能します。 市場のトレンドを示すライン。市場が強気か弱気かによって色が変わり、トレンドのサポートとして機能します。主にその色が市場センチメントを示します。 出来高均衡ライン(Eq)。Eq(Volume Equilibrium)ラインはシステムの中核です。これは買い手と売り手の出来高のバランスポイントを表します。市場の流動性を示し
Hunter Spike
Jaime Humberto Gomez Arias
Hunter Spike This indicator consists of two regression channels calibrated with the current movement of the synthetic index algorithm, for any Deriv or Weltrade broker. Each channel has a signal, a target that alerts us when the price touches them, indicating buys on booms or gains and sells on crashes or pains. -configuration for booms or gains: Channel zone 1 (30) Channel zone 2 (0) -configuration for crashes or pains: Channel zone 1 (100) Channel zone 2 (70) Zones freely configurable by
A tool for on-chart strategy backtesting and performance analysis. A utility for developing, debugging, and testing custom trading ideas and indicator functions. An indicator designed to quickly test trading concepts and visualize the effectiveness of different input parameters. An all-in-one sandbox for testing everything from simple crossovers to complex, multi-condition trading systems.
VTrende Pro
Andrii Diachenko
5 (1)
VTrende Pro - MTF indicator for trend trading with a display panel for MT5 *** Videos can be translated into any language using subtitles (video language - Russian) Although the signals of the VTrende Pro indicator can be used as signals of a full-fledged trading system, it is recommended to use them in conjunction with the Bill Williams TS. VTrende Pro is an extended version of the VTrende indicator. Difference between Pro version and VTrende: - Time zones - Signal V - signal 1-2 waves -    S
CGE Trading Suite
Carl Gustav Johan Ekstrom
5 (1)
CGE Trading Suite delivers the analytical edge typically reserved for professional trading desks. The platform integrates a full suite of analytical tools into one seamless workflow: dynamic grid mapping, liquidity behavior analysis, ECM, trend lines, MIDAS, trade cycles, and directional channel projections. Together, these provide a unified view of market structure and momentum. Directional clarity is further enhanced by the capital flow index, which measures currency basket strength to identif
FXLAND Smart Reversal Indicator (MT5) FXLAND Smart Reversal Indicator is a professional technical analysis tool designed to help traders identify potential price reversal zones and key market turning points with clarity and precision. The best reversal indicator and price return by choosing only one ceiling or floor in each time frame A masterpiece of combining mathematics and Gann, fractal matrix, Fibonacci, movement angle and time. Completely intelligent Key Features Detects potenti
A scalping indicator based on mathematical patterns, which on average gives signals with relatively small SL, and also occasionally helps to catch big moves in the markets (more information in the video) This indicator has three main types of notifications: The first type warns of a possible/upcoming signal on the next bar The second type indicates the presence of a ready signal to enter the market/open a position The third type is for SL and TP levels - you will be notified every time price re
MATADOR GOLD – XAUUSD MT5 M5 Timeframe Scalp Signals MATADOR GOLD is a professional signal indicator designed for XAUUSD (Gold) scalping on the M5 timeframe , with optional higher-timeframe confirmation. This indicator does not open or manage trades automatically . It provides structured buy and sell signals, intelligent filtering, and alerts, allowing traders to execute trades using their own strategy and risk management rules. Core Concept (Multi-Concept Architecture) MATADOR GOLD is built
XCalper TFO
Aecio de Feo Flora Neto
This oscillator was developed exclusively by xCalper in 2015 based on moving averages calculations to indicate and try predicting oversold and overbought levels. The fast line (white, by default) oscillates basically between values -0.5 (oversold) and +0.5 (overbought). Whenever this line crosses upward value -0.5, it means an oversold price level. When it crosses downward value +0.5, it means an overbought price level. When fast line crosses value 0.0 and returns, it is a strong pull-back indic
The Expert Advisor and the video are attached in the Discussion tab . The robot applies only one order and strictly follows the signals to evaluate the indicator efficiency. Pan PrizMA CD Phase is an option based on the Pan PrizMA indicator. Details (in Russian). Averaging by a quadric-quartic polynomial increases the smoothness of lines, adds momentum and rhythm. Extrapolation by the sinusoid function near a constant allows adjusting the delay or lead of signals. The value of the phase - wave s
Классификатор силы тренда. Показания на истории не меняет. Изменяется классификация только незакрытого бара. По идее подобен полной системе ASCTrend, сигнальный модуль которой, точнее его аппроксимация в несколько "урезанном" виде, есть в свободном доступе, а также в терминале как сигнальный индикатор SilverTrend . Точной копией системы ASCTrend не является. Работает на всех инструментах и всех временных диапазонах. Индикатор использует несколько некоррелируемых между собой алгоритмов для класси
FFx Universal Strength Meter PRO is more than a basic strength meter. Instead of limiting the calculation to price, it can be based on any of the 19 integrated strength modes + 9 timeframes. With the FFx USM, you are able to define any period for any combination of timeframes. For example, you can set the dashboard for the last 10 candles for M15-H1-H4… Full flexibility! Very easy to interpret... It gives a great idea about which currency is weak and which is strong, so you can find the best pai
The FFx Universal MTF alerter shows on a single chart all the timeframes (M1 to Monthly) with their own status for the chosen indicator. 9 indicators mode (MACD-RSI-Stochastic-MA-ADX-Ichimoku-Candles-CCI-PSAR). Each can be applied multiple times on the same chart with different settings. Very easy to interpret. Confirm your BUY entries when most of the timeframes are showing green color. And confirm your SELL entries when most of the timeframes are showing red color. 2 Alert Options : input to s
作者のその他のプロダクト
The Compare Graphs indicator is an analysis tool that allows traders to compare two or more graphs on the same chart window. This indicator is commonly used in trading platforms such as MetaTrader and provides a clearer comparison of different financial instruments or time frames. Functions of the Compare Graphs indicator may include: Selecting Charts: The trader can select the charts he wants to compare, such as price charts of different currency pairs or indicators on the same chart. Setting
The   Angle Prices   indicator is a tool that calculates the price angle based on price analysis, interpreting the time vector in the form of price points on the price chart. In other words, the X axis and Y axis are represented as price points, so you can actually calculate the angle with two axes of the same dimension. This allows traders to obtain information about the direction of price movement and possible entry or exit points for trades. Let's look at the main characteristics and interpr
The " Fortune Long " bot works using pending orders and reacts to a channel breakdown with the direction of work in the channel; it is necessary to correctly calculate the levels of entry, stop loss, take profit, and the level of deviation of the pending order from the price. The bot needs to be optimized for 2 years with a forward period of 1/2. Once optimization is complete, select the best settings and save them. Work for 6 months. The bot automatically calculates all levels and the entry le
In the world of trading, one of the main concerns is finding a reliable trading system. Meet the TrendEdge Channel indicator - your reliable companion in this search. Developed based on complex mathematical calculations, this indicator predicts the most likely short-term price movements. TrendEdge Channel is designed specifically to identify trends in price movements. Thanks to it, you can quickly determine not only the direction of the trend, but also the levels of interaction between buyers
With the growth of information technology and the increasing number of participants in financial markets, traditional analysis tools are becoming less effective. Conventional technical indicators, such as the moving average or stochastic, in their pure form are unable to accurately determine the direction of the trend or its reversal. Is it possible to find an indicator that remains effective for 14 years without changing its parameters, and at the same time adapts to market changes? Yes, such
Misio - can be used as an independent trading system. The indicator determines the market trend, ignoring sharp fluctuations and noise around the average price. It displays the trending movement with potential stop points. Simple, clear and effective use. The indicator does not redraw and does not lag. Suitable for all currency pairs and all timeframes. Interpretation: The location of the rate above or below the shadows indicates the presence of a trend. A move into the shadows signals a pos
Trend Divergence Indicator: Your Essential Tool for Market Analysis The Trend Divergence Indicator is a powerful tool designed to assist traders in identifying market trends and pinpointing entry points with precision. By leveraging price divergence, this indicator enhances your trading strategy, offering reliable insights and filtering unnecessary signals. Key Features and Benefits of the Trend Divergence Indicator Accurate Trend Analysis: The Trend Divergence Indicator uses price divergence t
The "BioStar" indicator is an innovative tool for trend analysis on the Forex market. It has unique capabilities and a wide range of settings that will help traders make informed decisions when trading. This indicator is based on the analysis of the market trend and helps to identify the direction of price movement. It uses various mathematical algorithms and statistical methods to determine the strength and stability of the trend in the market. One of the key features of the "BioStar" indica
Core Drift Index: Your Reliable Guide in the World of Trading Core Drift Index is an innovative trend indicator designed for precise detection of market directions and reversal points . This powerful tool enables traders to optimize their investments , minimize risk, and maximize profit. Key Features and Benefits Intuitive Trend Detection Core Drift Index clearly shows trend direction, helping traders make timely entry and exit decisions. High Probability of Success With its high accuracy
Warp Range Sensor: The Color of Your Trend Warp Range Sensor is a trend direction indicator that visually displays the current market condition by coloring bars red and blue based on trend direction. What Does Warp Range Sensor Do? Identifies the Current Trend Direction Blue bars indicate an uptrend Red bars signal a downtrend Universal Application Compatible with all currency pairs and timeframes , from short-term scalping to long-term trading. Powered by Market Context & Historical Data W
Pointer Trend Switch — precision trend reversal indicator Pointer Trend Switch is a high-precision arrow indicator designed to detect key moments of trend reversal based on asymmetric price behavior within a selected range of bars. It identifies localized price impulses by analyzing how far price deviates from the opening level, helping traders find accurate entry points before a trend visibly shifts. This indicator is ideal for scalping, intraday strategies, and swing trading, and performs equa
TrendCore Adaptive FX — Smart Expert Advisor for Confident and Adaptive Forex Trading TrendCore Adaptive FX   is a powerful, fully automated trading robot designed for consistent performance in the Forex market. It combines trend-based technical analysis, adaptive lot management, and solid capital protection strategies to ensure robust and efficient trading under real market conditions. Whether you're a professional trader or a long-term investor, this EA offers an intelligent solution to a
FlexiTrade Bot: Trade Smart, Not Blind Ditch the guesswork.   FlexiTrade Bot   is more than just a trading tool — it’s an intelligent trading engine built for traders who value   speed, precision, and adaptability . With real-time market analysis and pattern recognition, FlexiTrade delivers actionable signals with razor-sharp accuracy so you can focus on results, not reaction.   What Sets FlexiTrade Apart? Market Structure Awareness Unlike bots that rely on rigid indicator rules,   FlexiTr
AlphaTrader: Your Intelligent Partner in Forex Trading AlphaTrader   is an advanced trading system that utilizes automated analysis and trading strategies to optimize decision-making in the Forex market. Built using geometric patterns and cutting-edge algorithms, this bot detects pricing patterns, providing precise signals for successful trades.   Why Choose AlphaTrader? AlphaTrader is not just a trading bot; it’s a   full-fledged partner   designed to help you manage your capital as efficien
Acceleration Bias — Price Acceleration Impulse Indicator Acceleration Bias   is a modern analytical tool designed to measure changes in price acceleration and visualize impulse asymmetry using a robust mathematical model. This indicator is intended for traders working with market volatility, impulse phases, and price-movement structure, as well as those who need algorithmic, rule-based analytical support. Purpose and Core Concept Unlike traditional oscillators that analyze only velocity changes
Structural Equilibrium: A New Era of Adaptive Market Analysis As information technology advances and market participation grows, traditional analytical tools often face declining efficiency. Standard technical indicators frequently struggle to interpret the complexities of modern, algorithm-driven market structures. Structural Equilibrium was developed as a high-performance solution featuring a multi-level adaptive smoothing mechanism. This core logic allows the tool to maintain its analytical r
Phase Analytics Pro: Advanced Cyclic Market Analyzer Phase Analytics Pro is a sophisticated technical tool designed for traders who prioritize mathematical precision over lag-heavy traditional indicators. Based on the principles of digital signal processing, this indicator decomposes price action into phase and quadrature components to identify the dominant market cycle. How it works: The algorithm calculates the instantaneous phase of the market, allowing it to distinguish between trending and
Ось відформатований текст без альтернативних назв у дужках: Latency Edge Scalpel Latency Edge Scalpel is a high-frequency, institutional-grade trading solution engineered for high-precision scalping in the decentralized Forex market. This is not a simple grid or martingale bot; it is a sophisticated mathematical tool designed to exploit micro-structural price gaps and momentary volatility imbalances. The Algorithmic Core At its heart, Latency Edge Scalpel operates on a hybrid volatility-filterin
Sub Algo is a revolutionary indicator for MQL4/MQL5 that transforms how algorithmic strategies are built and executed. Instead of writing endless if–else conditions, Sub Algo provides a complete visual configuration system with: 6 independent logical operations Adaptive thresholding Automatic Buy/Sell symmetry Simple dropdown menus and input parameters This is not a library . This is a ready-to-use professional indicator that converts any combination of technical indicators into precise logical
Orynth P&F Chart Overlay – Clean Trend Visualizer Orynth is a professional technical analysis tool that brings the power of Point and Figure (P&F) charting directly onto your standard candlestick chart. It filters out market noise by focusing solely on meaningful price movement, allowing traders to identify clear trends and reversals without the distraction of minor fluctuations. Unlike traditional P&F charts that open in a separate window, Orynth overlays price "boxes" directly on your main cha
The Plasma Trend indicator is a simple technical indication that is used to determine the current trend direction in the market. The Plasma Trend indicator is a powerful tool for determining the direction of the trend in the Forex market. It is based on both standard technical indicators and proprietary mathematical calculations, which provides a more accurate and reliable trend determination. Its implementation in the form of lines of two colors simplifies the visual determination of a change
Cryo
Sabina Fik
5 (1)
Cryo is based on the process of identifying the rate of change in price growth and allows you to find entry and exit points from the market. A fundamental technical indicator that allows you to assess the current market situation in order to enter the market of the selected currency pair in a trend and with minimal risk. The Cryo indicator was created on the basis of the original indicators for searching for extremes, the indicator is well suited for determining a reversal or a large sharp jer
The Angle Prices indicator is a tool that calculates the price angle based on price analysis, interpreting the time vector in the form of price points on the price chart. In other words, the X axis and Y axis are represented as price points, so you can actually calculate the angle with two axes of the same dimension. This allows traders to obtain information about the direction of price movement and possible entry or exit points for trades. Let's look at the main characteristics and interpretat
The " Fortune Long " bot works using pending orders and reacts to a channel breakdown with the direction of work in the channel; it is necessary to correctly calculate the levels of entry, stop loss, take profit, and the level of deviation of the pending order from the price. The bot needs to be optimized for 2 years with a forward period of 1/2. Once optimization is complete, select the best settings and save them. Work for 6 months. The bot automatically calculates all levels and the entry le
PricePulse Pro - Indicator of Simple Solutions! Using this indicator is very easy - just follow the colored arrows on the chart. The indicator algorithm takes into account daily price fluctuations and focuses on measuring the "candlestick" share in the trend. This indicator uses an algorithm that considers price changes based on various parameters such as H/C (high price/close), H/O (high price/open), LC (low price/close), LO (low price/open). This allows for a more detailed analysis of price
The "Trend Orbital" indicator is a tool for tracking trends in the financial asset market. It is based on the analysis of price data and provides a visual interpretation of the current direction of price movement. Options: InpAmplitude: Amplitude - determines the amount of volatility that the indicator takes into account when determining the trend. Group "Arrow": InpCodeUpArrow: Up Arrow Code - Defines the arrow symbol to display an uptrend. InpCodeDnArrow: Down Arrow Code - Defines the arrow
The Market Might indicator, despite its apparent simplicity, is based on complex analytical algorithms that allow you to accurately determine the moments of entry and exit from transactions. The signals generated by this indicator are accurate and timely, appearing directly on the current candle. The main task of the Market Might indicator is to determine the moments of entry and exit from trades. Therefore, it displays only the trend line and entry points, which provides a clear view of the m
This technical analysis indicator allows you to determine with high probability whether a trend or a flat pattern prevails in the market. It can be used both for trading within a channel and for breakout trading, provided that stop losses are used to protect against false signals. The indicator displays the channel in the form of lines located above and below the price, like other similar indicators. The upper and lower lines can also act as resistance and support levels. It quite accurately
Determining the current market trend is a key task for successful trading. It is for this purpose that the Book Scheme indicator was developed, which is an advanced algorithm for visually displaying a trend on a chart. Many traders dreamed of having reliable moving averages that kept up with the market. It was this dream that I turned into reality with the help of my indicator. Book Scheme allows you to predict future values ​​and create accurate signals for entering and exiting the market. T
Balanced Work Indicator: Your Gateway to Trend Trading Balanced Work is a trend-following indicator designed to simplify market analysis and trading decisions. This algorithmic tool draws two-colored dots along the price chart, connected by lines, offering a clear visual representation of market trends. The simplicity of this indicator lies in its color-coded signals: buy when a blue dot appears and sell when a red dot appears. It is particularly effective for scalping and pipsing, and it has p
フィルタ:
レビューなし
レビューに返信