RiskSentry
- Utilità
-
Kaan Caliskan
 All the products in my profile are for sale, complete with source code and all sales rights. If you are interested, please contact me via private message or at fxkaanc@gmail.com
Ingegnere di Trading Algoritmico, Economista & Gestore di Fondi | 13+ Anni sui Mercati - Versione: 1.0
Stop guessing your risk. Visualize it.
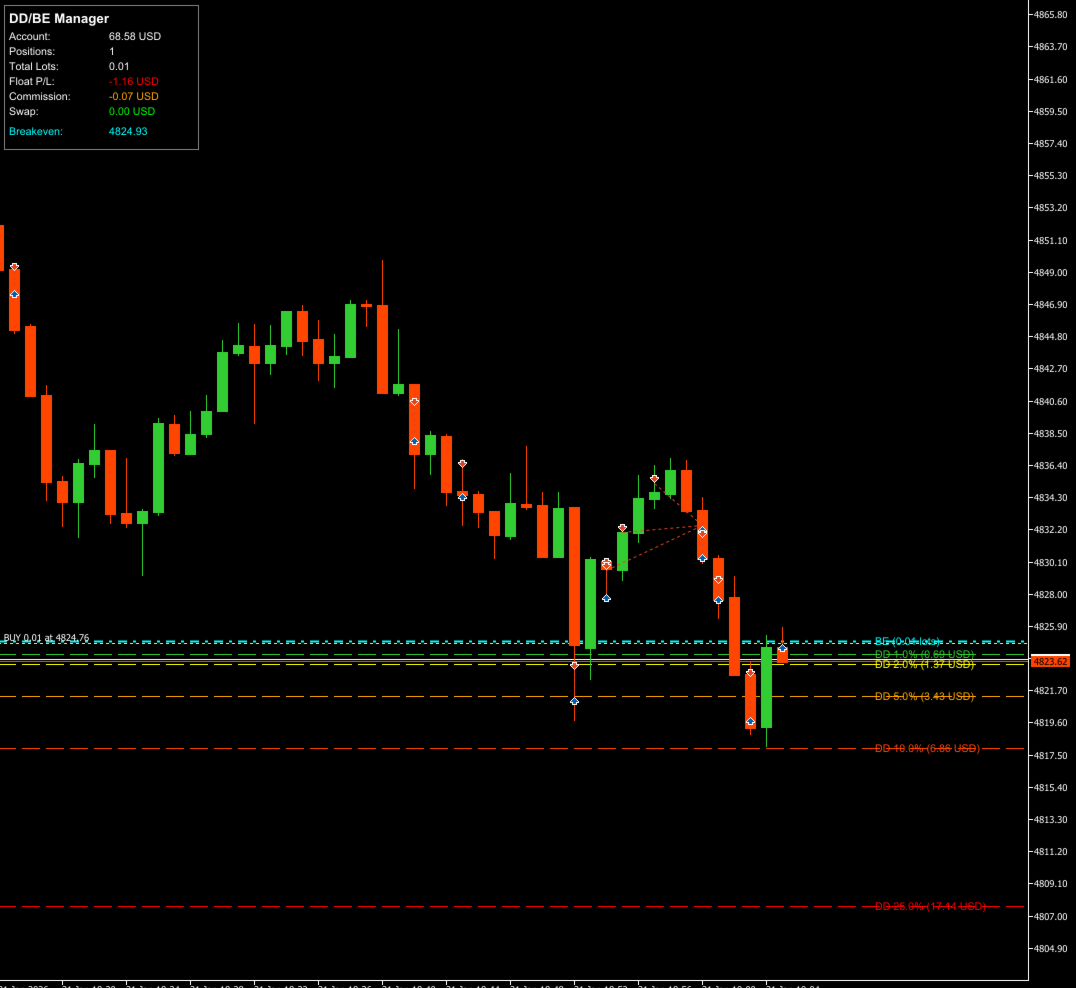
RiskSentry is the ultimate utility for manual and algorithmic traders who need to monitor their exposure in real-time. It automatically calculates and draws precise Drawdown (DD) Lines and a True Breakeven (BE) Line directly on your chart, factoring in commissions and swaps.
Whether you are managing a grid of positions, a single trade, or a complex basket, RiskSentry keeps you aware of your exact risk levels and your "Get Out Free" price.
Why You Need RiskSentry
Traders often fail because they lose track of their floating P/L in relation to their account balance. RiskSentry solves this by projecting your risk percentages onto the chart as price levels.
-
Psychological Edge: See exactly where your account will hit -5%, -10%, or -50% drawdown.
-
True Breakeven: Most indicators only show the average price. RiskSentry calculates the Real Breakeven by including your broker's Commissions and accrued Swap/Rollover fees.
-
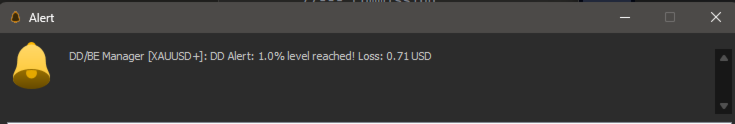
Never Miss a Level: Get instant alerts (Popup, Sound, or Push Notification) when price hits a DD level or touches your Breakeven point.
Key Features
-
6 Customizable Drawdown Levels: Set specific risk percentages (e.g., 1%, 2%, 5%, 10%) based on Balance or Equity.
-
Smart Breakeven Calculation: Automatically calculates the weighted average entry of all open positions (Net Lots), adjusted for swaps and commissions.
-
Multi-Position Support: Works perfectly with single trades, hedged positions, or grid systems.
-
Real-Time Dashboard: A sleek info panel showing Total Lots, Float P/L, Total Commission, Swap, and the precise BE price.
-
Advanced Filtering: Monitor all positions, or filter by specific Magic Numbers or Symbols.
-
Full Alert System:
-
DD Alerts: Know when your drawdown deepens.
-
BE Touch Alert: Know immediately when price returns to breakeven so you can exit safely.
-
How It Works
-
Drawdown Lines: The EA calculates how much the price needs to move against your net position to lose a specific percentage of your account. It draws a line at that price.
-
Breakeven Line: It sums up the total volume, open prices, commissions, and swaps. It then calculates the exact price where the net result is $0.00.
Input Parameters
General Settings
-
Magic Number Filter : Comma-separated list of Magic Numbers to monitor (e.g., "12345, 67890"). Leave empty to monitor all manual/algo trades.
-
Symbol Filter : Leave empty to monitor only the current chart symbol.
-
Calculation Mode : Choose between Balance or Equity as the base for percentage calculations.
Drawdown Levels
-
Enable DD Lines : Toggle the visualization of risk lines.
-
DD Level 1-6 (%) : The percentage of account risk to visualize (e.g., set to 5.0 for a 5% risk line). Set to 0 to disable specific lines.
Breakeven Settings
-
Enable BE Line : Toggle the True Breakeven line.
-
Commission per Lot : Crucial Setting. Enter the round-trip commission of your broker (e.g., 7.0) for accurate BE calculation.
-
Include Swap : If true, the BE line will move daily as swap is charged/paid.
Alerts & Display
-
Alert Type : Choose from Popup, Sound, Push Notification, or All.
-
Panel Settings : Customize the dashboard color, text size, and position on the screen.
Tips for Users
-
For Prop Firm Traders: Set the DD Levels to your Daily Loss Limit (e.g., 4%) and Max Trailing Drawdown (e.g., 9%) to visually see how much room you have left.
-
For Grid Traders: Use the Breakeven line to see exactly where your basket of trades can be closed without a loss, covering all fees.
Take control of your risk management today with RiskSentry.
Copyright © 2026, Kaan C.
L'utente non ha lasciato alcun commento sulla valutazione.