NosTraderMus LinearRegressionBands

LinearRegressionBands — Segnali intelligenti con canali di regressione + RSI

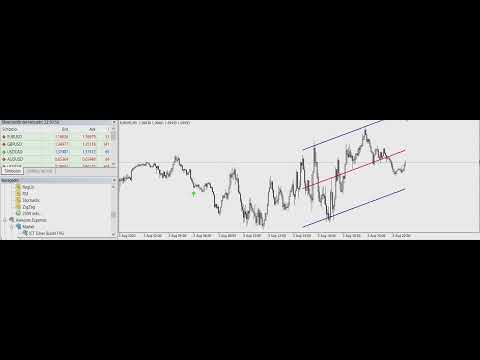
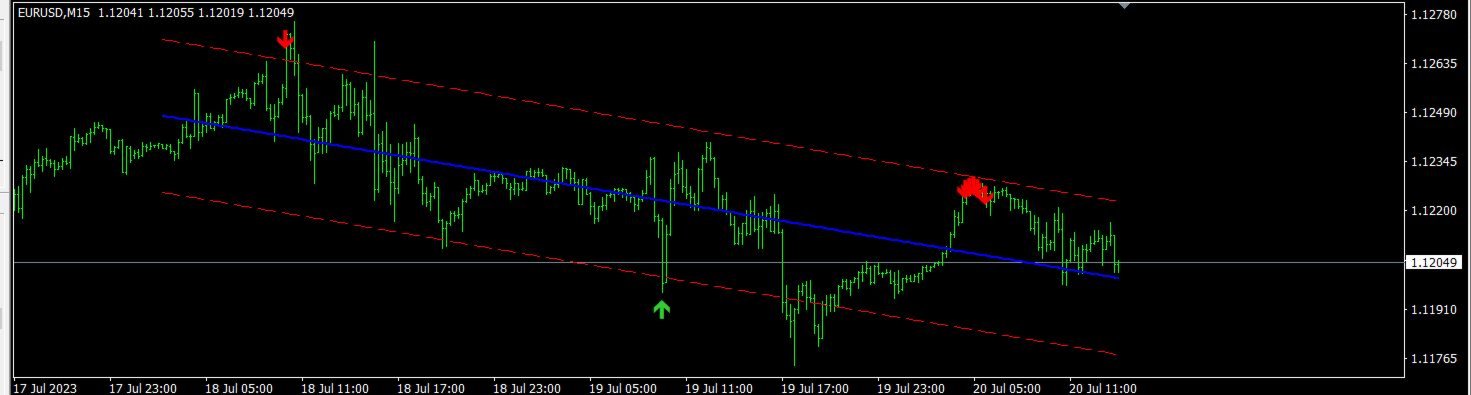
Trasforma la lettura del mercato in una decisione chiara e visiva. LinearRegressionBands traccia una retta di regressione lineare sulla finestra dei prezzi più recente e genera canali dinamici (± deviazioni standard) per individuare le aree di eccesso. Le frecce di ingresso compaiono solo in presenza di una reale rottura della banda accompagnata da una conferma RSI in zona estrema; in opzione, puoi richiedere che la pendenza della regressione sia allineata al segnale (modalità “solo in trend”).

Cosa risolve

  • Pullback ad alta probabilità: in modalità “solo in trend”, cerca acquisti sui ritracciamenti con pendenza rialzista e vendite sui rimbalzi con pendenza ribassista.

  • Eccessi con ritorno controllato alla media: disattivando il vincolo di trend, cattura eccessi quando le bande vengono rotte con un RSI estremo — utile per strategie contro-tendenza accuratamente filtrate.

  • Meno rumore rispetto a canali orizzontali: a differenza delle bande classiche, i canali di regressione si inclinano con il prezzo, si allineano alla direzione dominante e riducono i falsi segnali.

Vantaggi chiave

  • Segnali chiari e oggettivi: frecce solo quando la banda viene rotta (senza tolleranze) e l’RSI conferma l’estremo.

  • Modalità Trend con un singolo parametro: imposta OnlyInTrend=true per richiedere pendenza favorevole (m>0 per acquisti, m<0 per vendite). Ideale per “comprare sui ribassi” e “vendere sui rimbalzi” nel trend.

  • Multi-asset e multi-timeframe: funziona su FX, indici, materie prime, crypto e su qualunque orizzonte temporale.

  • Frecce senza repaint: valutazione su candela chiusa (RSI_Shift=1 di default), evitando modifiche a posteriori.

  • Leggero e stabile: calcoli ottimizzati che non appesantiscono la piattaforma.

Come funziona (in breve)

  1. Calcola la regressione lineare su RegPeriod candele e la deviazione standard dei residui.

  2. Disegna la linea centrale e le bande superiore/inferiore = linea ± StdDevFactor × sigma.

  3. Acquisto: se il minimo della candela chiusa rompe la banda inferiore e l’RSI < RSI_Oversold (e, se OnlyInTrend=true, pendenza m>0).
    Vendita: se il massimo supera la banda superiore e l’RSI > RSI_Overbought (e, se OnlyInTrend=true, pendenza m<0).

  4. Traccia una freccia nel punto di segnale.

Stili d’uso consigliati

  • Seguito di trend (pullback con conferma): OnlyInTrend=true. Uscite tipiche: linea centrale, banda opposta o RSI che ritorna verso 50.

  • Contro-tendenza selettivo: OnlyInTrend=false con soglie RSI più rigorose (ad es. 80/20). Preferibili timeframe superiori e mercati in range.

  • Approccio top-down: definisci il trend su H4/D1 ed esegui i segnali su M15/H1 (mantieni RSITimeframe = PERIOD_CURRENT o prova RSI su TF superiore).

Configurazioni suggerite (punti di partenza)

  • Scalping M5–M15: RegPeriod 14–20, StdDevFactor 1.8–2.2, RSI 7–14, RSI_Overbought 75–80, RSI_Oversold 20–25, OnlyInTrend=true.

  • Intraday M15–H1: RegPeriod 20–40, StdDevFactor 2.0, RSI 14, soglie 70/30, OnlyInTrend=true.

  • Swing H4–D1: RegPeriod 50–100, StdDevFactor 2.0–2.5, RSI 14, soglie 65/35 o 60/40 in base alla volatilità, OnlyInTrend=true.

Parametri esterni: significato e come configurarli

RegPeriod (int, default 20)
Numero di candele per la regressione.
Effetto: periodi più brevi = maggiore sensibilità (più segnali, più rumore); più lunghi = maggiore scorrevolezza (meno segnali, qualità superiore).
Suggerimento: intraday 14–40; swing 50–100.

StdDevFactor (double, default 2.0)
Moltiplicatore della deviazione standard che definisce l’ampiezza delle bande.
Effetto: valore più alto = bande più larghe (meno tocchi, segnali più selettivi).
Suggerimento: 2.0 è uno standard robusto; portare a 2.5 su mercati molto volatili.

PriceType (int, 0=Close; 1=Open; 2=High; 3=Low; 4=Average; 5=Typical)
Prezzo di base per costruire regressione/bande.
Effetto: Close è il più comune; Typical (H+L+C)/3 attenua gli estremi; Average (O+C)/2 è anch’esso stabile.
Suggerimento: lascia Close salvo necessità specifiche di smoothing.

RSIPeriod (int, default 14)
Lunghezza dell’RSI.
Effetto: più breve = RSI più reattivo; più lungo = più stabile.
Suggerimento: standard 14; scalping 7–10; swing 14–21.

RSITimeframe (ENUM_TIMEFRAMES, default PERIOD_CURRENT)
Timeframe su cui viene calcolato l’RSI.
Effetto: un TF superiore filtra il rumore (conferma più lenta).
Suggerimento: mantieni quello attuale; per filtro macro prova un TF più alto.

RSI_Overbought (double, default 70.0)
Soglia di ipercomprato (per vendite).
Effetto: più alta è la soglia, meno frequenti ma più estreme le segnalazioni.
Suggerimento: intraday 70–80; in ampi range, preferisci 80.

RSI_Oversold (double, default 30.0)
Soglia di ipervenduto (per acquisti).
Effetto: più bassa è la soglia, meno frequenti ma più estreme le segnalazioni.
Suggerimento: intraday 20–30; in ampi range, preferisci 20.

RSI_Shift (int, default 1)
Candela utilizzata per confermare il segnale (1 = candela chiusa).
Effetto: con 1 eviti il repaint delle frecce; 0 segnalerebbe sulla candela in formazione (non consigliato).
Suggerimento: lascialo a 1.

OnlyInTrend (bool, default true)
Richiede che la pendenza della regressione sia coerente con la direzione dell’operazione.
Effetto: true → acquisto solo con m>0 e vendita solo con m<0 (pullback in trend). false → ignora la pendenza (utile per setup contro-tendenza filtrati).
Suggerimento: true per la maggior parte delle strategie; false solo se padroneggi bene i mercati in range.

Buone pratiche e gestione dell’operazione
Stop-loss: sotto/sopra il minimo/massimo della candela di segnale, oppure una frazione della banda opposta.
Take-profit: linea centrale, banda opposta, oppure uscita quando l’RSI ritorna verso 50.
Filtro aggiuntivo: evita finestre di notizie macro ad alto impatto se il tuo strumento è sensibile; valuta un filtro di volatilità basato su ATR per il dimensionamento della posizione.

Importante: questo indicatore non costituisce consulenza finanziaria e non garantisce risultati. Utilizzalo con un piano di risk management definito e testalo su conto demo prima dell’operatività reale.


Prodotti consigliati
L'indicatore SMC Venom Model BPR è uno strumento professionale per i trader che operano nell'ambito del concetto di Smart Money (SMC). Identifica automaticamente due modelli chiave sul grafico dei prezzi: FVG   (Fair Value Gap) è una combinazione di tre candele, in cui c'è un gap tra la prima e la terza candela. Forma una zona tra livelli in cui non c'è supporto di volume, il che spesso porta a una correzione dei prezzi. BPR   (Balanced Price Range) è una combinazione di due modelli FVG che for
Volume Profile Sniper v11. 1 è uno strumento completo per l'analisi di mercato Un approccio professionale al trading Volume Profile Sniper v11.1 integra più di 15 filtri chiave in un unico indicatore, fornendo segnali chiari basati su una valutazione completa della situazione del mercato. Caratteristiche principali Analisi dello squilibrio di volume-l'algoritmo calcola la percentuale di acquirenti e venditori in ciascuna candela, segnalando la predominanza di una delle parti (soglia configurab
VR Cub
Vladimir Pastushak
VR Cub è un indicatore per ottenere punti di ingresso di alta qualità. L'indicatore è stato sviluppato per facilitare i calcoli matematici e semplificare la ricerca dei punti di ingresso in una posizione. La strategia di trading per la quale è stato scritto l'indicatore ha dimostrato la sua efficacia per molti anni. La semplicità della strategia di trading è il suo grande vantaggio, che consente anche ai trader alle prime armi di commerciare con successo con essa. VR Cub calcola i punti di apert
Blahtech Market Profile
Blahtech Limited
4.53 (15)
Was: $249  Now: $99   Market Profile defines a number of day types that can help the trader to determine market behaviour. A key feature is the Value Area, representing the range of price action where 70% of trading took place. Understanding the Value Area can give traders valuable insight into market direction and establish the higher odds trade. It is an excellent addition to any system you may be using. Blahtech Limited presents their Market Profile indicator for the MetaTrader community. Ins
Indicatore di gestione del rischio e monitoraggio dei limiti per trader professionisti e account di valutazione (Prop) Questo strumento visualizza esclusivamente sul grafico informazioni precise su gestione del rischio e limiti, per aiutarti a decidere con maggiore concentrazione. L’indicatore non apre/chiude/modifica operazioni e non interferisce con gli Expert Advisor. Caratteristiche Monitoraggio del drawdown giornaliero e totale Calcola e mostra il drawdown giornaliero e totale in base a Ba
Market Profile 3
Hussien Abdeltwab Hussien Ryad
3 (2)
Market Profile 3 MetaTrader 4 indicator  — is a classic Market Profile implementation that can show the price density over time, outlining the most important price levels, value area, and control value of a given trading session. This indicator can be attached to timeframes between M1 and D1 and will show the Market Profile for daily, weekly, monthly, or even intraday sessions. Lower timeframes offer higher precision. Higher timeframes are recommended for better visibility. It is also possible t
FREE
Auto Fibo Pro m
DMITRII GRIDASOV
Indicatore "Auto FIBO Pro" Crypto_Forex: è un ottimo strumento ausiliario nel trading! - L'indicatore calcola e posiziona automaticamente sul grafico i livelli di Fibo e le linee di tendenza locali (colore rosso). - I livelli di Fibonacci indicano le aree chiave in cui il prezzo può invertirsi. - I livelli più importanti sono 23,6%, 38,2%, 50% e 61,8%. - Puoi usarlo per lo scalping di inversione o per il trading di zone grid. - Ci sono molte opportunità per migliorare il tuo sistema attuale usa
Daily Candle Predictor è un indicatore che prevede il prezzo di chiusura di una candela. L'indicatore è destinato principalmente all'uso sui grafici D1. Questo indicatore è adatto sia per il trading forex tradizionale che per il trading di opzioni binarie. L'indicatore può essere utilizzato come sistema di trading autonomo o può fungere da aggiunta al sistema di trading esistente. Questo indicatore analizza la candela corrente, calcolando alcuni fattori di forza all'interno del corpo della cande
SX Supply Demand Zones accurately identifies and draws high-probability Supply and Demand zones using a sophisticated algorithm. Unlike traditional indicators that clutter your chart, this indicator is designed with a focus on performance and a clean user experience. New Unique Feature: Interactive Legend System What truly sets this indicator apart from everything else is the Interactive Control Legend. You have a professional dashboard directly on your chart that allows you to: Show/Hide: Ins
FREE
The indicator allows you to trade binary options. The recommended time frame is М1 and the expiration time is 1,2,3 minutes. The indicator suitable for auto and manual trading. A possible signal is specified as a arrows above/under a candle. You should wait until the candle closes! Arrows are not re-painted Trade sessions: TOKYO section (Half-end) Currency pairs: USD/JPY Working time frame: M1 Expiration time: 1,2,3 minutes. The indicator also shows good results when using the martingale strateg
FREE
EARLY REMINDER: The Starting price is 65 price will rise soon up to 365$ and then 750$ after first 10 copies of sales. Grab this offer now! Introduction Hello, traders! Welcome to the demonstration of the Forex Beast Indicator , a comprehensive tool designed to assist aspiring traders in navigating the complexities of the forex market. This indicator incorporates seven essential components to provide a well-rounded trading experience: Moving Averages Colored Zones Support and Resistance Levels
Price Magnet — Price Density and Attraction Levels Indicator Price Magnet is a professional analytical tool designed to identify key support and resistance levels based on statistical Price Density. The indicator analyzes a specified historical period and detects price levels where the market spent the most time. These zones act as “magnets,” attracting price action or forming a structural base for potential reversals. Unlike traditional Volume Profile tools, Price Magnet focuses on price-time d
Antabod Gamechanger
Rev Anthony Olusegun Aboderin
*Antabod GameChanger Indicator – Transform Your Trading!*   Are you tired of chasing trends too late or second-guessing your trades? The *Antabod GameChanger Indicator* is here to *revolutionize your trading strategy* and give you the edge you need in the markets!   Why Choose GameChanger? *Accurate Trend Detection* – GameChanger identifies trend reversals with *pinpoint accuracy*, ensuring you enter and exit trades at the optimal time.   *Clear Buy & Sell Signals* – No more guesswork! T
Trend Ray
Andriy Sydoruk
The indicator shows the potential trend direction by cyclical-wave dependence. Thus, all the rays of the intersection will be optimal rays, in the direction of which the price is expected to move, taking into account the indicator period. Rays can be used as a direction for potential market movement. But we must not forget that the approach must be comprehensive, the indicator signals require additional information to enter the market.
PZ Harmonacci Patterns
PZ TRADING SLU
3.17 (6)
Trade smarter, not harder: Empower your trading with Harmonacci Patterns This is arguably the most complete harmonic price formation auto-recognition indicator you can find for the MetaTrader Platform. It detects 19 different patterns, takes fibonacci projections as seriously as you do, displays the Potential Reversal Zone (PRZ) and finds suitable stop-loss and take-profit levels. [ Installation Guide | Update Guide | Troubleshooting | FAQ | All Products  ] It detects 19 different harmonic pric
Noize Absorption Index MT4
Ekaterina Saltykova
5 (1)
Noize Absorption Index - is the manual trading system that measures the difference of pressure between bears forces and bulls forces. Green line - is a noize free index that showing curent situation. Zero value of index shows totally choppy/flat market.Values above zero level shows how powerfull bullish wave is and values below zero measures bearish forces.Up arrow appears on bearish market when it's ready to reverse, dn arrow appears on weak bullish market, as a result of reverse expectation. S
Cosmic Diviner X Planet
Olena Kondratenko
4 (2)
This unique multi-currency strategy simultaneously determines the strength of trends and market entry points, visualizing this using histograms on the chart. The indicator is optimally adapted for trading on the timeframes М5, М15, М30, Н1. For the convenience of users, the indicator renders the entry point (in the form of an arrow), recommended take profit levels (TP1, TP2 with text labels) and the recommended Stop Loss level. The take profit levels (TP1, TP2) are automatically calculated for
Indicatore Crypto_Forex "MFI FLAT Detector" - è un efficace strumento ausiliario per il trading! Nessuna rielaborazione. Ti offro di aggiornare i tuoi metodi di trading con questo fantastico indicatore per MT4. - L'indicatore mostra le aree di prezzo piatte sul grafico. Dispone del parametro "Sensibilità piatta", responsabile del rilevamento di zone piatte. - "MFI FLAT Detector" è molto utile per il rilevamento delle divergenze ed è ottimo anche da combinare con la Price Action. - Puoi usarlo n
Quantum Falcon Signal Free is a smart visual trading indicator for MetaTrader 4 designed for Forex and Gold traders. The indicator combines: • Trend analysis • RSI momentum confirmation • MACD momentum filtering • ATR volatility filtering • Higher timeframe confirmation • Smart exit signal detection Main Features: • Smart Buy and Sell signals • Exit Buy / Exit Sell alerts • Real-time dashboard on chart • Professional candle arrows • Multi-timeframe trend confirmation • ATR market volatility filt
FREE
The Th3Eng PipFinite indicator is based on a very excellent analysis of the right trend direction with perfect custom algorithms. It show the true direction and the best point to start trading. With StopLoss point and Three Take Profit points. Also it show the right pivot of the price and small points to order to replace the dynamic support and resistance channel, Which surrounds the price. And Finally it draws a very helpful Box on the left side on the chart includes (take profits and Stop loss
ProEngulfing
Ashkan Hazegh Nikrou
4.5 (2)
Presentazione di ProEngulfing - Il tuo Indicatore di Modelli Engulf Professionale per MT4 Sblocca il potere della precisione con ProEngulfing, un indicatore all'avanguardia progettato per identificare e evidenziare modelli engulf qualificati nel mercato del forex. Sviluppato per MetaTrader 4, ProEngulfing offre un approccio meticoloso al riconoscimento dei modelli engulf, garantendo che ricevi solo i segnali più affidabili per le tue decisioni di trading. Come funziona ProEngulfing: ProEngulfin
TWO PAIRS SQUARE HEDGE METER INDICATOR Try this brilliant 2 pairs square indicator It draws a square wave of the relation between your two inputs symbols when square wave indicates -1 then it is very great opportunity to SELL pair1 and BUY Pair2 when square wave indicates +1 then it is very great opportunity to BUY pair1 and SELL Pair2 the inputs are : 2 pairs of symbols         then index value : i use 20 for M30 charts ( you can try other values : 40/50 for M15 , : 30 for M30 , : 10 for H1 ,
Super Reversal Pattern
Parfait Mujinga Ndalika
Super Reversal Pattern Indicator Unlock the power of advanced pattern recognition with our Super Reversal Pattern Indicator. Designed for traders seeking precision and reliability, this indicator identifies one of the most effective reversal patterns in technical analysis, offering a significant edge in your trading strategy. Key Features: Non-Repainting Accuracy: Enjoy the confidence of non-repainting technology. Once a Super Reversal Pattern is detected, it remains static, providing consiste
KT Renko Patterns MT4
KEENBASE SOFTWARE SOLUTIONS
2.33 (3)
KT Renko Patterns analizza il grafico Renko mattone per mattone per individuare i pattern grafici più famosi, frequentemente utilizzati dai trader nei vari mercati finanziari. Rispetto ai grafici basati sul tempo, i grafici Renko rendono il trading basato sui pattern più semplice e visivamente chiaro grazie alla loro struttura pulita. KT Renko Patterns include diversi pattern Renko, molti dei quali sono ampiamente spiegati nel libro “Profitable Trading with Renko Charts” di Prashant Shah. Un E
Il nostro indicatore Basic Support and Resistance è la soluzione necessaria per aumentare l'analisi tecnica.Questo indicatore consente di proiettare i livelli di supporto e resistenza sul grafico/ MT5 gratuita Funzionalità Integrazione dei livelli di Fibonacci: Con la possibilità di visualizzare i livelli di Fibonacci insieme a livelli di supporto e resistenza, il nostro indicatore ti dà una visione ancora più profonda del comportamento del mercato e delle possibili aree di inversione. Ottimi
For sure, this indicator has become very popular amongst traders. Through coding this indicator will give you the most accurate levels possible for your trading analysis. We have also added in the ability for you to receive alerts when the price breaks above or below a Support or Resistance lines! HOW TO USE The red rectangles represent your resistance/supply zone. The green rectangles represent your support/demand zone.  BONUS FEATURES We coded this indicator with the ability to switch between
We present you the indicator "Candle closing counter", which will become your indispensable assistant in the world of trading. That’s why knowing when the candle will close can help: If you like to trade using candle patterns, you will know when the candle will be closed. This indicator will allow you to check if a known pattern has formed and if there is a possibility of trading. The indicator will help you to prepare for market opening and market closure. You can set a timer to create a pre
Fibonacci retracement and extension line drawing tool Fibonacci retracement and extended line drawing tool for MT4 platform is suitable for traders who use  golden section trading Advantages: There is no extra line, no too long line, and it is easy to observe and find trading opportunities Trial version: https://www.mql5.com/zh/market/product/35884 Main functions: 1. Multiple groups of Fibonacci turns can be drawn directly, and the relationship between important turning points can be seen
This is a new strategy for SUPPLY DEMAND areas It is based on a calculation using the tick volume to detect the big price action in market for both bear /bull actions this smart volume action candles are used to determine the supply and demand areas prices in between main supply and demand lines indicate sideway market  up arrows will be shown when prices moves above the main supply and the secondary supply lines Down arrows will be shown when prices moves below the main demand and the secondary
L'indicatore costruisce le quotazioni attuali, che possono essere confrontate con quelle storiche e su questa base fanno una previsione del movimento dei prezzi. L'indicatore ha un campo di testo per una rapida navigazione fino alla data desiderata. Opzioni: Simbolo - selezione del simbolo che visualizzerà l'indicatore; SymbolPeriod - selezione del periodo da cui l'indicatore prenderà i dati; IndicatorColor - colore dell'indicatore; HorisontalShift - spostamento delle virgolette disegnate d
Gli utenti di questo prodotto hanno anche acquistato
Neuro Poseidon MT4
Daria Rezueva
4.94 (33)
Neuro Poseidon is a new indicator by Daria Rezueva. It combines precise trading signals with adaptive TP/SL levels - creating best possible trades as a result! Message me and get  Neuro Poseidon Assistant  as a gift to automize your trading process! What makes it stand out? 1. Proven profitability on all assets and timeframes 2. Only confirmed BUY and SELL signals present on the chart 3. Adaptive TP & SL levels generated by the software for each trade 4. Easy to understand - suitable for all
Dynamic Forex28 Navigator
Bernhard Schweigert
4.43 (7)
Dynamic Forex28 Navigator - Lo strumento di trading Forex di nuova generazione. ATTUALMENTE SCONTATO DEL 49%. Dynamic Forex28 Navigator è l'evoluzione dei nostri indicatori popolari di lunga data, che combinano la potenza di tre in uno: Advanced Currency Strength28 Indicator (695 recensioni) + Advanced Currency IMPULSE con ALERT (520 recensioni) + CS28 Combo Signals (Bonus). Dettagli sull'indicatore https://www.mql5.com/en/blogs/post/758844 Cosa offre l'indicatore di forza di nuova generazione?
Questo indicatore è un indicatore per l'analisi automatica delle onde perfetto per il trading pratico! Caso... Nota:   non sono abituato a usare nomi occidentali per la classificazione delle onde a causa dell'influenza della convenzione di denominazione di Tang Lun (Tang Zhong Shuo Zen), ho chiamato l'onda base come   penna   e la banda dell'onda secondaria come   segmento   At allo stesso tempo, il segmento ha la direzione del trend. La denominazione   è principalmente segmento di trend   (que
KT Alpha Hunter Arrows MT4
KEENBASE SOFTWARE SOLUTIONS
La maggior parte degli indicatori a frecce ti dà un segnale e poi ti lascia capire da solo tutto il resto. KT Alpha Hunter Arrows ti offre un piano di trading completo. Ogni freccia di segnale viene visualizzata con un piano già tracciato: linea di ingresso, stop loss, quattro livelli di take profit e un verdetto edge in tempo reale che ti indica se quel simbolo e quel timeframe meritano di essere tradati in quel momento. Il pacchetto include un Trade Manager EA che gestisce l’esecuzione dopo il
Scalper Inside PRO
Alexey Minkov
4.74 (68)
Scalper Inside PRO Scalper Inside PRO is an intraday trend and scalping indicator for MetaTrader 4 that uses an exclusive algorithm to quickly detect market direction and key target levels. It automatically calculates entry, exit and multiple profit targets, and shows detailed performance statistics so you can see how different instruments and strategies performed. This helps you choose the most suitable trading instruments for the current market conditions. Additionally, you can easily integrat
Current event:  https://c.mql5.com/1/326/A2SR2025_NoMusic.gif R. Cos'è l'A2SR ?   * È un indicatore tecnico leader (nessuna riverniciatura, nessun ritardo). -- Guida : -- su https://www.mql5.com/en/blogs/post/734748/page4#comment_16532516 -- e https://www.mql5.com/en/users/yohana/blog A2SR ha una tecnica speciale per determinare i livelli di supporto (domanda) e resistenza (offerta). A differenza del modo ordinario che abbiamo visto in rete, A2SR ha un concetto originale nel determinare i li
MetaBands M4
Vahidreza Heidar Gholami
3.5 (6)
MetaBands uses powerful and unique algorithms to draw channels and detect trends so that it can provide traders with potential points for entering and exiting trades. It’s a channel indicator plus a powerful trend indicator. It includes different types of channels which can be merged to create new channels simply by using the input parameters. MetaBands uses all types of alerts to notify users about market events. Features Supports most of the channel algorithms Powerful trend detection algorith
Breakout Arrows Mt4
Michael Oko Oboh
5 (1)
Trend Breakout Arrows Indicator The Trend Breakout Arrows Indicator is a momentum-based signal tool designed to identify potential bullish and bearish breakout opportunities. It displays clear arrow signals directly on the price chart, helping traders quickly recognize possible trend changes and continuation setups. Up Arrow (Buy Signal) A magenta up arrow appears below a candle when bullish momentum begins to strengthen. This signal indicates that buying pressure may be overtaking selling press
IQ FX Gann Levels a precision trading indicator based on W.D. Gann’s square root methods . It plots real-time, non-repainting support and resistance levels to help traders confidently spot intraday and scalping opportunities with high accuracy. William Delbert Gann (W.D. Gann) was an exceptional market analyst, whose trading technique was based on a complex blend of mathematics, geometry, astrology, and ancient mathematics which proved to be extremely accurate. Setup & Guide:  Download  MT5 Ver
PZ Swing Trading
PZ TRADING SLU
5 (3)
Protect against whipsaws: revolutionize your swing trading approach Swing Trading is the first indicator designed to detect swings in the direction of the trend and possible reversal swings. It uses the baseline swing trading approach, widely described in trading literature. The indicator studies several price and time vectors to track the aggregate trend direction and detects situations in which the market is oversold or overbought and ready to correct. [ Installation Guide | Update Guide | Tro
Neo Wave PRO
Nikolay Raykov
5 (1)
Price & Time Market Structure Indicator A professional market structure tool that analyzes waves through both price and time — not price alone. Main Description NeoWave PRO is a professional market structure indicator for MetaTrader 4 designed for traders who want to move beyond traditional one-dimensional wave tools such as ZigZag, swing indicators, and basic high/low systems. Most wave indicators analyze only one thing: Price. But a real market wave is not only a price movement. A true wave de
GOLD Impulse with Alert
Bernhard Schweigert
4.67 (12)
Questo indicatore è una super combinazione dei nostri 2 prodotti Advanced Currency IMPULSE with ALERT  +   Currency Strength Exotics . Funziona per tutti i time frame e mostra graficamente l'impulso di forza o debolezza per le 8 valute principali più un simbolo! Questo indicatore è specializzato nel mostrare l'accelerazione della forza delle valute per qualsiasi simbolo come oro, coppie esotiche, materie prime, indici o futures. Primo nel suo genere, qualsiasi simbolo può essere aggiunto all
L'indicatore " Dynamic Scalper System " è progettato per il metodo di scalping, ovvero per il trading all'interno di onde di trend. Testato sulle principali coppie di valute e sull'oro, è compatibile con altri strumenti di trading. Fornisce segnali per l'apertura di posizioni a breve termine lungo il trend, con ulteriore supporto al movimento dei prezzi. Il principio dell'indicatore. Le frecce grandi determinano la direzione del trend. Un algoritmo per generare segnali per lo scalping sotto fo
È disponibile anche la versione MT5 https://www.mql5.com/it/market/product/170916 Versione Swing M30/H1/H4 disponibile Vuoi catturare i grandi movimenti? Gold Signal Swing Pro (M30/H1/H4). Obiettivo: $20-$80+ per trade. https://www.mql5.com/en/market/product/177643 KURAMA GOLD SIGNAL PRO (MT4) — Sistema di Trading XAUUSD Completo con Filtro a 7 Strati, TP/SL Automatico e Punteggio di Qualità NESSUN REPAINT. NESSUN RI
Enigmera
Ivan Stefanov
5 (8)
ENIGMERA: Il cuore del mercato Importante: La demo di MQL5.com funziona nel Strategy Tester e potrebbe non riflettere completamente le funzionalità di Enigmera. Consulta la descrizione, gli screenshot e il video per maggiori dettagli. Non esitare a inviarmi un messaggio se hai domande! Il codice dell'indicatore è stato completamente riscritto. La versione 3.0 aggiunge nuove funzionalità e corregge i bug accumulati dall'inizio dell'indicatore. Introduzione Questo indicatore e sistema di trading
Introduction to Fractal Pattern Scanner Fractal Indicator refers to the technical indicator that makes use of the fractal geometry found in the financial market. Fractal Pattern Scanner is the advanced Fractal Indicator that brings the latest trading technology after the extensive research and development work in the fractal geometry in the financial market. The most important feature in Fractal Pattern Scanner is the ability to measure the turning point probability as well as the trend probabi
Trend Lines PRO
Roman Podpora
5 (1)
LINEE DI TENDENZA PRO       Aiuta a capire dove il mercato sta realmente cambiando direzione. L'indicatore mostra reali inversioni di tendenza e punti in cui i principali attori rientrano. Vedi  Linee BOS   Cambiamenti di tendenza e livelli chiave su timeframe più ampi, senza impostazioni complesse o rumore inutile. I segnali non vengono ridisegnati e rimangono sul grafico dopo la chiusura della barra. VERSIONE MT 5     -      Svela il suo massimo potenziale se abbinato all'indicatore   RFI LEVE
The Propfolio Master Suite is the ultimate all-in-one analytical workstation for professional traders. Combining the power of the Beat The Market Maker (BTMM) methodology, Smart Money Concepts (SND/Liquidity), and Advanced Volume Profile, this suite replaces multiple different indicators with one optimized engine. Monitor up to 14 pairs simultaneously from a single chart, instantly identify market cycles, and seamlessly map institutional footprints with the click of a button. The Command Center
RFI levels PRO
Roman Podpora
5 (1)
L'indicatore mostra accuratamente i punti di inversione e le zone di ritorno dei prezzi in cui il       Principali attori   . Vedi dove si formano le nuove tendenze e prendi decisioni con la massima precisione, mantenendo il controllo su ogni operazione. VERSION MT5     -     Rivela il suo massimo potenziale se combinato con l'indicatore   TREND LINES PRO Cosa mostra l'indicatore: Strutture di inversione e livelli di inversione con attivazione all'inizio di un nuovo trend. Visualizzazione dei l
RelicusRoad Pro
Relicus LLC
4.65 (107)
RelicusRoad Pro: Sistema Operativo Quantitativo di Mercato 70% DI SCONTO ACCESSO A VITA (TEMPO LIMITATO) - UNISCITI A 2.000+ TRADER Perché la maggior parte dei trader fallisce anche con indicatori "perfetti"? Perché operano su Singoli Concetti isolati. Un segnale senza contesto è una scommessa. Per vincere serve CONFLUENZA . RelicusRoad Pro non è un semplice indicatore. È un Ecosistema Quantitativo completo . Mappa la "Fair Value Road", distinguendo tra rumore e rotture strutturali. Smetti di in
NAM Order Blocks
NAM TECH GROUP, CORP.
3.67 (3)
MT4 Multi-timeframe Order Blocks detection indicator. Features - Fully customizable on chart control panel, provides complete interaction. - Hide and show control panel wherever you want. - Detect OBs on multiple timeframes. - Select OBs quantity to display. - Different OBs user interface. - Different filters on OBs. - OB proximity alert. - ADR High and Low lines. - Notification service (Screen alerts | Push notifications). Summary Order block is a market behavior that indicates order collection
Questo prodotto è stato aggiornato per il mercato 2026 e ottimizzato per le ultime build di MT5. AVVISO DI AGGIORNAMENTO PREZZO: Smart Price Action Concepts è attualmente disponibile a $200 . Il prezzo aumenterà a $299 dopo i prossimi 30 acquisti . OFFERTA SPECIALE: Dopo l’acquisto, inviami un messaggio privato per ricevere un bonus gratuito + regalo . Prima di tutto, vale la pena sottolineare che questo strumento di trading è un indicatore non-repainting, non-redrawing e non-lagging, il che lo
Questo indicatore funziona con la teoria delle onde di Elliott in due modi: Modalità automatica: In questa modalità, l'indicatore rileverà automaticamente le cinque onde motrici sul grafico in conformità alla teoria delle onde di Elliott. Fornirà previsioni e individuerà potenziali zone di inversione. Inoltre, avrà la capacità di generare avvisi e messaggi push per informare i trader sugli sviluppi importanti. Questa funzionalità automatica semplifica il processo di identificazione e analisi dei
Advanced Market Footprint Profiles is a specialized market analysis tool, representing a customized volume distribution profile enhanced with Delta and Bid/Ask profiles. The indicator builds fixed horizontal profiles (Fixed Range), displaying the distribution of Volume, Delta, and Bid/Ask at each price level with high precision. Unlike standard horizontal volume profiles, which only show overall volume distribution, this indicator combines Volume, Delta, and Bid/Ask within the selected range a
MV Arrow– Professional Swing Signal Indicator comment for set files and user manual. MV Arrow v4.0 is a precision-based MT4 arrow indicator designed to identify high-probability swing BUY and SELL zones using a multi-filter confirmation system. It focuses on market extremes , filtering noise and low-quality signals to deliver clear, well-spaced trade opportunities . This indicator is ideal for traders who prefer clean charts, disciplined entries, and confirmation-based signals rather than co
Segnale GoldRush Trend Arrow L'indicatore GoldRush Trend Arrow Signal fornisce un'analisi precisa e in tempo reale dei trend, pensata appositamente per gli scalper ad alta velocità e a breve termine nel mercato XAU/USD. Progettato specificamente per il timeframe di 1 minuto, questo strumento mostra frecce direzionali che indicano chiari punti di ingresso, consentendo agli scalper di navigare con sicurezza nelle condizioni di mercato volatili. L'indicatore è composto da frecce di avviso PRIMA
Quants HL Break
Ferhat Mutlu
5 (2)
Calcolo avanzato fatto da pura azione sui prezzi per trovare breakout LH e HL. Ti darà un grande punto di inversione nel mercato.I segnali LH e HL possono essere utilizzati anche per i breakout di traingle. Una volta che si verifica un breakout, indica una forte inversione.Bel filtro per le medie mobili.Consiglio vivamente di usarlo con gli indicatori di tendenza. Può essere utilizzato come ulteriore conferma per supporto e resistenza, indicatori della domanda di offerta. Maggiori dettagli po
MR Volume Profile 4
Sergey Khramchenkov
The "MR Volume Profile 4" indicator is a charting tool that displays trading volume at different price levels rather than time intervals. A key concept in volume profile is the point of control (POC)—the price level with the highest volume traded during the session or time range. While tools like VWAP or OBV provide volume trends, the "MR Volume Profile 4" indicator offers granular detail about where the most market activity occurs at specific price levels. This makes it a more precise tool for
Kinetic Trend
Alexandr Lapin
5 (1)
Автор: Александр Лапин --- Описание: Kinetic Trend — уникальный индикатор, основанный на математической модели затухания кинетической энергии цены. Он строит три независимые инерционные линии (основную, реверсную и зеркальную), а также отображает адаптивные зоны отклонения и их пересечения. Индикатор не использует стандартные индикаторы, такие как Moving Average или RSI, и предлагает абсолютно новый способ визуализации тренда и силы движения. --- ️ Что делает индикатор: Три инерц
Quantum Breakout Indicator PRO
Bogdan Ion Puscasu
4.96 (26)
Presentazione       Quantum Breakout PRO   , l'innovativo indicatore MQL5 che sta trasformando il modo in cui scambi le zone di breakout! Sviluppato da un team di trader esperti con un'esperienza di trading di oltre 13 anni,   Quantum Breakout PRO   è progettato per spingere il tuo viaggio di trading a nuovi livelli con la sua strategia innovativa e dinamica della zona di breakout. Quantum Breakout Indicator ti fornirà frecce di segnalazione sulle zone di breakout con 5 zone target di profitt
Altri dall’autore
INDICATORE DI REGRESSIONE LINEARE ==>   L'indicatore rappresenta la linea di regressione lineare e le linee di supporto e resistenza, ottenute in base alla deviazione standard rispetto alla Regressione Lineare. Personalizzazione: è possibile regolare i seguenti valori: Rango Tendencia:   il numero di barre o periodi, all'interno del timeframe considerato, presi come riferimento per l'indicatore. AmpDesv:   l'ampiezza o il numero di volte per considerare la deviazione standard della regressione
NosTraderMus_RegLin_PRO EA (Expert Advisor) professionale con regressione lineare, filtri MTF e gestione attiva delle posizioni Consigliato: iniziare i test sul timeframe M5 (5 minuti). NosTraderMus_RegLin_PRO è pensato per chi cerca un trading quantitativo, disciplinato e replicabile. L’EA individua zone di valore tramite un canale di regressione lineare e opera solo quando il contesto lo conferma (RSI, DeMarker, momentum multi-timeframe, volume e spread), gestendo ogni posizione in modo attivo
RegLin Polinómico – Bande di regressione polinomiale con filtri intelligenti RegLin Polinómico è un indicatore professionale che adatta un polinomio (grado 1 , 2 o 3 ) a una finestra scorrevole di prezzo e traccia bande dinamiche sulla base della deviazione standard dei residui dell’adattamento. Include RSI (con time frame selezionabile) e un’opzione “solo in trend” per filtrare i breakout di bassa qualità. È inoltre possibile attivare/disattivare l’audio quando vengono generati segnali visivi (
Duna1
Victor Gauto
DUNA — Expert Advisor di Trading Algoritmico per Forex DUNA è un Expert Advisor (EA) professionale progettato per il trading automatizzato nel mercato Forex. Costruito su un framework algoritmico disciplinato, DUNA analizza continuamente il comportamento del mercato ed esegue operazioni sulla base di regole predefinite, senza interventi emotivi o discrezionali. Il sistema monitora i movimenti dei prezzi in tempo reale e identifica i momenti in cui le condizioni di mercato diventano favorevoli pe
NosTraderMus LinearRegressionBands MT5 — Canale di regressione lineare + RSI e frecce di segnale NosTraderMus LinearRegressionBands MT5 traccia una retta di regressione su una finestra scorrevole di prezzi e costruisce un canale dinamico a partire dalla deviazione standard dei residui . Su questo canale statistico, l’indicatore applica un filtro RSI (periodo / unità di tempo a scelta) e disegna frecce di acquisto/vendita quando si verifica la condizione “estremo + conferma” . I segnali sono valu
Filtro:
Nessuna recensione
Rispondi alla recensione