Visual Position Sizer Risk Calculator
- Indicatori
- Versione: 1.2
- Aggiornato: 2 febbraio 2026
- Attivazioni: 20

🎯 Basta indovinare. Basta calcolare. Inizia a fare trading.
Risk Reward Tool porta l'esperienza visiva e intuitiva di TradingView direttamente sul tuo grafico MetaTrader. Il trading professionale richiede una gestione precisa del rischio, ma calcolare la dimensione dei lotti manualmente con fogli Excel è lento e pericoloso.
La Soluzione: Trascina semplicemente le linee visive sui tuoi livelli di Entrata, Stop Loss e Take Profit. Lo strumento calcola istantaneamente esattamente quanti Lotti devi tradare per rischiare il tuo importo specifico in dollari (es. $50).
🔥 Caratteristiche Chiave
-
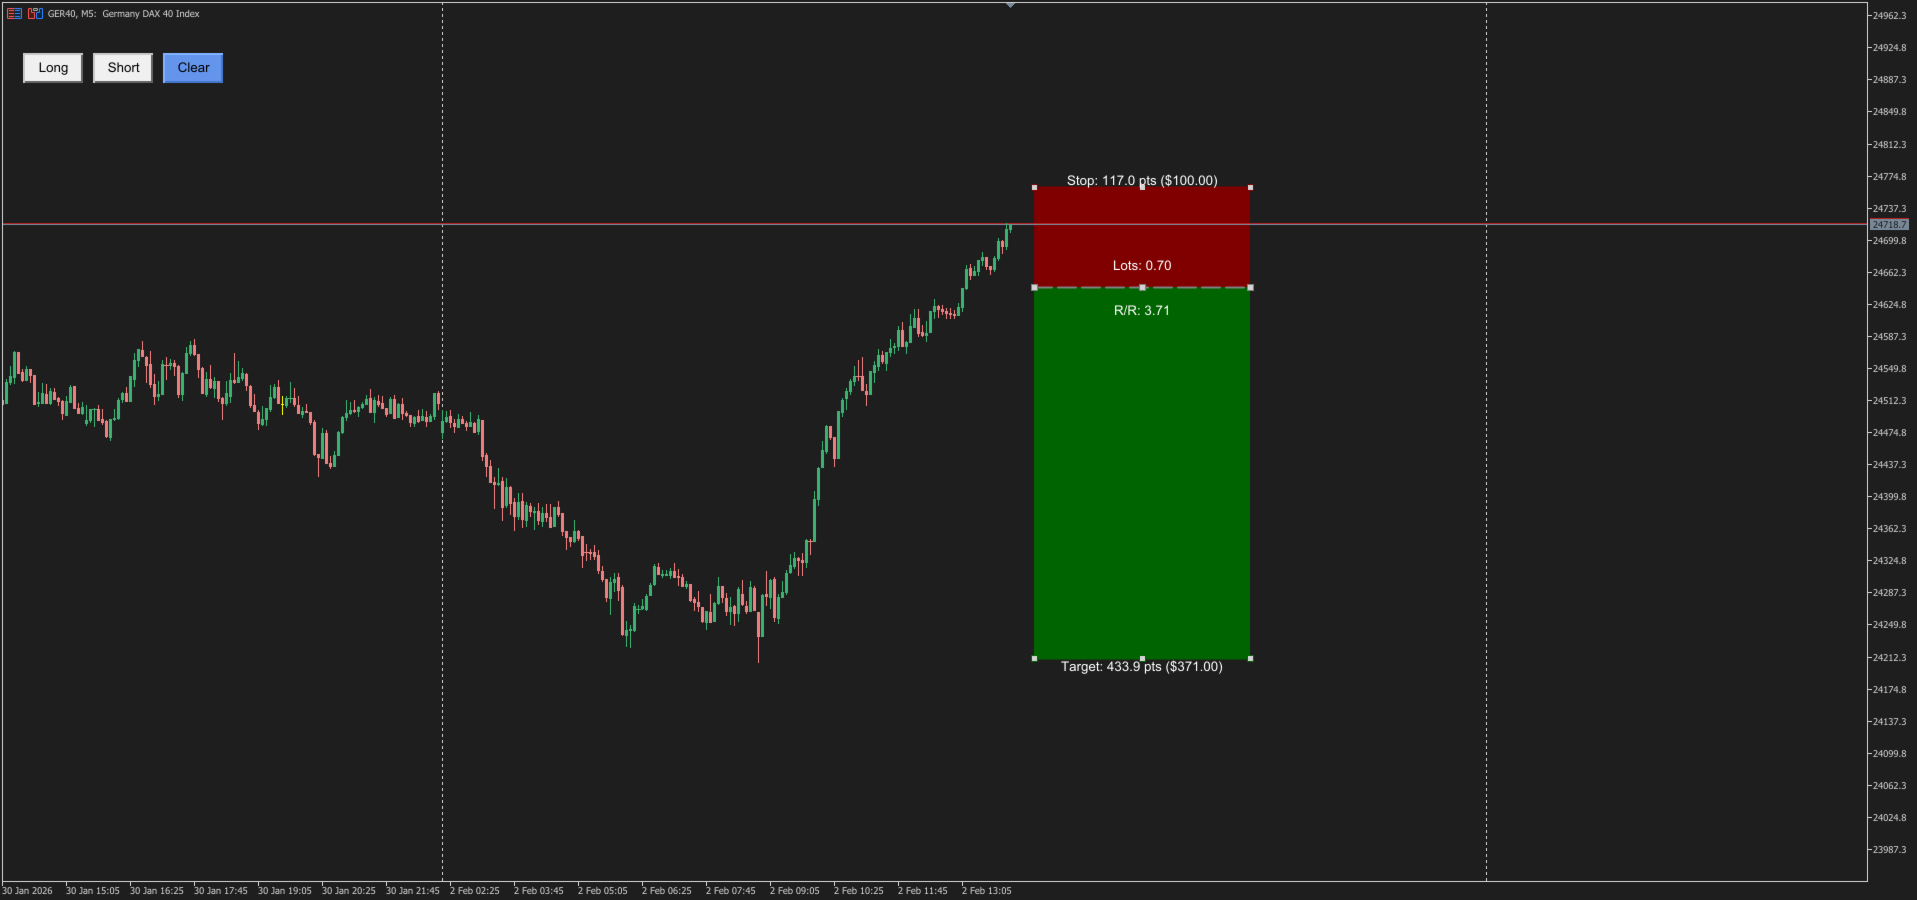
Stile Visivo "TradingView": Dimentica i numeri; fai trading con gli occhi. Trascina zone interattive Verdi (Profitto) e Rosse (Perdita) direttamente sul grafico per vedere chiaramente il tuo setup prima di agire.
-
Calcolatore di Lotti Istantaneo: La matematica avviene in background. Inserisci il tuo rischio (es. $100), e lo strumento ti dice: "Apri 0.55 Lotti per rischiare esattamente $100 su questo setup."
-
Rilevamento Intelligente Strumenti: Funziona su TUTTI i simboli senza configurazioni complesse:
-
Forex: Calcola automaticamente le coppie a 5 cifre come Pips.
-
Indici/Oro: Tratta automaticamente DAX, US30 o Gold come Punti (niente più confusione tra 10 punti vs 1000 punti).
-
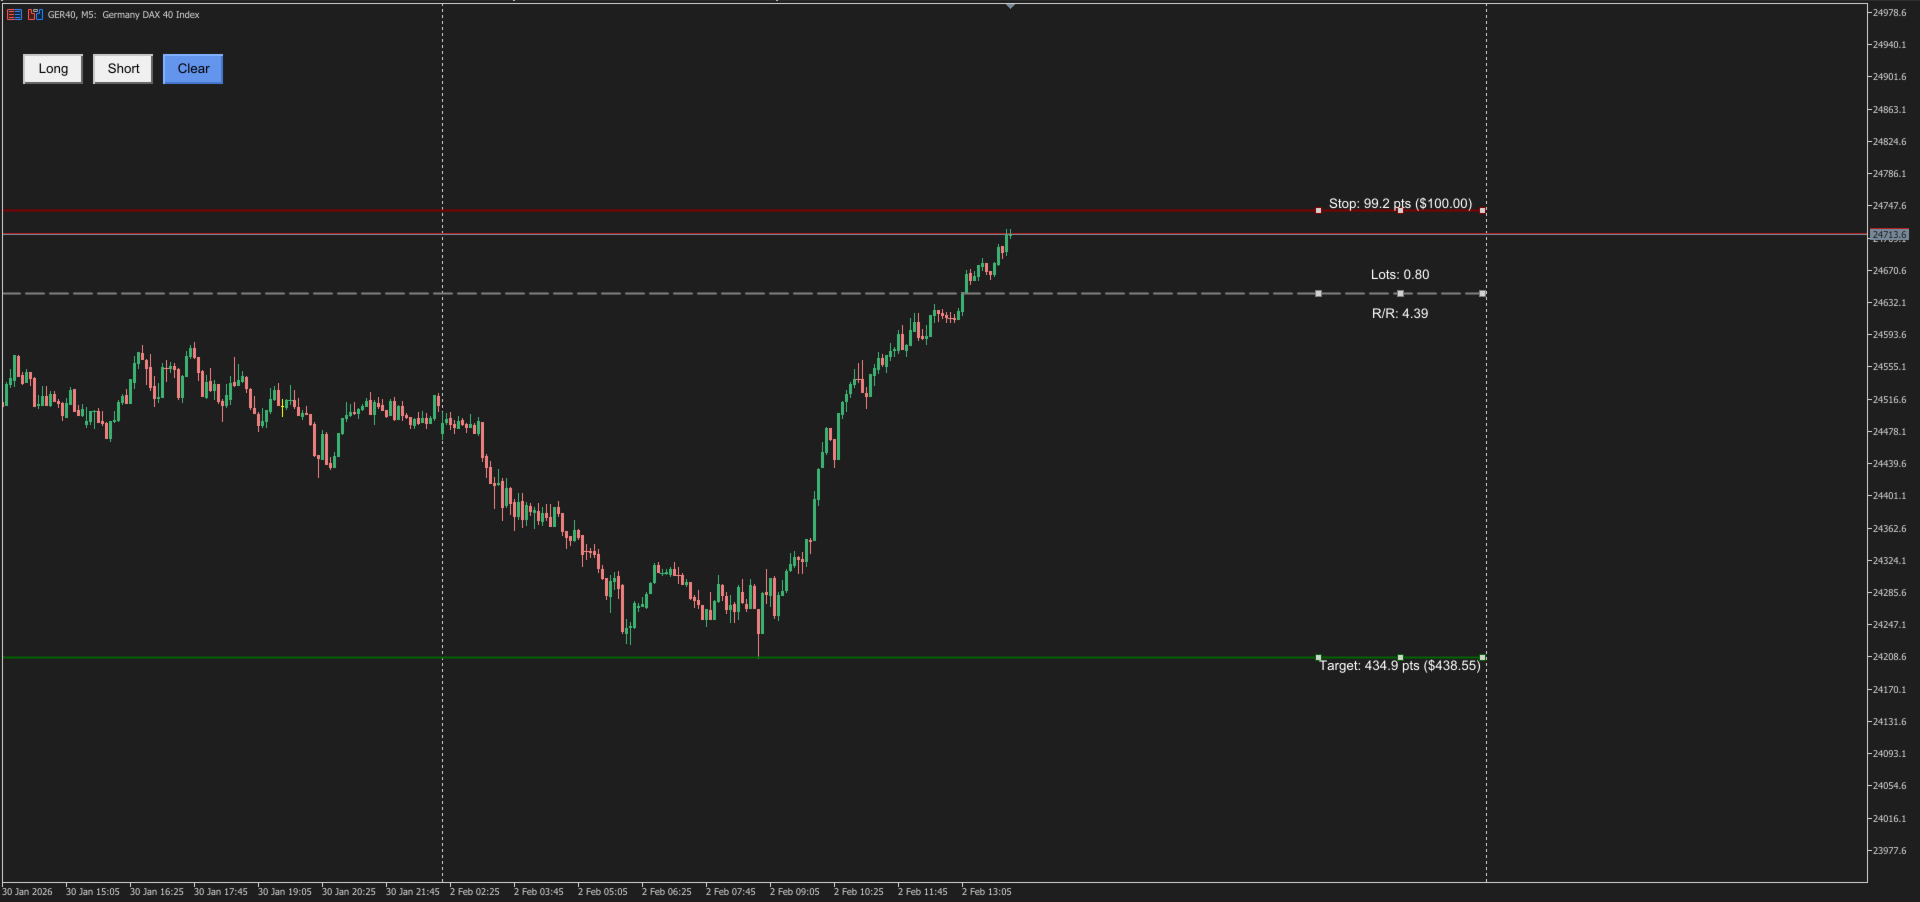
Dashboard Dati in Tempo Reale: Vedi tutto a colpo d'occhio:
-
Rapporto Rischio/Rendimento (Risk/Reward, es. 1:3.5).
-
Distanza in Pips/Punti.
-
Profitto Potenziale ($) vs Perdita Potenziale ($).
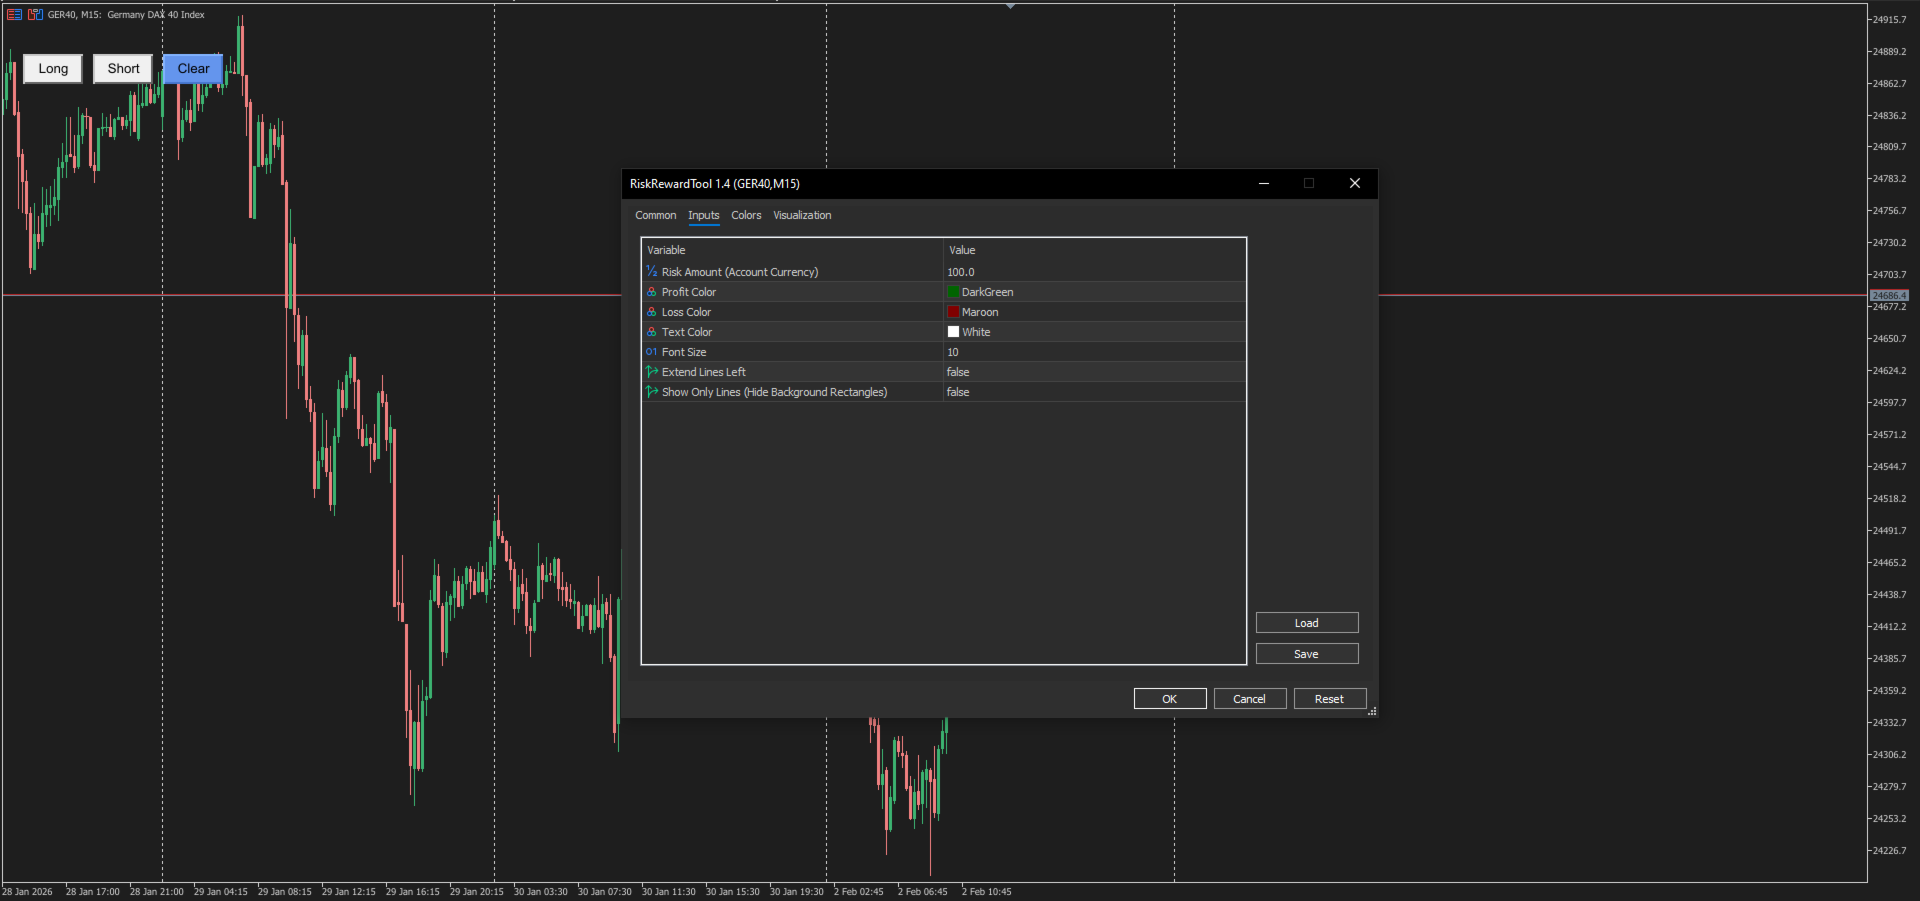
⚙️ Parametri di Input
💰 Money Management
-
Risk Amount ($): L'importo in dollari che sei disposto a perdere (es. 50.0). Lo strumento lo usa per calcolare la tua dimensione del Lotto sicura.
🎨 Impostazioni Visive
-
Profit/Loss Colors: Zone completamente personalizzabili.
-
Text Size: Regola per adattarsi alla risoluzione del tuo schermo (compatibile 4K).
💡 Come Usare
-
Set Risk: Inserisci la tua perdita massima (es. $50) nelle impostazioni.
-
Click: Premi il pulsante Long (Compra) o Short (Vendi) sul grafico.
-
Drag: Sposta la Linea Centrale sull'Entrata, la Linea Rossa sullo Stop Loss.
-
Trade: Leggi il numero "LOTS" visualizzato sullo schermo e inserisci quella dimensione nella tua finestra d'ordine.