Best SMC for All
- Indicatori
- Versione: 1.0

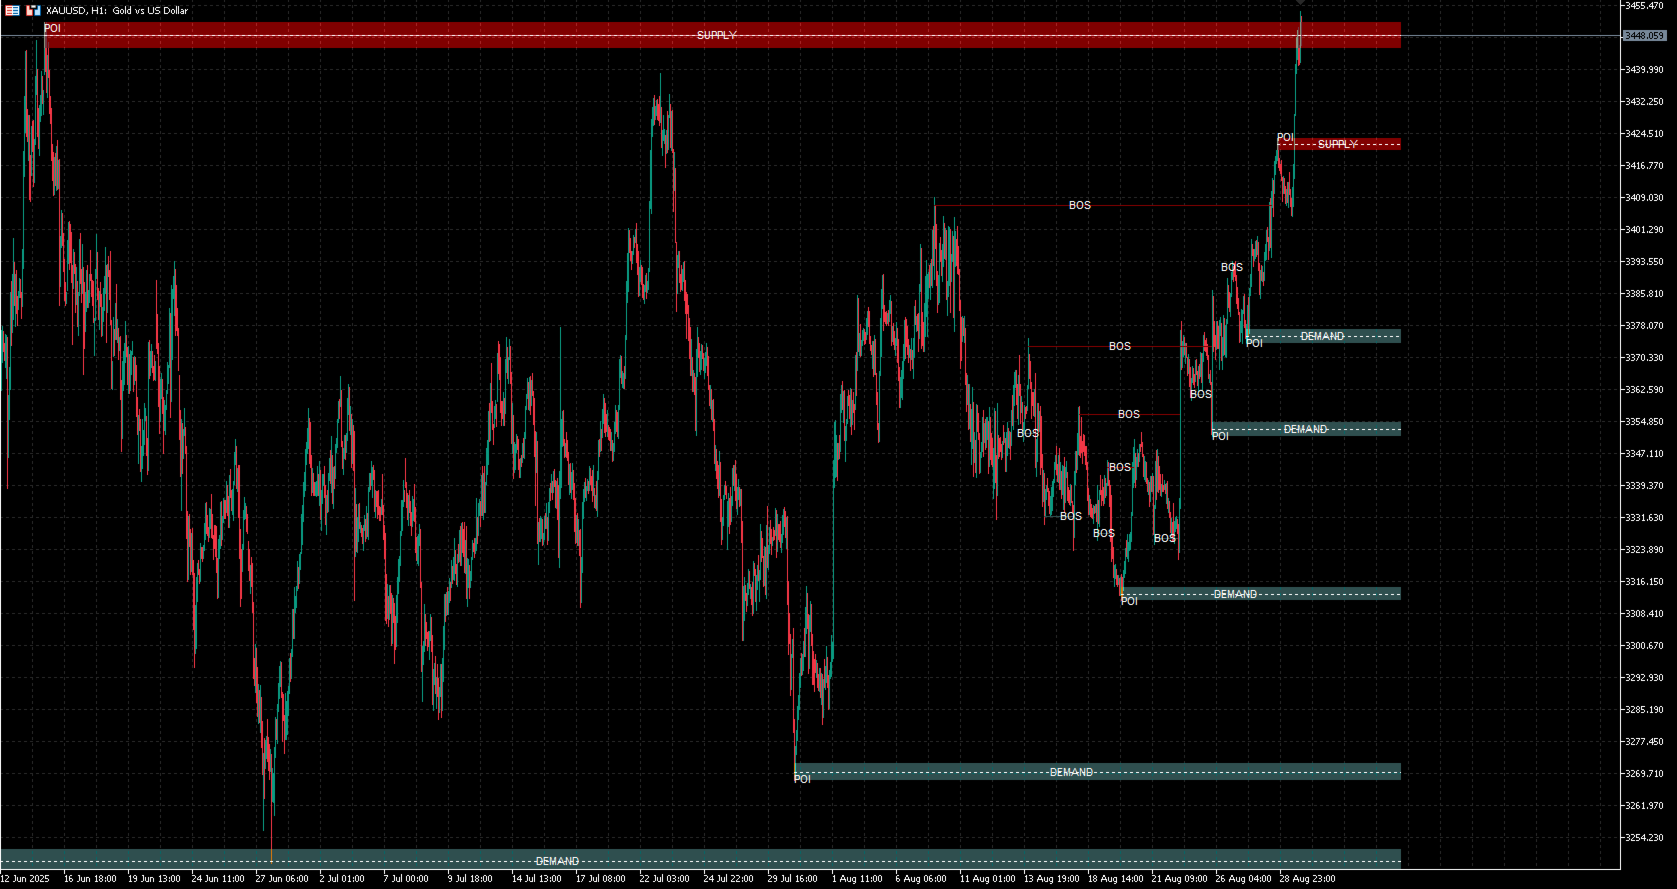
The Best SMC for All indicator is designed for MetaTrader 5 (MT5) to implement Smart Money Concepts (SMC) for analyzing market structure and identifying key trading zones based on price action. It visualizes supply and demand zones, Break of Structure (BOS) levels, Points of Interest (POI), and optional ZigZag patterns to assist traders in making informed decisions. Below is a detailed description of its features:
---
Features
1. Swing High/Low Detection:
- Functionality: Automatically identifies swing highs and swing lows using a user-defined `swing_length` parameter (default: 10 bars).
- Purpose: Detects key pivot points in the market to establish market structure (Higher Highs, Higher Lows, Lower Highs, Lower Lows).
- Labels:
- Displays labels for swing points if `show_price_action_labels` is enabled:
- HH: Higher High (bullish continuation).
- LH: Lower High (potential bearish reversal).
- HL: Higher Low (bullish continuation).
- LL: Lower Low (bearish continuation).
2. Supply and Demand Zones:
- Functionality:
- Creates supply zones at swing highs and demand zones at swing lows.
- Zones are drawn as rectangles with a configurable width (`box_width`, default: 2.5 ATR units).
- Prevents overlapping zones by checking if a new zone's Point of Interest (POI) falls within a threshold (2x ATR) of existing zones.
- Purpose: Highlights areas where smart money (institutional traders) may have placed significant orders, serving as potential reversal or support/resistance zones.
- Visualization:
- Supply zones: Light gray fill with white outline (customizable via `supply_color` and `supply_outline_color`).
- Demand zones: Cyan fill with white outline (customizable via `demand_color` and `demand_outline_color`).
- Each zone is labeled with "SUPPLY" or "DEMAND" and includes a POI line at the zone's midpoint, marked with "POI".
- History Management: Limits the number of zones displayed to `history_of_demand_to_keep` (default: 20) to optimize performance and avoid clutter.
3. Break of Structure (BOS):
- Functionality:
- Detects when the price breaks through a supply zone (close above the top) or demand zone (close below the bottom).
- Converts broken zones into BOS lines, indicating a continuation of the trend.
- Purpose: Signals that the market structure has shifted, confirming the direction of smart money.
- Visualization:
- BOS lines are drawn horizontally at the midpoint of the broken zone.
- Labeled with "BOS" and colored using `bos_label_color` (default: white).
- Limited to 5 BOS lines per type (supply/demand) to maintain chart clarity.
4. ZigZag Pattern:
- Functionality:
- Optionally displays a ZigZag pattern connecting swing highs and lows if `show_zigzag` is enabled.
- Uses `swing_length * 2 + 1` bars to confirm swing points, ensuring accurate detection of market pivots.
- Purpose: Provides a clear visual representation of market structure and trend direction, aiding in the identification of swing points.
- Visualization: Drawn as solid lines with a customizable color (`zigzag_color`, default: black) and width (2 pixels).
5. Performance Optimization:
- Efficient Object Management:
- Removes old objects (zones, labels, BOS lines) when new ones are created, respecting the `history_of_demand_to_keep` limit.
- Uses a prefix ("SMC_") for all objects to ensure clean deletion during updates or deinitialization.
- Flicker Prevention:
- Implements a time check (`last_time`) to prevent redundant calculations on the same bar, reducing flickering issues.
- ATR-Based Calculations:
- Uses a 50-period Average True Range (ATR) to dynamically size supply/demand zones, making them adaptive to market volatility.
6. Customizable Settings:
- Swing Length: Adjust the sensitivity of swing high/low detection (1–50 bars, default: 10).
- History to Keep: Control the number of supply/demand zones displayed (5–50, default: 20).
- Box Width: Set the width of supply/demand zones in ATR units (1–10, default: 2.5).
- Visual Settings:
- Toggle visibility of ZigZag lines (`show_zigzag`) and price action labels (`show_price_action_labels`).
- Customize colors for supply zones, demand zones, outlines, BOS labels, POI labels, price action labels, and ZigZag lines.
---
### How It Works
- Initialization:
- Sets up the ATR indicator (50-period) and initializes arrays for storing swing points, zones, and BOS lines.
- Calculation:
- Iterates through price data to detect swing highs/lows based on the `swing_length` parameter.
- Creates supply/demand zones at detected swing points, ensuring no overlap using an ATR-based threshold.
- Monitors price action to identify BOS events when the price breaks through a zone's boundary.
- Updates ZigZag lines if enabled, connecting confirmed swing points.
- Rendering:
- Draws rectangles for supply/demand zones, horizontal lines for POIs and BOS, and text labels for clarity.
- Extends zones to the right edge of the chart for better visibility, updating their endpoints dynamically.
- Optimization:
- Limits the number of objects drawn to prevent performance issues.
- Avoids redundant calculations by checking the timestamp of the current bar.
---
### Usage
- Chart Setup:
- Apply the indicator to any MT5 chart (Forex, stocks, commodities, etc.).
- Recommended timeframes: H1, H4, or D1 for clearer SMC signals.
- Trading Application:
- Use supply/demand zones as potential entry points for reversal trades (e.g., buy at demand zones, sell at supply zones).
- Confirm entries with BOS signals to align with the trend.
- Place stop-loss orders beyond the zone boundaries and target the next significant zone or liquidity level.
- Customization:
- Adjust `swing_length` for more or fewer swing points (smaller values for shorter-term swings).
- Modify `box_width` to make zones wider or narrower based on market volatility.
- Enable `show_zigzag` or `show_price_action_labels` for additional context on market structure.
---
### Notes
- The indicator is designed to minimize flickering by only updating when a new bar is formed.
- For best results, combine with manual analysis of higher timeframes to confirm smart money activity.
- Ensure sufficient historical data (at least 1000 bars) is loaded for accurate swing detection and zone rendering.
- The indicator does not generate trading signals directly but provides visual tools for SMC-based analysis.
This indicator is a lightweight yet powerful tool for traders employing Smart Money Concepts, offering clear visualizations of key market levels and structures to enhance trading decisions.
---
Features
1. Swing High/Low Detection:
- Functionality: Automatically identifies swing highs and swing lows using a user-defined `swing_length` parameter (default: 10 bars).
- Purpose: Detects key pivot points in the market to establish market structure (Higher Highs, Higher Lows, Lower Highs, Lower Lows).
- Labels:
- Displays labels for swing points if `show_price_action_labels` is enabled:
- HH: Higher High (bullish continuation).
- LH: Lower High (potential bearish reversal).
- HL: Higher Low (bullish continuation).
- LL: Lower Low (bearish continuation).
2. Supply and Demand Zones:
- Functionality:
- Creates supply zones at swing highs and demand zones at swing lows.
- Zones are drawn as rectangles with a configurable width (`box_width`, default: 2.5 ATR units).
- Prevents overlapping zones by checking if a new zone's Point of Interest (POI) falls within a threshold (2x ATR) of existing zones.
- Purpose: Highlights areas where smart money (institutional traders) may have placed significant orders, serving as potential reversal or support/resistance zones.
- Visualization:
- Supply zones: Light gray fill with white outline (customizable via `supply_color` and `supply_outline_color`).
- Demand zones: Cyan fill with white outline (customizable via `demand_color` and `demand_outline_color`).
- Each zone is labeled with "SUPPLY" or "DEMAND" and includes a POI line at the zone's midpoint, marked with "POI".
- History Management: Limits the number of zones displayed to `history_of_demand_to_keep` (default: 20) to optimize performance and avoid clutter.
3. Break of Structure (BOS):
- Functionality:
- Detects when the price breaks through a supply zone (close above the top) or demand zone (close below the bottom).
- Converts broken zones into BOS lines, indicating a continuation of the trend.
- Purpose: Signals that the market structure has shifted, confirming the direction of smart money.
- Visualization:
- BOS lines are drawn horizontally at the midpoint of the broken zone.
- Labeled with "BOS" and colored using `bos_label_color` (default: white).
- Limited to 5 BOS lines per type (supply/demand) to maintain chart clarity.
4. ZigZag Pattern:
- Functionality:
- Optionally displays a ZigZag pattern connecting swing highs and lows if `show_zigzag` is enabled.
- Uses `swing_length * 2 + 1` bars to confirm swing points, ensuring accurate detection of market pivots.
- Purpose: Provides a clear visual representation of market structure and trend direction, aiding in the identification of swing points.
- Visualization: Drawn as solid lines with a customizable color (`zigzag_color`, default: black) and width (2 pixels).
5. Performance Optimization:
- Efficient Object Management:
- Removes old objects (zones, labels, BOS lines) when new ones are created, respecting the `history_of_demand_to_keep` limit.
- Uses a prefix ("SMC_") for all objects to ensure clean deletion during updates or deinitialization.
- Flicker Prevention:
- Implements a time check (`last_time`) to prevent redundant calculations on the same bar, reducing flickering issues.
- ATR-Based Calculations:
- Uses a 50-period Average True Range (ATR) to dynamically size supply/demand zones, making them adaptive to market volatility.
6. Customizable Settings:
- Swing Length: Adjust the sensitivity of swing high/low detection (1–50 bars, default: 10).
- History to Keep: Control the number of supply/demand zones displayed (5–50, default: 20).
- Box Width: Set the width of supply/demand zones in ATR units (1–10, default: 2.5).
- Visual Settings:
- Toggle visibility of ZigZag lines (`show_zigzag`) and price action labels (`show_price_action_labels`).
- Customize colors for supply zones, demand zones, outlines, BOS labels, POI labels, price action labels, and ZigZag lines.
---
### How It Works
- Initialization:
- Sets up the ATR indicator (50-period) and initializes arrays for storing swing points, zones, and BOS lines.
- Calculation:
- Iterates through price data to detect swing highs/lows based on the `swing_length` parameter.
- Creates supply/demand zones at detected swing points, ensuring no overlap using an ATR-based threshold.
- Monitors price action to identify BOS events when the price breaks through a zone's boundary.
- Updates ZigZag lines if enabled, connecting confirmed swing points.
- Rendering:
- Draws rectangles for supply/demand zones, horizontal lines for POIs and BOS, and text labels for clarity.
- Extends zones to the right edge of the chart for better visibility, updating their endpoints dynamically.
- Optimization:
- Limits the number of objects drawn to prevent performance issues.
- Avoids redundant calculations by checking the timestamp of the current bar.
---
### Usage
- Chart Setup:
- Apply the indicator to any MT5 chart (Forex, stocks, commodities, etc.).
- Recommended timeframes: H1, H4, or D1 for clearer SMC signals.
- Trading Application:
- Use supply/demand zones as potential entry points for reversal trades (e.g., buy at demand zones, sell at supply zones).
- Confirm entries with BOS signals to align with the trend.
- Place stop-loss orders beyond the zone boundaries and target the next significant zone or liquidity level.
- Customization:
- Adjust `swing_length` for more or fewer swing points (smaller values for shorter-term swings).
- Modify `box_width` to make zones wider or narrower based on market volatility.
- Enable `show_zigzag` or `show_price_action_labels` for additional context on market structure.
---
### Notes
- The indicator is designed to minimize flickering by only updating when a new bar is formed.
- For best results, combine with manual analysis of higher timeframes to confirm smart money activity.
- Ensure sufficient historical data (at least 1000 bars) is loaded for accurate swing detection and zone rendering.
- The indicator does not generate trading signals directly but provides visual tools for SMC-based analysis.
This indicator is a lightweight yet powerful tool for traders employing Smart Money Concepts, offering clear visualizations of key market levels and structures to enhance trading decisions.


An awesome indicator that will definitely enhance trading and market understanding. Thumbs up and huge thanks to the developer. Keep up the good job sir!