Guarda i video tutorial del Market su YouTube
Come acquistare un Robot di Trading o un indicatore
Esegui il tuo EA
hosting virtuale
hosting virtuale
Prova un indicatore/robot di trading prima di acquistarlo
Vuoi guadagnare nel Market?
Come presentare un prodotto per venderlo con successo
Nuovi indicatori tecnici per MetaTrader 5 - 27

Bullhouse MarketFrequency Description
The MarketFrequency indicator displays color-coded histograms that reflect the market’s frequency and momentum over a chosen period. How it helps in trading
It helps traders identify buying and selling momentum as well as neutral zones, providing a quick visual reference for potential market shifts. ️ How to use
Simply set the desired period (default: 14 candles). The histogram will plot automatically in a separate window, showing momentum with fou

HEIKEN ASHI PRO Advanced Trading Indicator for MetaTrader 5 OVERVIEW Heiken Ashi PRO is an advanced technical indicator developed specifically for MetaTrader 5, designed to provide clear and accurate trading signals through Heiken Ashi candlestick analysis and an automatic alert system.
This indicator combines the traditional Heiken Ashi methodology with an intelligent trend reversal detection system, offering immediate visual signals for buy and sell trades.
KEY FEATURES Custom Heike
Fast Signals Summary Fast Signals is a dual Tillson T3 trend-and-signal indicator that paints a clear T3 ribbon on the main chart and plots buy/sell arrows on validated crossovers. It also provides optional risk overlays: entry, stop-loss, and three take-profit levels, so you can visualize trade plans directly on the chart. if you do not understand how to use technical support via product feedback or the MQL5 messaging system. How it works Two T3 lines are calculated: a fast T3 and a slow T3.

Commercial Description – Marubozu Pro (MT5) Description Marubozu Pro is a professional indicator for MetaTrader 5 that automatically detects Marubozu candles (bullish and bearish) directly on your chart.
It helps traders identify strong market momentum where buyers or sellers take full control, by displaying clear visual arrows for buy and sell signals. This tool is designed to be simple, effective, and fast , perfect for manual trading or as a filter in automated strategies. Key Features
Slayer Scalper V75. Slayer Scalper V75 is an advanced technical indicator designed specifically for high-precision scalping. It uses a dynamic adaptive channel algorithm that identifies optimal entry and exit points on short timeframes.
Key Features: Clear visual signals: Green arrows for buy and red arrows for sell. Dynamic Channels: Upper and lower levels that automatically adjust to market volatility. Configurable Parameters: Fully customizable Period (7) and Percentage (25%). Anti-Noise Al
FROZEN EMA SCALPER
Frozen EMA Scalper is an advanced moving average indicator designed specifically for scalping in financial markets.
Key Features:
Optimized 200-period for greater stability and accuracy Clear visual signals with directional arrows (green for buy, blue for sell) Dynamic color change of the EMA line based on the market trend Professional interface with customizable background for better visibility Designed for multiple timeframes Competitive Advantages:
Reduces market noise

Support: Profit Smasher 24/7 AI Assistant Disclaimer Liquidity Mapper Pro is an analytical tool for educational and informational purposes only.
It does not provide financial advice or guaranteed signals.
All trading carries risk, including potential loss of capital.
Past performance does not guarantee future results.
You are solely responsible for your trading decisions.
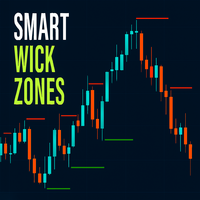
Smart Wick Zones indicator is a powerful tool designed to highlight hidden areas of price rejection and liquidity on your chart. By analyzing candle wicks (also called shadows or tails), the indicator automatically draws horizontal zones where strong buying or selling pressure has previously appeared. These wick zones often mark turning points in the market or areas where price reacts strongly, making them excellent references for support and resistance.
Instead of manually scanning candles for
FREE

CandleTimeAndSpreadLine – Tempo de vela e Spread em tempo real O CandleTimeAndSpreadLine é um indicador que mostra duas informações essenciais diretamente no gráfico:
(1) o tempo restante da vela atual e
(2) o spread em pontos, ambos ancorados ao preço de referência escolhido (Ask, Bid ou Mid). Ele utiliza atualização via OnTimer , garantindo que o tempo continue fluindo mesmo em momentos de baixa atividade do mercado.
Os valores são exibidos em rótulos sobrepostos ao gráfico, sem interferir na
FREE
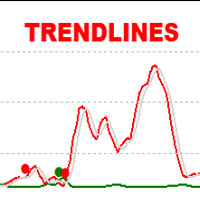
The Trendlines Oscillator helps traders identify trends and momentum based on the normalized distances between the current price and the most recently detected bullish and bearish trend lines.
The indicator features bullish and bearish momentum, a signal line with crossings, and multiple smoothing options. USAGE The Trendlines Oscillator works by systematically: Identifying pivot highs and lows. Connecting pivots to form bullish (support) and bearish (resistance) trendlines. Measuring

INDICATOR: Trend Line GEN INDICATOR: Trend Line GEN Developer: gedeegi General Description Trend Line GEN adalah indikator yang secara otomatis menggambar trendline berdasarkan titik-titik swing penting (highs dan lows) pada chart. Garis-garis ini berfungsi sebagai support dan resistance dinamis untuk membantu pengambilan keputusan trading. Key Features Automatic Swing Detection: Mengidentifikasi pivot high dan pivot low secara otomatis. Flexible Slope Calculation: Pilihan metode perhitungan ke
FREE

N/B: All our product purchase comes with our free ‘’DAILY SCALPER EA’’ - bit.ly/4qlFLNh Whatsapp Developer for yours after successful purchase
THE PERFECT ENTRY INDICATOR
Enter Trades Like a Pro With the Perfect Entry Indicator!
No More Guesswork. Just Precision. Double-ZigZag + Fractal Confirmation = Only the Strongest Buy & Sell Setups.
Are you tired of false signals, late entries, and endless chart confusion? The Perfect Entry Indicator was built to give traders crystal-clear e
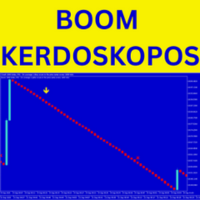
Boom Kerdoskopos Indicator – Sell With Confidence The Boom Kerdoskopos Indicator is a scalper’s dream for Boom markets on M1 timeframe . Built to protect you from spikes, it gives precise yellow down arrows for sell entries and red cross exit signals so you always know when to enter and leave the trade. With smart alerts (audible, push, email), you can trade stress-free and secure 8–10 safe candles every time. It’s perfect for scalpers who want fast, consistent profits. Why Traders Choose

Hourly Sweep Matrix – 1m Chart
By Daniel Butogwa (The Alien Trader) The Hourly Sweep Matrix is a precision tool built for traders who want to see market structure with sniper clarity. It automatically marks out hourly price sweep zones on the 1-minute chart, showing you exactly where liquidity was taken each hour and where price reacted. No clutter, no lagging nonsense — just pure price action zones, updated every minute, so you always know which hour’s high/low is being hunted. Key Features:

UT Bot Alerts with ATR Trailing Stop is a professional trading tool that automatically detects trend changes and generates precise buy/sell signals using a smart ATR-based trailing stop system. Key Benefits Smart Alert System - Instant notifications when trading opportunities appear - Multiple alert types: popup, sound, email, and mobile push - No duplicate alerts - prevents spamming - Customizable alerts for buy signals, sell signals, or both
Accurate Signal Detection - Dual confirmation syste
Tired of sifting through your account history to track closed trade profits? The Draw Profit indicator by Bo.Botfx is here to revolutionize how you visualize your trading performance! This intuitive and powerful indicator automatically draws the profit (or loss) of your closed orders directly onto your chart . No more guessing or tedious calculations – with Draw Profit, you can instantly see the exact outcome of each trade right where it happened. Key Features: Visual Profit Tracking: Clearly di
FREE

Professional VWAP Trading System with Advanced Signal Detection Transform your trading with the most comprehensive VWAP indicator available for MetaTrader 5. Magic VWAP Key Levels Pro combines multiple timeframe analysis, intelligent signal detection, and professional-grade visualization to give you the edge in modern markets. CORE FEATURES: Multi-Timeframe VWAP Analysis Session, Weekly, and Monthly VWAP calculations Previous 10-day VWAP support/resistance Dynamic anchor periods (Session/Week/Mo
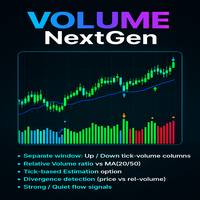
The Advanced Volume Flow Indicator is a free and practical tool who want to clearly see the balance between buying and selling pressure in the market. Instead of just showing total volume, this indicator separates volume into Up Volume (green bars) and Down Volume (red bars), making it easy to understand which side of the market is stronger at any moment.
The indicator also calculates a Relative Volume Line (blue), which shows whether the current trading activity is higher or lower than usual
FREE

CandleAvg Pro: Advanced MT5 Indicator for Smarter Trading Visualize dynamic moving averages directly overlaid on candlesticks with precision. Key Features: Customizable MA periods (SMA/EMA) for trend spotting. Color-coded signals: Green for bullish, red for bearish crossovers. Real-time alerts on breakouts and reversals. Compatible with all timeframes and pairs. Boost your edge – spot entries/exits faster. Only $49!
FREE
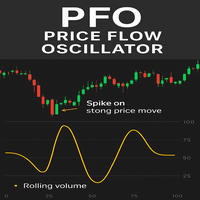
PFO Price Flow Oscillator – MT5 Indicator
The PFO Price Flow Oscillator is a highly advanced tool designed to help traders anticipate explosive price movements and identify market momentum with precision.One of its most powerful features is the ability to anticipate explosive price moves before they occur, giving traders an early edge in volatile markets. Unlike standard oscillators, the PFO does not rely on price alone—it integrates multiple market factors to provide clear, actionable insight
FREE

Spike Blaster Pro – The Ultimate Spike Detection Tool Spike Blaster Pro is a next-generation MT5 indicator designed specifically for synthetic markets. It works seamlessly on Boom Index and Weltrade Index , providing traders with sharp, reliable spike detection signals. What makes Spike Blaster Pro powerful is its 5 Core Strategies built into one system, giving traders a multi-layer confirmation before signals appear. This ensures high accuracy and reduces false alerts. 5 Core Strategies B
DS RVOL: The Relative Volume Indicator for MT5 RVOL is a straightforward Relative Volume (RVOL) indicator for MetaTrader 5. It shows you how current volume compares to a historical average, providing a quick way to gauge the strength of a price move. How it Works Relative Volume is a simple ratio: R V O L = C u rre n t V o l u m e / A v er a g e H i s t or i c a l V o l u m e RVOL > 1.0 : Volume is higher than usual. This suggests there's strong interest and potential for a sustained move. RVOL
FREE
ForexRubyEA is a fully automated trading system designed to simplify your trading. Using forexruby Custome Indicator.
It manages trades with smart logic, risk control, and built-in protection features — all without requiring constant monitoring. Download EA for this indicator: forexrubyaibot DM: https://www.mql5.com/en/users/forexruby/
Key Features Plug & Play – Easy setup, works out of the box. Automated Trading – Places, manages, and closes trades automatically. Risk Management –
FREE

CandleCountdown Indicator — Overview This indicator displays a live countdown timer for the current candle on your chart, updating every second. It’s designed to be visually intuitive, resilient across timeframes, and smartly formatted for clarity.
Core Features • Real-Time Countdown Shows how much time remains until the current candle closes, updating once per second. • Smart Time Formatting Adapts the display based on remaining time: • → shows just seconds (e.g., ) • → shows (e.g., ) •
FREE

Advanced Trend Analyzer Pro MT5 The Ultimate Multi-Strategy Trend Analysis System That Never Repaints Transform Your Trading with Professional-Grade Market Analysis Advanced Trend Analyzer Pro MT5 is a revolutionary indicator that combines Fuzzy Logic , Multi-Timeframe Analysis , and Currency Strength Technology into one powerful trading system. Designed for serious traders who demand precision, reliability, and consistent performance across all market conditions. Why Choose Advanced Tr

This indicator is designed to automatically identify and highlight Mother Bars and their corresponding Child Bars on a price chart using rectangles. A Mother Bar is defined as a significant candlestick that encompasses smaller candlesticks (Child Bars) within its range, commonly used in Price Action trading strategies. The indicator draws rectangles around the Mother Bar and the subsequent Child Bars, providing a clear visual representation for traders to spot potential patterns. Key features: A
FREE

AP VWAP Bands Pro (MT5) Volume-weighted average price with ±σ bands for clear intraday bias, mean-reversion zones, and dynamic support/resistance. Works on crypto (incl. BTC) , FX , indices , and metals . Uses tick-volume when real volume isn’t available. What it shows VWAP line (volume-weighted mean price). Two envelopes around VWAP (default ±1σ and ±2σ) to highlight balance vs. extension. Reset modes : Day , Week , or Anchor Time (HH:MM) to start VWAP where you need it (e.g., exchange open).
FREE

The Smart Squeeze Momentum Indicator MT5 is a powerful trading tool that helps traders identify periods of market contraction, expansion, and potential trend reversals . Built on the proven concepts of Bollinger Bands and Keltner Channels , this indicator detects “squeeze” conditions and provides a clear momentum histogram along with buy and sell trading signals . Key Features Momentum Histogram – Visualizes the strength and direction of market momentum.
Squeeze Detection – Identifies low-vol

CM Williams Fix Indicator for MT5 Introduction The CM Williams Fix Indicator for MetaTrader 5 is one of the most popular indicators on the TradingView platform, now available for MT5 users. This tool identifies special market conditions and delivers reliable, high-quality buy signals. Simply attach it to your chart and experience its outstanding performance in your trading.
Type: indicator
Market: all markets
TimeFrames: all timeframes
Trading type: all trading types from scalping to posit
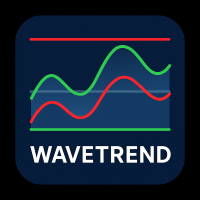
Introduction The Wave Trend Oscillator Indicator for MT5 is one of the well known indicators in the market, helping traders find strong entry points into the market. Like any other MetaTrader 5 indicator , it can produce both good and bad signals, but the number of accurate buy/sell signals is significantly higher than the weak ones. This makes it a powerful tool for improving your forex trading strategy , whether you are a beginner or an advanced trader. How does this indicator work? This indic

Most SMC trades are painfully stressed because, They miss out on trades because there is a lot to mark and they keep forgetting important markings. They back-test a method correctly because back testing is done in one go, they later fail in forward test because they unconsciously change how levels were marked during testing phase. When they don't find a level, they think they are missing something and then mark a wrong level thinking its the right one. Be focused on trading, not marking, because
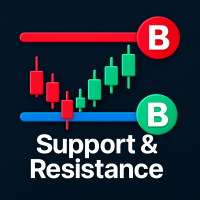
Support and Resistance Levels Indicator for MT5 The Support and Resistance Levels Indicator for MetaTrader 5 is one of the most advanced and reliable tools for identifying key price zones in the market. Unlike traditional indicators, it not only detects support and resistance levels but also combines them with volume analysis to generate accurate and high-probability trading signals. Type: Indicator Level: Intermediate Concepts: SMC (Smart Money Concepts), Price Action, Volume Analysis Timefram

Adaptive Moving Average (Adaptive MA) is a powerful, next-generation trend-following indicator designed to adjust dynamically to changing market conditions. Unlike traditional Moving Averages that apply a fixed calculation period, this indicator automatically adapts its sensitivity to price action, providing a smoother and more responsive line that helps traders identify trends with greater accuracy. The Adaptive MA combines the reliability of classical Moving Averages with the flexibility of mo
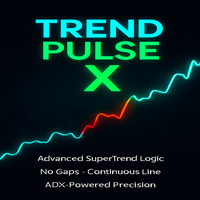
The Trend Pulse X – Continuous Colored Line is a next-generation trend-following indicator designed to give traders a crystal-clear view of market direction, strength, and momentum. Unlike standard indicators that often leave gaps or inconsistent readings, Trend Pulse X delivers a smooth, continuous line that adapts dynamically to price action, ensuring you always have a reliable guide on your chart.
With its innovative color-coded system, Trend Pulse X helps traders instantly identify bullish

What It Does: This is a multi-timeframe momentum indicator that combines trend following, volume analysis, and volatility bands to identify high-probability trade setups. Core Components: EMA 7 (Blue) - Fast trend line EMA 21 (Orange) - Slow trend line VWAP (Purple) - Volume-weighted average price (institutional level) ATR Bands (Red/Green) - Volatility channel around EMA 21 Info Panel - Real-time metrics (RSI, volume ratio, trend, positions) Signal Logic: LONG = EMA 7 crosses above EMA 21 + Vol
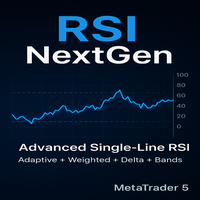
RSI NextGen Advanced RSI Indicator
The RSI NextGen is an advanced and modernized version of the classic Relative Strength Index (RSI). It comes with enhanced features that deliver far more accurate and reliable signals across different market conditions. This indicator has been designed to provide traders with a dynamic and adaptive view of overbought and oversold zones, instead of relying on the static and rigid settings of the traditional RSI.
Unlike the standard RSI, which is calculated us
Read detailed blogpost with screenshots here: https://www.mql5.com/en/blogs/post/764306
Note: This is the MT5 only version. The MT4 version is available here: https://www.mql5.com/en/market/product/149941
Features Kalman smoothing to reduce market noise. Supertrend bands for trend direction. Color-coded dots and arrows for quick reading. Arrow signals for trend continuation. Alerts for trend changes. Adjustable inputs for different styles.
How to Use
Green dots = bullish bias. Red dots = bea

Laguerre-Geometric Moving Average with Range Filter
This is the first Indicator I am uploading from my series of indicators, that I am using in my professional EAs. Overview The Laguerre-Geometric Moving Average indicator is an advanced technical analysis tool that combines three sophisticated mathematical approaches to provide enhanced trend detection and market analysis. This hybrid indicator integrates the Laguerre Filter, Geometric Moving Average (GMA), and intelligent range filtering to de

CM Ultimate MA Indicator for MT5 The CM Ultimate MA Indicator for MetaTrader 5 is a powerful moving average–based trading tool designed for Forex, indices, stocks, and commodities. Unlike standard moving averages, this indicator adds advanced features for detecting trend direction, MA crossovers, and momentum shifts , giving traders reliable entry and exit signals. Key Features Dynamic Color Change – MA line changes color automatically based on trend direction.
Smoothing Options – Reduce nois
Fibonacci Bollinger Bands Indicator for MT5 The Fibonacci Bollinger Bands Indicator for MetaTrader 5 (MT5) is a powerful trading tool that combines the strength of Bollinger Bands with Fibonacci retracement levels . Since price often reacts strongly to Fibonacci levels, this indicator helps traders identify high-probability reversal zones and breakout opportunities. Key Features & Inputs Bollinger Bands Length – customizable parameter for band calculation.
Price Mode Selection – choose from C
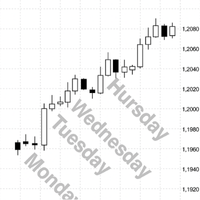
Key Features Start Date Control Choose a specific date from which labels begin to appear. Prevents clutter from old history data. Ideal for focusing on recent or relevant trading periods. Latest N Days Limiter Input option to display labels only for the most recent N days. Keeps your chart uncluttered during long backtests. Example: Set LatestDays = 10 to only show the last 10 trading sessions. Font Customization Set your preferred font name (default: Arial). Adjust font size for readability. C

Trend indicators on the FOREX market are extremely useful for increasing your ability to open winning positions and for better anticipating market movements.
OPTIMISED TREND PRO is one of these indicators.
• SuperTrend PRO is available on MetaTrader 5 (MT5)
• Green/Red candles according to the trend, easy to read at a glance
• A single arrow at the start of each phase: BUY (green), SELL (red)
• The SuperTrend line helps set the stop and follow the position
• Usable on all FOREX symbols
•

AP Day-Week-Month High-Low overlay that draws the prior Day, Week, and Month highs/lows on any chart. Great for session planning, confluence, and alerting when price comes back to important swing levels. What it does Plots 6 lines: Day High/Low , Week High/Low , Month High/Low (from the previous completed sessions). Touch/near alerts when price reaches a selected line (with a user-set tolerance). Works on any symbol and timeframe. Zero external libraries. How to use Drop it on the chart you trad
FREE
Breakout Shift Trader – MT5 Indicator Trade Like the Market Architects — Not the Victims. Most traders are fighting blind against a rigged game. Market makers engineer false breakouts, liquidity grabs, and “stop hunts” that wipe out retail accounts in seconds. Breakout Shift Trader flips the script. This MT5 indicator decodes the footprints left by institutional manipulation and aligns your trades with the power brokers driving real price action. Proven Results – Tested, Verified, Relentless N
FREE

CandleScope Pro Demo – Candlestick Pattern Indicator CandleScope Pro Demo is a powerful and easy-to-use indicator for MetaTrader 5 that automatically detects and labels the most popular candlestick patterns directly on your chart. This tool is designed to help traders of all levels quickly identify key reversal and continuation signals, improving decision-making and trading accuracy. Key Features: Automatic Detection: Instantly scans and highlights the following candlestick patterns: Doji Spin
FREE
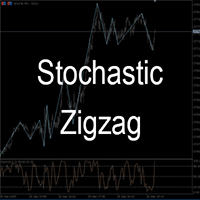
The Stochastic ZigZag is a powerful and intuitive indicator designed to identify significant market swing points with a high degree of reliability. By integrating the Stochastic Oscillator, this indicator plots swing highs and lows only after they are validated by a clear shift in market momentum by using Stochastic overbought and oversold zone. Features: Stochastic Confirmation: Uses momentum to filter out insignificant price movements. Simple Chart Visualization: Draws clear trend lines connec

This indicator automatically detects and visually marks the most important bullish and bearish candlestick reversal patterns on your chart.
It highlights each detected pattern with arrows, labels, and optional colored boxes, and displays a summary panel with pattern counts. Supported Bullish Patterns: Hammer Inverted Hammer Bullish Engulfing Morning Star Bullish Harami Bullish Pin Bar Supported Bearish Patterns: Shooting Star Bearish Engulfing Gravestone Doji Evening Star Bearish Harami Bearish

WaveWeisBarForce – Volume acumulado por ondas (Weis) O WaveWeisBarForce é um indicador que aplica a lógica de ondas de volume (Weis) para identificar acumulações e mudanças de direção do mercado.
Ele soma o volume enquanto a tendência não muda. Ao inverter a direção, inicia uma nova onda e zera o acumulado.
A intensidade é calculada por níveis, de acordo com a relação entre o volume da onda atual e o maior acumulado recente (janela Intensity ). Parâmetros de entrada Volume_type – Define

Channel Trend Bands – A Comprehensive Indicator for Market Analysis Simple to Use, Effective in Application User-Friendly and Suitable for All Traders This indicator stands out due to its straightforward functionality. Whether you're a beginner exploring the market or an experienced trader refining your strategy, this tool offers valuable insights. Using a Triangular Moving Average (TMA) with additional ATR-based bands , it provides structured market data to support well-informed decision-

Modern Spike Indicator Features:
1. Support and Resistance Lines: Displays dynamic horizontal dashed lines on the chart representing current support and resistance levels calculated from recent price swings.
2. Spike Detection Arrows: Shows up arrows (green) for potential upward spikes and down arrows (red) for potential downward spikes, triggered when price breaks S/R levels with RSI confirmation.
3. Trend Analysis: Incorporates ADX (Average Directional Index) to determine market trend stre

ArroX Indicator Description
ArroX is a technical analysis indicator designed for MetaTrader 5 platform. This indicator analyzes price movements and market trends to provide trading signals.
Key Features: - Displays buy and sell arrows on the chart - Includes trend filtering capabilities - Provides multiple take profit levels - Shows market analysis information panel - Supports different signal sensitivity modes - Uses Bollinger Bands and moving averages for analysis - Includes stop loss calc

BUY INDICATOR AND GET NEW EXCLUSIVE EA FOR FREE AS A BONUS! ITALO ARROWS INDICATOR is the best reversal indicator ever created, and why is that? Using extreme reversal zones on the market to show the arrows and Fibonacci numbers for the Take Profit, also with a panel showing all the information about the signals on the chart, the Indicator works on all time-frames and assets, indicator built after 8 years of experience on forex and many other markets. You know many reversal indicators around t

Il Tenet Support & Resistance Pro è un indicatore avanzato per MetaTrader 5, progettato per aiutare i trader a identificare con precisione le principali aree di supporto e resistenza del mercato. Basandosi sulla cronologia dei prezzi, l'indicatore traccia automaticamente linee orizzontali che evidenziano zone strategiche. Inoltre, evidenzia in tempo reale l'area attuale in cui la candela viene negoziata , fornendo una visione chiara delle aree critiche di decisione. Una caratteristica esclusi
FREE

Trend Battle Indicator
Overview The Trend Battle Indicator is a professional technical analysis tool that reveals the battle between buyers (Bulls) and sellers (Bears) in the market through a comprehensive dashboard. Using an intuitive visual interface, the indicator offers a unique perspective on market power dynamics by analyzing the last twenty bars to provide precise insights into momentum and directional strength. Additionally, the panel provides automatic real-time updates for bars in for
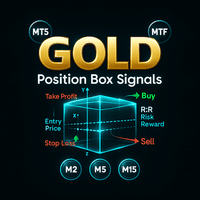
Gold Position Box Signals Pro v3.1 – Indicatore Tecnico Multitemporale per XAUUSD
Panoramica Gold Position Box Signals Pro v3.1 è un indicatore personalizzato per MetaTrader 5 progettato per il trading di XAUUSD. Combina incroci di medie mobili, livelli di stop loss/take profit basati sulla volatilità, visualizzazione delle posizioni e analisi delle tendenze multitemporali. Lo strumento aiuta i trader a individuare possibili ingressi e a gestire le operazioni con un chiaro display grafico.
Fu
Vice SwingTrading – Indicatore Avanzato di Swing Trading Multi-Timeframe Vice SwingTrading è pensato per i seri swing trader che si affidano alla conferma multi-timeframe per catturare in modo efficiente i movimenti del mercato. L’indicatore combina l’identificazione del trend sul Giornaliero (D1) con la precisione di ingresso sull’Orario (H1) , offrendoti un vantaggio strutturato nei mercati volatili. Logica di Trading Principale Rilevamento del Trend (D1) → Identifica la direzione dominante

Cos'è Pi Cycle Projections? Pi Cycle Projections è un sistema di trading completo per MetaTrader 5 che ti offre un doppio vantaggio: non solo identifica segnali di ingresso ad alta probabilità (incrocio di Medie Mobili) nel momento presente, ma traccia anche una mappa visiva con possibili scenari futuri del mercato. Pensalo come un sistema due in uno: Un Generatore di Segnali Intelligente che ti dice quando agire, tramite gli incroci delle medie mobili Pi. Un Proiettore di Cicli Strategico che t
FREE
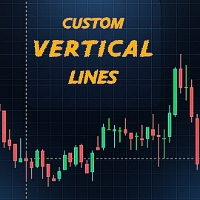
Questo indicatore traccia automaticamente linee verticali agli orari da te preferiti e aggiunge facoltativamente una linea orizzontale basata sul prezzo di apertura in quei momenti. Aiuta i trader a segnare eventi chiave, come sessioni di mercato, orari specifici di strategia o livelli giornalieri personalizzati. Caratteristiche: Disegna fino a due linee verticali personalizzabili al giorno. Opzione per aggiungere una linea orizzontale dal prezzo di apertura dell’orario selezionato. Completament
FREE

Contesto Anni fa sono arrivato su questo sito in cerca di un indicatore per le opzioni binarie. Come molti principianti, ero tanto sicuro quanto ingenuo: pensavo di trovare il “Santo Graal” che mi avrebbe fatto guadagnare ogni giorno seguendo le frecce sullo schermo. Ho provato centinaia di indicatori, a pagamento e gratuiti. Nessuno ha dato risultati stabili. Col tempo sono tornato qui — non più da novizio, ma come qualcuno che ha percorso tutta la strada: alti e bassi, euforia e frustrazione —

Meta Cipher B: la suite di oscillatori tutto-in-uno per MT5 Meta Cipher B porta il popolare concetto di Market Cipher B su MetaTrader 5, ottimizzato per velocità e precisione. Progettato da zero per offrire prestazioni elevate, fornisce segnali di livello professionale senza ritardi o rallentamenti. Sebbene sia potente anche da solo, Meta Cipher B è stato creato per combinarsi naturalmente con Meta Cipher A , offrendo una visione completa del mercato e una conferma più profonda delle analisi.
C

Italiano (Italien) – Weekly Levels Pro Weekly Levels Pro – Livelli Settimanali Chiave è un indicatore semplice ma potente per MetaTrader 5, progettato per mostrare automaticamente i quattro livelli di trading più importanti di ogni settimana: Massimo settimanale (Weekly High) → livello naturale di resistenza Minimo settimanale (Weekly Low) → livello naturale di supporto Apertura settimanale (Weekly Open) → punto di riferimento del trend Chiusura settimanale (Weekly Close) → indicatore di forz

Mahdad Candle Timer è un indicatore leggero e preciso per MetaTrader 5 che mostra il tempo rimanente alla chiusura della candela corrente, visualizzato direttamente accanto all’ultima barra. È stato progettato per i trader che si affidano a un timing accurato — che si tratti di scalping, day trading o dell’attesa della conferma di una candela in configurazioni swing. Caratteristiche principali Conto alla rovescia accurato – Tempo rimanente in formato HH:MM:SS (opzionalmente millisecondi) Pos
FREE

Italiano – Canal H Pro Nome: Canal H Pro – Supporto, Resistenza e Breakout Descrizione breve:
Indicatore premium con tre linee dinamiche (alta, bassa, media) e frecce automatiche BUY/SELL sui breakout. Ideale per strategie Breakout, Range e trend following. Descrizione completa: Rossa (Alta) → resistenza dinamica Blu (Bassa) → supporto dinamico Gialla (Media) → equilibrio e filtro di trend Segnali automatici BUY/SELL sul grafico Periodo e colori personalizzabili Compatibile con tutte le stra

The Golden PainX and GainX Spike Indicator is a cutting-edge, AI-powered trading tool engineered exclusively for the synthetic indices market. It masterfully combines proprietary spike detection algorithms and real-time price action analysis to generate high-probability, non-repainting trade signals with exceptional accuracy. Important( Use only on PainX 400and GainX 400 (M1 one minute timeframe) Identifies high-probability spikes with non-repainting buy/sell arrows. Automatically sets profit t
Spike Detector Rider – Intelligent Trading in Volatile Markets Introduction
The Spike Detector Rider is an advanced system for MetaTrader 5 designed to detect explosive price movements in high-volatility assets such as synthetic indices and commodities.
It combines volatility filters, trend analysis, and automated risk management to provide intelligent trade confirmations. After purchase, please send me a private message via MQL5 to receive the installation manual and setup instructions. Asset
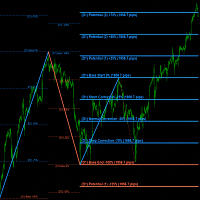
"Impulses and Corrections 5" is created to help traders navigate the market situation. The indicator shows multi-time frame upward and downward "Impulses" of price movements. These impulses are the basis for determining the "Base" , which is composed of zones of "Corrections" of price movements, as well as "Potential" zones for possible scenarios of price movement.
Up and down impulses are determined based on a modified formula of Bill Williams' "Fractals" indicator. The last impulse is always
The AX Forex Indicator MT5 is a sophisticated trading tool designed to provide traders with a comprehensive analysis of multiple currency pairs. This powerful indicator simplifies the complex nature of the forex market, making it accessible for both novice and experienced traders. AX Forex Indicator uses advanced algorithms to detect trends, patterns and is an essential tool for traders aiming to enhance their forex trading performance. With its robust features, ease of use, and reliabl

GoldRushTrader EA – Trade Smart Money Concepts Automatically on MT5
GoldRushTrader EA is a fully automated trading system built on Smart Money Concepts (SMC) .
It combines institutional trading logic with advanced market scanning to generate and manage trades automatically. Key Features: SMC Trading Engine – Detects liquidity grabs, order blocks, and structure breaks. Automated Execution – Places and manages trades directly without manual input. Multi-Symbol Capability – Monitor and trade up t

The Smart FVG Statistics Indicator is a powerful MetaTrader 5 tool designed to automatically identify, track, and analyze Fair Value Gaps (FVGs) on your charts. Love it? Hate it? Let me know in a review! Feature requests and ideas for new tools are highly appreciated. :)
Try "The AUDCAD Trader":
https://www.mql5.com/en/market/product/151841
Key Features Advanced Fair Value Gap Detection Automatic Identification : Automatically scans for both bullish and bearish FVGs across specified histo
FREE

ZPOWER BUY & SELL INDICATOR
Trade Smarter. Trade Confidently. Trade Profitably.
Are you tired of second-guessing your trades? Do you enter late and exit too early — leaving money on the table? It’s time to upgrade your strategy with the ZPOWER BUY & SELL INDICATOR, built with institutional-grade logic that helps you catch high-probability trade setups with precision.
Why ZPOWER is Different
Unlike ordinary indicators that flood your charts with noise, ZPOWER is engineered with advanced
FREE
Il MetaTrader Market è un sito semplice e pratico dove gli sviluppatori possono vendere le loro applicazioni di trading.
Ti aiuteremo a pubblicare il tuo prodotto e ti spiegheremo come prepararne la descrizione per il Market. Tutte le applicazioni sul Market sono protette da crittografia e possono essere eseguite solo sul computer dell'acquirente. La copia illegale è impossibile.
Ti stai perdendo delle opportunità di trading:
- App di trading gratuite
- Oltre 8.000 segnali per il copy trading
- Notizie economiche per esplorare i mercati finanziari
Registrazione
Accedi
Se non hai un account, registrati
Consenti l'uso dei cookie per accedere al sito MQL5.com.
Abilita le impostazioni necessarie nel browser, altrimenti non sarà possibile accedere.