ProQuant Probability Map
- Indicatori
- Versione: 7.0
- Attivazioni: 5

ProQuant Probability Map: A Dual-Quant Prediction System to Navigate the Future
Say goodbye to blind guessing. Let historical data be your compass.
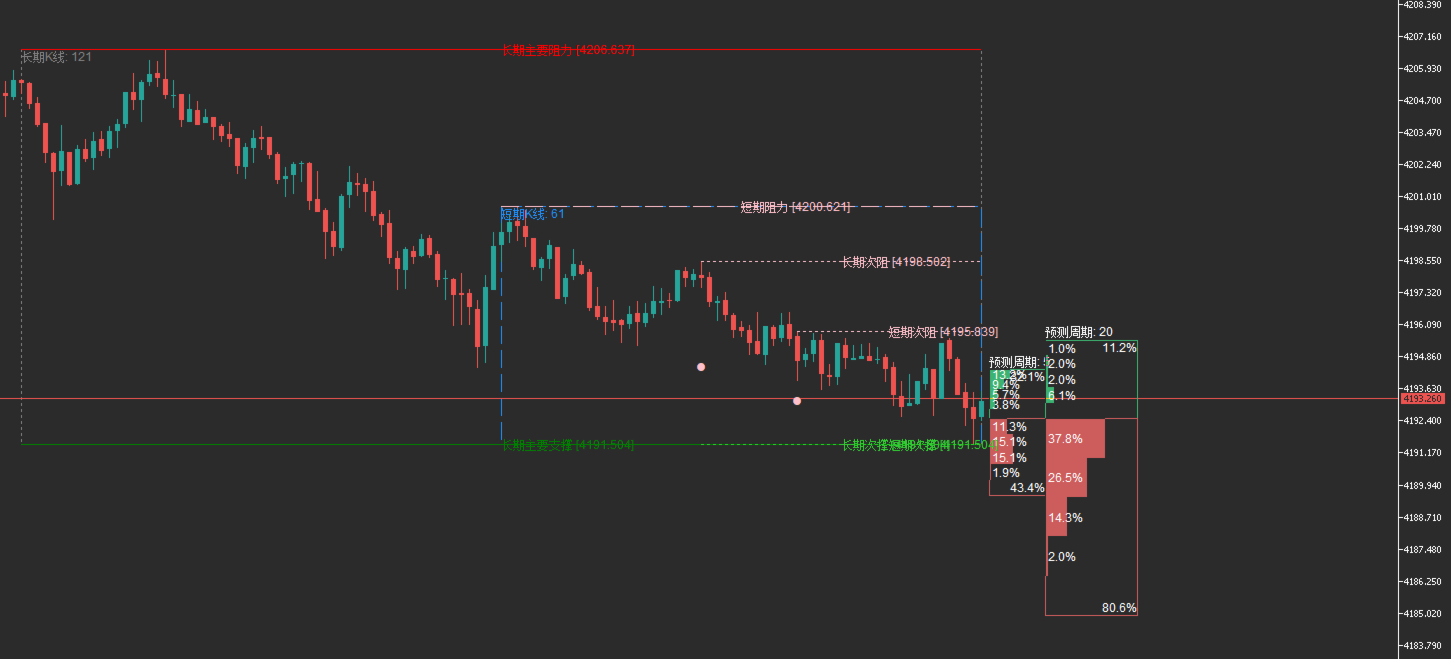
The ProQuant Probability Map is an advanced quantitative tool exclusively designed for MetaTrader 5. Unlike traditional lagging indicators (such as RSI or MACD), it calculates historical price distribution probabilities in real-time, directly projecting a "Heatmap" of potential future price levels onto the right side of your chart.
Version 7 introduces our proprietary "Smart Trend Stabilization" algorithm, which automatically adjusts reversal probabilities near trend exhaustion points, helping you navigate effortlessly between trending and ranging markets.
Core Features & Exclusive Advantages
1. Dual-Horizon Prediction Windows The market is multi-dimensional, and your tools should be too. This indicator runs two core algorithms simultaneously:
-
Short-Term Window: Analyzes the last 60 bars to forecast micro-movements for the next 5 bars—perfect for scalping and capturing intraday volatility.
-
Long-Term Window: Analyzes the last 120 bars to forecast macro-direction for the next 20 bars—helping you identify the main trend and filter out short-term noise.
-
Visual Intuition: Dynamically extending probability bands (short & long) allow you to gauge the bull/bear balance at a single glance.
2. Smart Trend Stabilization (v7 Exclusive) The soul of Version 7. The indicator features a built-in Linear Regression Slope & Volatility Analysis engine:
-
When it detects that a trend is undergoing "stabilization after a surge" or "volatility convergence," the system automatically triggers a Pullback Correction.
-
This means it follows the trend when momentum is strong, but alerts you to increased reversal (pullback) probabilities when the trend is exhausted, protecting you from the risk of chasing highs.
3. Asymmetric Volatility Modeling Prices often rise and fall at different speeds. This indicator abandons standard normal distribution assumptions, calculating upward and downward impulse strengths separately.
-
The height of the generated probability grid (Bins) is dynamically adjusted, perfectly matching the market's current True Volatility (ATR).
4. Automatic Support & Resistance System (Dynamic S/R) No manual drawing required. The indicator automatically backtests historical data to highlight key levels:
-
Solid Lines: Major historical Support/Resistance.
-
Dashed Lines: Minor Support/Resistance.
-
Pink/Green Dotted Lines: Specially calculated 38% Fibonacci Retracement levels—key secondary reversal points often targeted by institutional traders.
5. Probability Momentum Flow Don't just see static probabilities—see how they change!
-
Real-time ↑ ↓ arrows indicate whether the probability for a specific direction is strengthening or weakening.
-
Example: If an uptrend zone shows "↑↑", it means the statistical advantage for a long position is rapidly expanding.
-
Trend Confluence: When the maximum probability zones (the longest bars) of both the "Short-Term" and "Long-Term" forecasts align, it is a high-win-rate entry signal.
-
Pullback Continuation: Watch the 38% Secondary Support (marked by small arrows). Combine this with a rising signal on the short-term probability map for precise trend-pullback entries.
-
Defensive Setup: Use the edges of the History Box as logical Stop-Loss references, and the furthest probability bins as Take-Profit targets.
Fully Customizable Parameters
-
Customizable analysis periods (Short/Long bar counts).
-
Customizable color themes, perfect for Light or Dark charts.
-
Toggle options for Stabilization Correction and Historical Backtest visibility.
ProQuant Probability Map — Turning market uncertainty into visible mathematical probabilities. Download now and experience institutional-grade market insight!