ATR Progress Control
- Indicatori
-
Pavel Malyshko
 Voglio essere onesto e dire parole molto importanti: non fare trading sugli ultimi soldi è molto stressante e questa è una delle regole più importanti relative agli investimenti.
Lascia che tu non compri nulla da me, ma saprò che non stai dando gli ultimi soldi. - Versione: 5.0
- Attivazioni: 20
ATR Progress Control
Trading is all about probability, and if you don't know how much range the price has left today, you're trading blind.
This indicator is your dashboard that answers the most important question before a trade: does it make mathematical sense to enter the market right now? It's a tool for professional volatility analysis that helps filter out false entries and avoid trades when the move is already exhausted.
What's the problem?
Imagine that the average daily movement (ATR) of a currency pair is 1,000 pips. By midday, the price has already moved 950 pips higher. A beginner will see strong momentum and buy. A professional will look at ATR Progress Control, see that the daily limit is 95% exhausted, and refrain from buying, as the probability of continued movement is extremely low.
The indicator saves you from entering at the peak of a move and helps you take profits where others are just starting to open positions.
Functionality
Multi-currency monitoring
You don't need to open dozens of charts. The indicator displays data for your selected instruments in one compact table. You can immediately see the overall market picture.
Power Reserve Visualization
The indicator calculates the average volatility (ATR) for a specified period and compares it to the current price movement. You can see a progress bar and the percentage of the daily range completed.
Clear text statuses
Instead of dry numbers, the program provides a clear assessment of the situation:
Start: The day has just begun, the potential for movement is maximum.
Potential: The best time to find an entry point.
Active: Half of the movement has been completed, be careful.
Completion: The daily limit is almost reached.
Excess: The price has moved beyond the average value, high risk of a reversal or flat.
Extreme: Abnormal volatility.
Calculating Remaining Pips
The indicator displays the specific number of pips the price can theoretically move before reaching the average ATR value. This is essential for accurately setting take profits. If there are 200 pips left to the limit, there's no point in setting a target of 500.
Determining the Intraday Trend
Shows the current day's direction relative to the opening price (buyers or sellers control the day).
Indicator Advantages
Support for 11 languages: the interface switches automatically or can be configured manually (including Russian, English, Chinese, and others).
Full customization: you can change the colors, panel position, font size, and the list of displayed pairs.
Educational tooltips: explanations appear when you hover over panel elements, making the tool easy to understand even for beginners.
Speed: The code is optimized and doesn't overload the terminal even with a large list of symbols.
Who is this tool for?
ATR Progress Control is essential for those tired of catching counter-trend reversals or buying at the very top. This isn't a signal generator, but a powerful filter that brings mathematical validity to your trading. Stop guessing and start using statistics to your advantage.
Indicator Settings and Parameters
The indicator has a flexible settings system, allowing it to be adapted to any trading strategy and terminal color scheme.
Language Settings
Interface Language — select the interface language for the panel. Eleven languages are supported, including Russian, English, Chinese, Spanish, German, and others. This allows traders from different countries to comfortably use the indicator.
Main Settings
ATR Period (days) — the averaging period for the ATR indicator. This key parameter determines the number of days over which average volatility will be calculated. The default value of 14 is suitable for most strategies. Decreasing the value will make the indicator more sensitive to recent changes, while increasing it will display more global statistics.
Symbols — list of financial instruments to monitor. This line should list the tickers of currency pairs, metals, or indices, separated by semicolons (for example: EURUSD; GBPUSD; XAUUSD). It is important to enter the names exactly as they appear in your Market Watch window.
Show Panel — a toggle to hide or show the information panel on the chart.
Show Hints — enable or disable pop-up text hints below the panel that explain the meaning of each bar.
Panel Location
Panel Corner — select the chart corner to which the panel will be anchored (e.g., upper left or lower right).
Offset X / Offset Y — adjust the horizontal and vertical offset of the panel from the selected corner in pixels. Allows precise positioning of the table so it doesn't overlap other chart elements.
Color Settings
The Colors settings block allows you to completely customize the indicator's appearance. You can customize the background, border, titles, main text, as well as colors for different market conditions:
Bullish Color — color for a bullish trend and the initial phase of a movement.
Bearish Color — color for a bearish trend and overbought/oversold zones.
Neutral Color — color for the middle phase of a movement.
Progress Levels
Level 1 (Normal) — the percentage limit up to which a movement is considered initial (default: 50%).
Level 2 (Active) — the percentage limit beyond which a movement is considered complete or excessive (default: 100%).
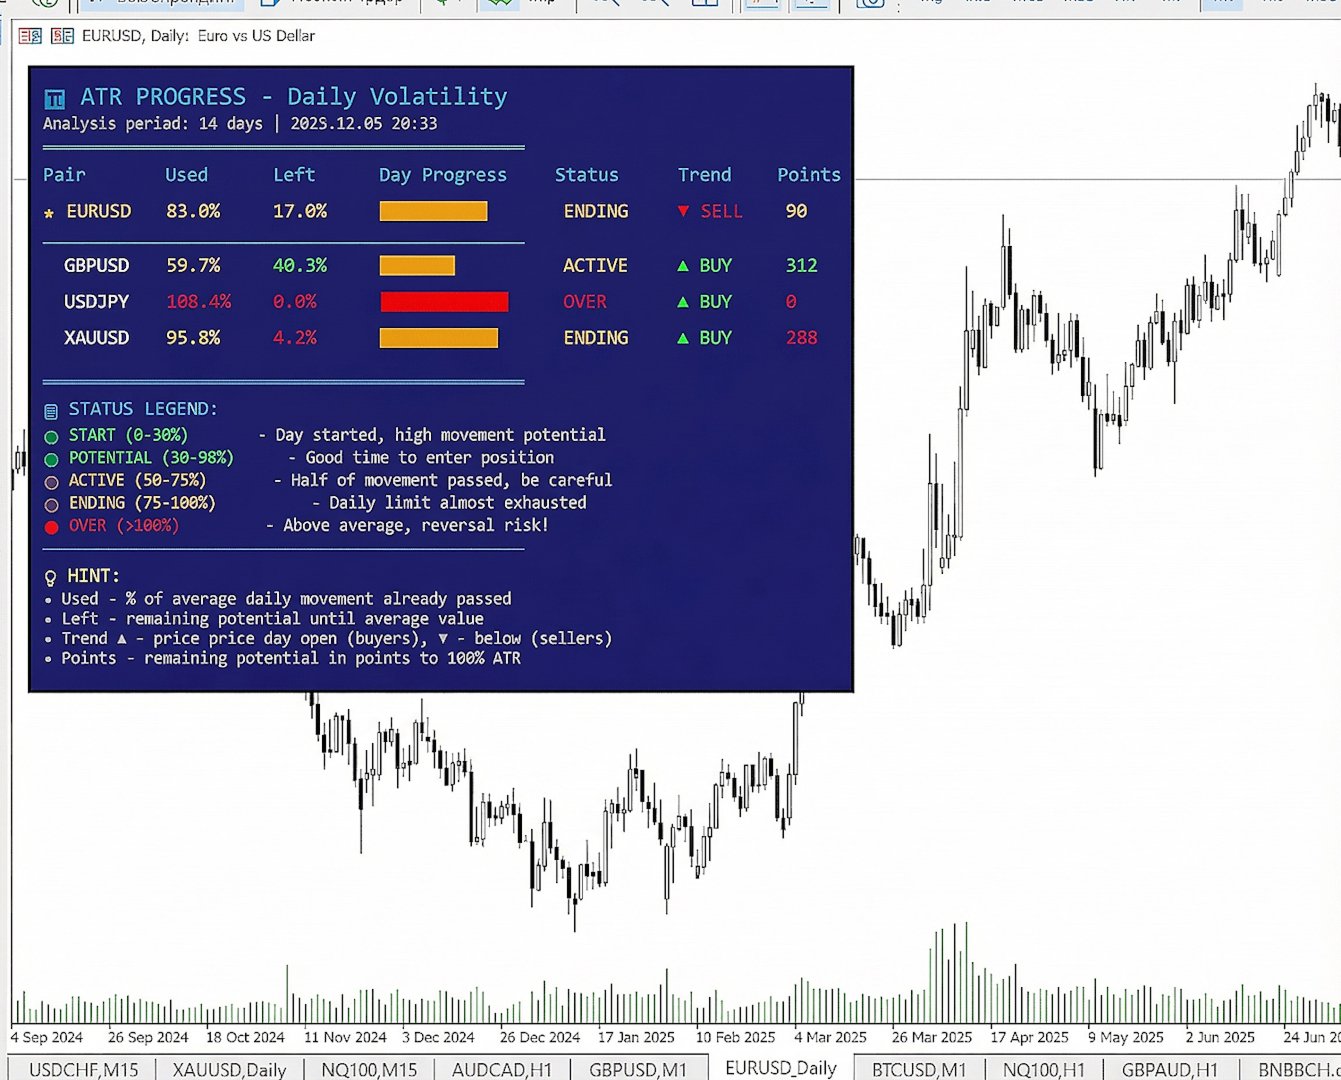
Description of Displayed Data
The indicator panel provides the following information in real time for each symbol in the list:
Pair — the name of the financial instrument.
Completed — the percentage of the average daily move (ATR) that the price has already completed today.
Remaining — the percentage of movement that the price can theoretically complete before reaching the average value.
Daily Progress — a visual scale that clearly shows the degree of "fatigue" of a movement.
Status — a text description of the current situation (start, potential, active, completion, overrun).
Trend — the direction of price movement relative to the opening price of the day. An up arrow means the current price is above the opening price, and a down arrow means it is below the opening price. Pips — the exact number of pips remaining until the average daily range reaches 100%.
This dataset allows you to instantly assess the market situation for several instruments simultaneously without having to switch charts.