Guarda i video tutorial del Market su YouTube
Come acquistare un Robot di Trading o un indicatore
Esegui il tuo EA
hosting virtuale
hosting virtuale
Prova un indicatore/robot di trading prima di acquistarlo
Vuoi guadagnare nel Market?
Come presentare un prodotto per venderlo con successo
Indicatori tecnici per MetaTrader 4 - 7
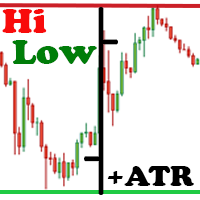
The Hi Low Last Day ( Hi Lo Last Day ) indicator shows the high and low of the last trading day and the second trading day, as well as the minimum and maximum of last week . There are many trading strategies on the daily levels. This indicator is indispensable when using such trading strategies. In fact, everything is simple in trading, you just need to understand and accept it for yourself. There is only price!!! What is price? This is the level on the chart. The level is the price that the

This indicator is another variant of the famous powerful indicator Fibonacci-SS https://www.mql5.com/en/market/product/10136 but has different behaviour in placing Pending Order and TP Line. Automatically places Fibonacci retracement lines from the last highest and lowest visible bars on the chart with: An auto Pending Order (Buy/Sell). Taking Profit 1, Taking Profit 2 is pivot point and Taking Profit 3 for extended reward opportunity. The best risk and reward ratio.
Simple and powerful indicat

This is an advanced multi-timeframe version of the popular Hull Moving Average (HMA). Features Graphical panel with HMA indicator data from all timeframes at the same time . If the HMA has switched its direction on any timeframe, a question mark or exclamation mark is displayed on the panel, accompanied by a text and audio message. The messages can be configured separately for each timeframe using the corresponding checkboxes.
The indicator is located in a separate window, so as not to overload

It works based on the Stochastic Indicator algorithm. Very useful for trading with high-low or OverSold/Overbought swing strategies. StochSignal will show a buy arrow if the two lines have crossed in the OverSold area and sell arrows if the two lines have crossed in the Overbought area. You can put the Stochastic Indicator on the chart with the same parameters as this StochSignal Indicator to understand more clearly how it works. This indicator is equipped with the following parameters: Inputs d
FREE

Questo è un prodotto gratuito che puoi utilizzare per le tue esigenze!
Inoltre apprezzo molto i tuoi feedback positivi! Grazie mille!
Clicca qui per vedere robot e indicatori di trading di alta qualità!
Indicatore Crypto_Forex: candele Heiken Ashi per MT4. Nessuna riverniciatura. - Heiken_Ashi_Candles ha una grande combinazione con l'indicatore Trend Line MA come nell'immagine. - L'indicatore Heiken_Ashi_Candles è un indicatore ausiliario molto utile per rendere la tendenza più visibile. - È
FREE

Questo indicatore informativo sarà utile per coloro che vogliono essere sempre informati sulla situazione attuale del conto. L'indicatore mostra dati come profitto in punti, percentuale e valuta, nonché lo spread per la coppia corrente e il tempo fino alla chiusura della barra nell'intervallo di tempo corrente. VERSIONE MT5 - Indicatori più utili
Esistono diverse opzioni per posizionare la linea delle informazioni sulla carta: A destra del prezzo (corre dietro al prezzo); Come commento (nell'
FREE

The Anchored VWAP Indicator for MetaTrader 4 gives you full control over where your VWAP starts. Instead of being locked to session opens or fixed times,
you simply drag the anchor point on the chart , and the VWAP instantly recalculates from that exact bar.
This makes it perfect for analyzing:
• Institutional entry zones
• Breakout origins
• Swing highs/lows
• News reaction points
• Trend continuations Key Features Drag & Drop Anchor Point : Move the starting point directly on the cha
FREE

About: Someone recently shared a pinescript with me. And asked me to convert it to MT4. I found the FVG blocks very effective as SR areas. So here it is. Enjoy!!
What are Fair Value Gaps (FVG)? Fair Value Gaps occur when price moves so quickly that it creates an imbalance between buyers and sellers. These gaps represent areas where price "skipped" levels, creating potential zones for price to return and "fill the gap". Think of it as unfinished business in the market that often gets revisited.
FREE

MT4 Multi-timeframe Order Blocks detection indicator. Features - Fully customizable on chart control panel, provides complete interaction. - Hide and show control panel wherever you want. - Detect OBs on multiple timeframes. - Select OBs quantity to display. - Different OBs user interface. - Different filters on OBs. - OB proximity alert. - ADR High and Low lines. - Notification service (Screen alerts | Push notifications). Summary Order block is a market behavior that indicates order collection
Descrizione
SMA Reentry è un indicatore per MetaTrader 4 progettato per identificare punti di rientro nel trend principale. Utilizza due medie mobili semplici: una veloce per catturare i movimenti a breve termine e una lenta per filtrare la direzione generale del mercato. Un segnale di acquisto si verifica quando la media veloce è sopra la lenta e il prezzo rientra sopra la veloce dopo essere stato sotto nella candela precedente. Un segnale di vendita si verifica quando la media veloce è sotto
FREE
Volumatic Fair Value Gaps is a precision-engineered indicator for identifying, analyzing, and visualizing Fair Value Gaps (FVGs) backed by volume intelligence. This tool goes beyond standard FVG plotting by dissecting volume dynamics inside each gap using lower-timeframe sampling , offering clear insight into whether bulls or bears dominate the imbalance. Designed for technical traders, this indicator overlays high-probability gaps only, visualizes bullish vs. bearish volume compositio

Free automatic Fibonacci is an indicator that automatically plots a Fibonacci retracement based on the number of bars you select on the BarsToScan setting in the indicator. The Fibonacci is automatically updated in real time as new highest and lowest values appears amongst the selected bars. You can select which level values to be displayed in the indicator settings. You can also select the color of the levels thus enabling the trader to be able to attach the indicator several times with differe
FREE
Welcome to enhanced pattern detection with the Double Top and Bottom Pattern Scanner ! Transform your trading approach with this powerful MT4 indicator designed for efficient pattern scanning and actionable alerts. Key Features: Advanced Zig Zag Pattern Detection : The Double Top and Bottom Pattern Scanner uses the zig zag pattern to detect tops and bottoms. It identifies points where the price bounces back twice from the same level after a long trend, signaling potential market reversals. Real

L'indicatore VR Donchian è una versione migliorata del canale Donchian. I miglioramenti hanno interessato quasi tutte le funzioni del canale, ma l'algoritmo operativo principale e la costruzione del canale sono stati preservati. All'indicatore a sfera è stato aggiunto un cambiamento nel colore dei livelli a seconda della tendenza attuale: questo mostra chiaramente al trader un cambiamento di tendenza o un livello piatto. È stata aggiunta la possibilità di informare il trader del superamento di u
FREE

Renko Charts with Heiken Ashi Filter now have the alerts and the Win-rate . Now you can know which signal will give you that edge your trading needs. Risk to Reward Settings Wins versus Losses Count There are four alert types to choose from for notification on screen, email or phone notification. The alert types also have buffers for use with automation. This indicator can be incorporated with any system that requires renko charts. The four (4) alert types are: Three-bar Formation ; Pinbar
La pendenza media mobile di Quants è un indicatore molto potente per dare indicazione direzionale e slancio. L'indicatore non viene ridipinto. È possibile calcolare l'angolo ma in modo efficiente e trovare la tendenza.
Il conteggio dei profitti inizia una volta chiusa la candela di segnale. Quindi sono i risultati esatti che sarebbero in diretta.
TimeFrame suggerito lo sta usando su H1. Tutte le opzioni dell'indicatore sono modificabili.
Suggerimenti: oscillazioni commerciali e direzioni di b
FREE

Benvenuti nel nostro modello di ondata di prezzo MT4 --(modello ABCD)-- Il modello ABCD è un modello di trading potente e ampiamente utilizzato nel mondo dell'analisi tecnica.
È un modello di prezzo armonico che i trader utilizzano per identificare potenziali opportunità di acquisto e vendita sul mercato.
Con il modello ABCD, i trader possono anticipare potenziali movimenti di prezzo e prendere decisioni informate su quando entrare e uscire dalle negoziazioni. Versione EA: Price Wave
FREE

Presentazione Quantum Breakout PRO , l'innovativo indicatore MQL5 che sta trasformando il modo in cui scambi le zone di breakout! Sviluppato da un team di trader esperti con un'esperienza di trading di oltre 13 anni, Quantum Breakout PRO è progettato per spingere il tuo viaggio di trading a nuovi livelli con la sua strategia innovativa e dinamica della zona di breakout.
Quantum Breakout Indicator ti fornirà frecce di segnalazione sulle zone di breakout con 5 zone target di profitt
Scalping Edge Pro Indicator Unleash the Power of Precision Trading: Introducing Scalping Edge Pro Tired of market noise and conflicting signals that cloud your judgment? Are you searching for a tool that delivers the clarity and confidence needed to seize rapid opportunities in volatile markets? Scalping Edge Pro is the engineered solution designed for traders who demand precision and professionalism in every trade. It is meticulously calibrated for peak performance on the 15-minute (M15) timef
FREE

MACD indicator in MetaTrader 4/5 looks different than MACD does in most other charting software. That is because the MetaTrader 4/5 version of MACD displays the MACD line as a histogram when it is traditionally displayed as a line. Additionally, the MetaTrader 4/5 version computes the Signal line using an SMA, while according to MACD definition it is supposed to be an EMA. The MetaTrader 4/5 version also does not compute a true MACD Histogram (the difference between the MACD/Signal lines). This
FREE
False Breakout MT4 è un indicatore pensato per individuare i casi in cui il prezzo rompe temporaneamente un livello recente di supporto o resistenza per poi rientrare rapidamente nel range precedente. Questi falsi breakout sono utili per analisi discrezionali o strategie contrarian, offrendo segnali visivi chiari senza fare previsioni automatiche. Caratteristiche principali: Rilevazione automatica dei falsi breakout su massimi e minimi recenti (es. daily estesi su 2 giorni). Rappresentazione vis
FREE

Have you ever asked yourself why your supply and demand zones fail , even when everything looks “perfect”? The truth is, you're not wrong — you're just watching the reaction, not the reason. It's not like those random currency strength meters that rely on lagging indicators like RSI, CCI, or similar tools mashed together to guess strength or weakness. That approach reacts to the past — not the cause. Pairs like EURUSD or USDJPY are just the outcomes . The real drivers? Currency indices and inst

A simple indicator that automatically highlights all FVGs (Fair Value Gaps) formed on the chart, as well as FVGs on history. It is possible to select colors for FVGs of different directions (long or short), select the time interval, select the color of middle point and you can also choose whether to delete filled FVGs or leave them on the chart (the option is beneficial for backtesting). The indicator can be very useful for those, who trade according to the concept of smart money, ICT, or simply
FREE

RSI Entry Points is the upgrade of the standard RSI indicator to avoid lagging. Indicator draws the clouds and the arrows to have clear picture where price is and what to wait for. Why standard RSI is lagging? because mostly we do not use it correctly and it is with very weak visual flexibility, less informative. With my current upgrade I tried to Fix both problems same time and I got much better results and more exact entries than standard RSI has. I Made RSI line Dynamic, it gets more flexible
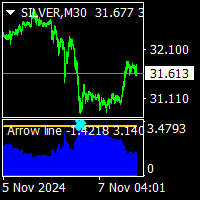
Arrow line indicator is no repaint trend indicator. it works on all time frame and all pairs. it is a pi number ( π) trigger based trend indicator. suitable for experienced traders and beginners. easy to understand. there is a trigger line and 2 histograms. red histogram is ower trigger that is top signal.. blue histogram is over trigger that is bottom signal. minimum bar number is 500. processed value must be setled between 500-3000. max value is depend to chart you are using.
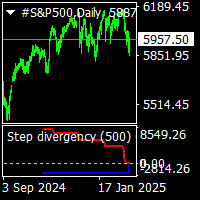
step divergency indicator is a buy sell divergency indicator.include sinus wave indicator. it work all timeframes and all pairs. red line gives step divergency sell formations. blue line gives step divergency buy formations. suitable for experienced and beginners. when prices is moving up and red lines step down ..this is sell divergecy formation and if prices moving down but blue line moving step up this is buy divergency formation. increased cnt value show more back side. gold line is sinus w

The indicator plots higher timeframe Kijun-sen (of Ichimoku ) on lower timeframes.
To change timeframes, in the timeframe field enter the number:
M1 PERIOD_M1 1 1 minute. M5 PERIOD_M5 5 5 minutes. M15 PERIOD_M15 15 15 minutes. M30 PERIOD_M30 30 30 minutes. H1 PERIOD_H1 60 1 hour. H4 PERIOD_H4 240 4 hour. D1 PERIOD_D1 1440 Daily. W1 PERIOD_W1 10080 Weekly. MN1 PERIOD_MN1 43200 Monthly.
By default, the Kijun is shifted 3 periods forward but if you wish to have it exactly as

The GGP Squeeze Momentum MT4 Indicator is a volatility and momentum tool designed to help traders optimize their trading performance and providing traders with actionable insights to make well-informed trading decisions. This indicator is MT4 conversion of the Squeeze Momentum Indicator by “LazyBear “ in Trading View website and some alert methods are added to provide real-time alerts when a trading signal is generated, in order to allow traders to act quickly and efficiently. For MT5 version p

Presenting the uGenesys Break of Structure and Change of Character Indicator The uGenesys Market Structure Indicator is the advanced solution designed specifically for forex traders seeking a competitive edge. This innovative tool goes beyond merely identifying Break of Structure (BoS) and Change of Character (CHoC); it also illuminates optimal entry and exit points on your forex charts, transforming your trading experience.
While the uGenesys Market Structure Indicator can reveal pivotal pat

Introducing Auto Trendline Pro : Your Ultimate Trading Companion Are you tired of manually drawing trendlines on your forex charts? Do you wish for a tool that can simplify your trading while providing timely alerts? Look no further, because Auto Trendline Pro is here to revolutionize your trading experience. In the fast-paced world of forex trading, staying ahead of the curve is essential. Identifying trends, both upward and downward, can be a game-changer. This is where Auto Trendline Pro s
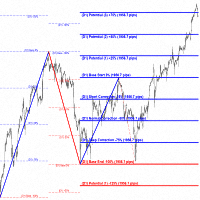
"Impulses and Corrections 4" is created to help traders navigate the market situation. The indicator shows multi-time frame upward and downward "Impulses" of price movements. These impulses are the basis for determining the "Base" , which is composed of zones of corrections of price movements, as well as "Potential" zones for possible scenarios of price movement.
Up and down impulses are determined based on a modified formula of Bill Williams' "Fractals" indicator. The last impulse is always "U

The KT 4 Time Frame Trend is an invaluable forex indicator for traders seeking to identify the trend direction across 4-time frames accurately. This innovative indicator allows users to simultaneously observe and analyze price trends across four different timeframes. Whether you're a beginner or an experienced trader, this tool offers an enhanced understanding of trend dynamics, leading to improved trading strategies on your trading platform. The capability to concurrently monitor multiple timef

Introducing the "Extreme Exhaustion Levels": A powerful tool for traders looking to identify market exhaustion and potential trend reversals. The Exhaustion Indicator is an advanced technical analysis tool that helps traders identify when markets are overbought or oversold, potentially indicating an imminent reversal in the trend. With a unique combination of price action, moving averages, and Bollinger Bands, the Exhaustion Indicator provides traders with a comprehensive view of market condit
The Ichimoku indicator is an entire system by itself with an amazing win rate many traders feel that the chart looks like a mess when we add the indicator to the chart this is because there are too many elements present in the indicator we have a solution for that now "TT Ichimoku on off button indicator" ABOUT THIS INDICATOR This is an Ichimoku indicator that has the toggle feature separately for every element ie. Kumo cloud button, kijun button, etc... you can also hide/show the indicator

40% off. Original price: $50 (Ends on February 15) Advanced Bollinger Bands Scanner is a multi symbol multi timeframe Bollinger bands dashboard that monitors and analyzes the Bollinger Bands indicator from one chart. This panel monitors the Bollinger bands indicator in up to 28 configurable instruments and 9 timeframes for price overbought/oversold, price consolidation (Bollinger bands squeeze), and consolidation breakout (squeeze break) with a deep scan feature to scan all market watch symbo
25% off. Original price: $40 (Ends on February 15) RSI Scanner is a multi symbol multi timeframe RSI dashboard that monitors Relative Strength Index indicator for price entering and exiting overbought and oversold in up to 28 symbols and 9 timeframes.
Download Demo here (Scans only M1 and M5) Settings description here MT5 version here
RSI Scanner features: Signals RSI entering and exiting the overbought and oversold zones. Monitors 28 customizable instruments and 9 timeframes at the sam
Migliora il tuo trading di price action con l'indicatore Higher Highs and Lows MT4, uno strumento robusto che sfrutta l'analisi frattale per individuare punti di swing chiave e identificare pattern che definiscono il trend come Higher Highs (HH), Lower Highs (LH), Lower Lows (LL) e Higher Lows (HL) per insight chiari sulla direzione del mercato. Tratto dai principi fondamentali di price action radicati nella Teoria di Dow dei primi del 1900 e popolari nel trading moderno da esperti come Al Brook
FREE

IX Power: Scopri approfondimenti di mercato per indici, materie prime, criptovalute e forex Panoramica
IX Power è uno strumento versatile progettato per analizzare la forza di indici, materie prime, criptovalute e simboli forex. Mentre FX Power offre la massima precisione per le coppie di valute utilizzando i dati di tutte le coppie disponibili, IX Power si concentra esclusivamente sui dati di mercato del simbolo sottostante. Questo rende IX Power una scelta eccellente per mercati non correlat

Il dashboard di avviso ADR ti mostra a colpo d'occhio dove il prezzo è attualmente scambiato in relazione al suo normale intervallo medio giornaliero. Riceverai avvisi istantanei tramite pop-up, e-mail o push quando il prezzo supera la sua gamma media e livelli superiori a tua scelta in modo da poter saltare rapidamente a pullback e inversioni. Il trattino è progettato per essere posizionato su un grafico vuoto e semplicemente sedersi in background e avvisarti quando i livelli vengono raggiunti
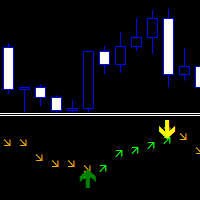
Direction Change Detector - un indicatore di tendenza che distingue tra movimenti rialzisti e ribassisti. Presenta due linee di frecce con segnali che ne confermano la direzione.
Può funzionare come indicatore autonomo per individuare una tendenza o come strumento aggiuntivo per aprire le negoziazioni e seguire le indicazioni del segnale.
Adattabile a qualsiasi mercato e periodo temporale. Non ridipinge la sua testimonianza nella storia. Esistono diversi tipi di notifiche. Le frecce verdi che pu
FREE
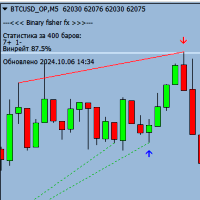
Binary Fisher FX è un potente indicatore di opzioni binarie che funziona su qualsiasi intervallo di tempo e con qualsiasi coppia di valute. Questo indicatore è progettato per identificare i movimenti di tendenza e indica i punti di ingresso sotto forma di freccia prima della chiusura della candela corrente.
Principali caratteristiche dell'indicatore:
Funziona su qualsiasi intervallo di tempo (M1, M5, M15, M30, H1, H4, D1) Supporta qualsiasi coppia di valute Scadenza da 1 a 3 candele (default
FREE
Our modernised version of the popular Order Blocks Indicator for MT4 identifies major trend reversal and momentum exhaustion points by providing arrow signals on the chart. As a result, traders can identify bullish and bearish price reversal zones and BUY and SELL accordingly. Moreover, the indicator provides Buy and Sell Arrow signals.
An order block is a market structure that is defined as the last bearish candle before a bullish price move and vice versa. These order blocks act as support a
FREE

MACD divergence indicator finds divergences between price chart and MACD indicator and informs you with alerts (popup, mobile notification or email). Its main use is to find trend reversals in the chart. Always use the divergence indicators with other technical assets like support resistance zones, candlestick patterns and price action to have a higher possibility to find trend reversals. Three confirmation type for MACD divergences: MACD line cross zero level Price returns to previous H/L Creat
FREE
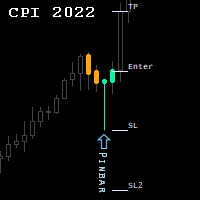
Candlestick Patterns Indicator.
NEW! FREE Candlestick Patterns Expert Advisor > https://www.mql5.com/en/market/product/105634?source=Site +Profile
The Indicator draws colored candlestick patterns, their description and future levels of Stop Loss / Take Profit. Combined with other market analysis, can greatly improve trading results. Indicator can be highly customized by the user including change of colors, fonts, levels, candle sizes etc...
developed, tested and optimized on " VantageMark
FREE
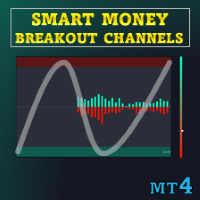
Offerta speciale : ALL TOOLS , solo $35 ciascuno! Nuovi strumenti a $30 per la prima settimana o per i primi 3 acquisti ! Canale Trading Tools su MQL5 : unisciti al mio canale MQL5 per ricevere le ultime novità Questo indicatore traccia zone di rilevamento del breakout, denominate “Smart Breakout Channels”, basate sul movimento dei prezzi normalizzato per la volatilità. Queste zone sono visualizzate come box dinamici con overlay di volume. Lo strumento rileva range temporanei di ac

Venom Trend Pro — Strumento di Analisi delle Tendenze Multi-Timeframe Venom Trend Pro è un indicatore di trend-following e swing trading progettato per aiutare a identificare movimenti direzionali chiari su qualsiasi coppia e timeframe. Funziona bene per configurazioni intraday e swing su Forex, oro, criptovalute, indici e altro ancora. L'indicatore analizza la struttura dei prezzi recenti e il momentum per rilevare tendenze emergenti o in corso. Una volta confermata una tendenza, i segnali rima
FREE

Questo indicatore viene utilizzato per visualizzare le posizioni piatte e di tendenza. Il design si basa su un oscillatore. Viene utilizzato come filtro aggiuntivo, sia per il trading su un grafico normale che per le opzioni binarie. Le posizioni piatte vengono utilizzate nell'indicatore UPD1 volume Cluster per il trading secondo il concetto di Smart Money. Un avviso incorporato segnala i luoghi più ipercomprati / ipervenduti.
Parametri di input.
Impostazioni di base. Bars Count - specificare
FREE
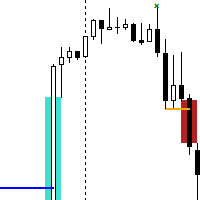
The Break of Structure (BoS) and Change of Character indicator with Fair Value Gap (FVG) filter is a specialized tool designed to enhance trading strategies by pinpointing high-probability trading opportunities on price charts. By integrating the BoS and Change of Character concepts with the FVG formation, this indicator provides traders with a robust filtering mechanism to identify optimal entry and exit points. The indicator identifies instances where the structure of price movements is disrup
FREE

Introducing Volume Orderflow Profile , a versatile tool designed to help traders visualize and understand the dynamics of buying and selling pressure within a specified lookback period. Perfect for those looking to gain deeper insights into volume-based market behavior! MT5 Version - https://www.mql5.com/en/market/product/122657 The indicator gathers data on high and low prices, along with buy and sell volumes, over a user-defined period. It calculates the maximum and minimum prices during this

Rivelare le Visioni del Trading con Auto Anchored VWAPs: Auto Anchored VWAPs sono la tua guida nel mondo del trading. Questi indicatori individuano i punti cruciali di inversione del mercato e li illustrano sul tuo grafico utilizzando le linee VWAP. Questo rappresenta un cambiamento epocale per i trader che utilizzano strategie ancorate alle VWAP. Come Funziona? Identificazione dei Punti Altai: Se il prezzo più alto della candela corrente è inferiore al prezzo più alto della candela precedente,

Auto Optimized MFI è un indicatore auto-adattivo che si regola automaticamente in base al tuo mercato e timeframe, utilizzando simulazioni di trading reale su dati storici. A differenza degli indicatori tradizionali che si basano su soglie fisse come 80/20, questo strumento si adatta al comportamento reale di prezzo e volume per individuare zone di acquisto e vendita più efficaci. Come funziona Analizza le candele storiche su un intervallo personalizzabile ed esegue simulazioni di entrata e usci

Bande di Bollinger Auto-Ottimizzate – Strumento adattivo di volatilità basato sul comportamento reale del mercato Questo indicatore avanzato per MT4 trova automaticamente i migliori periodi e deviazioni standard simulando operazioni sui dati storici. Invece di parametri fissi, si adatta dinamicamente ai cambiamenti del mercato e alla struttura dei prezzi per creare bande che riflettono più accuratamente la volatilità in tempo reale. Nessuna regolazione manuale necessaria. Funzionalità principali
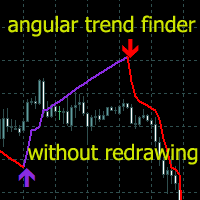
Gli indicatori di tendenza sono uno degli ambiti dell'analisi tecnica utilizzati nel trading sui mercati finanziari.
Indicatore Angular Trend Lines : determina in modo completo la direzione del trend e genera segnali di ingresso. Oltre a levigare la direzione media delle candele
Utilizza anche l'angolo di inclinazione delle linee di tendenza. Il principio di costruzione degli angoli di Gann è stato preso come base per l'angolo di inclinazione.
L'indicatore di analisi tecnica combina l'andamento
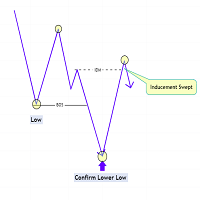
The Market Structure with Inducements & Sweeps indicator is a unique take on Smart Money Concepts related market structure labels that aims to give traders a more precise interpretation considering various factors.
Compared to traditional market structure scripts that include Change of Character (CHoCH) & Break of Structures (BOS) -- this script also includes the detection of Inducements (IDM) & Sweeps which are major components of determining other structures labeled on the chart.
SMC & pri
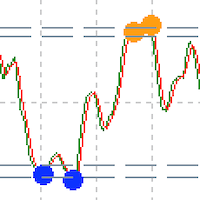
About RSI CyberZingFx RSI, a powerful MT4 indicator designed to provide traders with accurate signals and insights into the strength or weakness of a stock or market. Whether you are a seasoned trader or just starting out, CyberZingFx RSI can help you make informed trading decisions. Indicator Features
One of the standout features of CyberZingFx RSI is its unique technique for finding the best entry points to trade. By analyzing historical data and identifying oversold or overbought levels, thi
FREE
Questo indicatore traccia zone di domanda e offerta sul grafico. In combinazione con le tue regole e tecniche, questo indicatore ti consentirà di creare (o migliorare) il tuo potente sistema. Dai un'occhiata anche alla versione a pagamento che offre molto di più. Il mio consiglio è di cercare opportunità di trading in cui il primo test di zona si verifica dopo almeno 25 barre. Caratteristiche Le zone hanno 3 colori (regolabili tramite input). Colore scuro per la zona non testata, medio per l
FREE
KT Trend Trading Suite è un indicatore multifunzione che combina una strategia di trend following con diversi punti di breakout come segnali di ingresso.
Una volta che una nuova tendenza è stata identificata, l’indicatore offre numerose opportunità di ingresso per seguire con successo il trend. Una soglia di pullback viene utilizzata per evitare segnali di ingresso poco rilevanti.
La versione MT5 è disponibile qui https://www.mql5.com/en/market/product/46270
Caratteristiche
Combina diverse
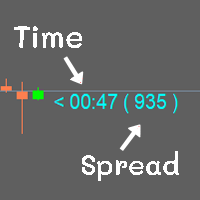
Show the time of candlesticks and spread. All data will be displayed in a rod. Can change color Can fix the size as needed
MT4 : Link https://www.mql5.com/en/market/product/102742 MT5 : Link https://www.mql5.com/en/market/product/102834
Most free code on various websites I didn't write it myself. I only do a little bit.
If you like it, please give 5 stars with it. Thank you.
FREE

L’indicatore ACB Breakout Arrows fornisce un segnale di ingresso cruciale rilevando uno specifico pattern di breakout. Monitora costantemente il grafico alla ricerca di un momentum stabile in una direzione e segnala con precisione l’ingresso poco prima del movimento principale.
Ottieni lo scanner multi-simbolo e multi-timeframe qui - Scanner per ACB Breakout Arrows MT4
Caratteristiche principali Lo Stop Loss e il Take Profit sono calcolati automaticamente dall'indicatore. Include una dashboard

MACD Intraday Trend è un indicatore sviluppato attraverso un adattamento del MACD originale creato da Gerald Appel negli anni '60. Attraverso anni di trading è stato osservato che modificando i parametri del MACD con le proporzioni di Fibonacci otteniamo una migliore presentazione della continuità dei movimenti di tendenza, rendendo possibile rilevare in modo più efficiente l'inizio e la fine di un trend di prezzo. Grazie alla sua efficienza nel rilevare l'andamento dei prezzi, è anche possibil
FREE

Media Mobile Adattiva AMD (AAMA)
AAMA è un indicatore di media mobile adattiva per MetaTrader 4 che regola automaticamente la sua reattività in base alle condizioni di mercato. Caratteristiche principali: Media mobile adattiva basata sul Rapporto di Efficienza di Kaufman – reagisce rapidamente durante i trend e filtra il rumore nelle fasi laterali Rilevamento automatico delle 4 fasi di mercato AMD: Accumulazione, Markup (rialzo), Distribuzione, Markdown (ribasso) Adattamento alla volatilità tra

Auto Optimized RSI: Adattamento Professionale al Mercato La maggior parte dei trader fallisce perché utilizza strumenti statici in un mercato dinamico. Usare livelli RSI fissi come 70/30 su ogni grafico è un errore matematico. Se cerchi una "freccia magica" senza logica, questo indicatore non fa per te. Questo strumento è progettato per chi comprende che l'Ottimizzazione è l'unica chiave per sopravvivere nel trading. Gli indicatori classici non tengono conto del simbolo o del timeframe che stai

L'indicatore mostra il profitto (perdita) sul simbolo corrente. Puoi trascinare e rilasciare liberamente la linea per visualizzare il profitto o la perdita corrente.
Puoi trovare i miei prodotti qui .
Parametri Calculation in money or in points — calcola il profitto/perdita in punti o denaro. Add pending orders to calculate — prendi in considerazione gli ordini in sospeso nei calcoli. Magic Number (0 - all orders on symbol) — numero magico, se è necessario valutare ordini specifici. Offset fo
FREE

Questo indicatore si basa sul famoso indicatore frattale ma con molta personalizzazione e flessibilità,
questo è un potente strumento per identificare le inversioni di tendenza e massimizzare il potenziale di profitto.
Con le sue funzionalità avanzate e l'interfaccia intuitiva, è la scelta definitiva per i trader di tutti i livelli. Versione MT5: Ultimate Fractals MT5 Caratteristiche :
Conteggio candele frattali personalizzabili. Linee di inversione. Impostazioni personalizzabili. Interfac
FREE

YOU CAN NOW DOWNLOAD FREE VERSIONS OF OUR PAID INDICATORS . IT'S OUR WAY OF GIVING BACK TO THE COMMUNITY ! >>> GO HERE TO DOWNLOAD
The Volatility Ratio was developed by Jack D. Schwager to identify trading range and signal potential breakouts. The volatility ratio is defined as the current day's true range divided by the true range over a certain number of days N (i.e. N periods). The following formula is used to calculate the volatility ratio: Volatility Ratio (VR) = Today's True Range/Tru
FREE
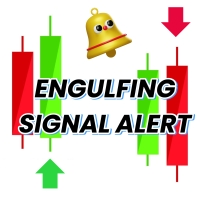
Engulfing Candle Signal Alert: Elevate Your Trading Strategy Unlock the full potential of your trading with the Engulfing Candle Signal Alert, the ultimate tool for identifying market reversals and enhancing your trading precision. Designed specifically for traders who value accuracy and timely alerts, this powerful indicator detects engulfing candle patterns, a key signal in technical analysis that often indicates a potential shift in market direction. What is an Engulfing Candle? An engu
FREE

Fractals Dynamic Fractals Dynamic – è un indicatore frattale gratuito modificato di Bill Williams, in cui è possibile impostare manualmente il numero di barre a sinistra e a destra, costruendo così modelli unici sul grafico. Ora tutte le strategie di trading basate o basate sull'indicatore Fractals Dynamic avranno un segnale aggiuntivo.
Inoltre, i frattali possono fungere da livelli di supporto e resistenza. E in alcune strategie di trading, mostra i livelli di liquidità. A questo scopo sono
FREE

Trading doesn’t have to be complicated. With the right visual guidance, market decisions become clearer, calmer, and more confident.
Nebula Arrow is designed to help traders focus on what truly matters: high-quality entries based on refined market behavior. Just load it on your chart and let the arrows guide your trading decisions. Trade With Confidence We believe that simplicity is power. Nebula Arrow was created after extensive market observation and practical research, transforming complex
FREE

Indicatore di struttura di mercato per visualizzare Break of Structure (BOS) e sweep di liquidità basati sul price action. Solo a scopo di analisi. BOS Liquidity Sweep – Indicatore di struttura di mercato (MT4) Questo indicatore visualizza Break of Structure (BOS) e sweep di liquidità direttamente sul grafico utilizzando price action puro e analisi della struttura di mercato. È progettato come strumento di analisi visiva e non esegue operazioni automaticamente. Concetto I mercati finanziari
FREE
READ THE DESCRIPTION ITS IMPORTANT - ONLY TAKES 2 MINUTES - THIS IS A TOOL NOT A TRADING STRATEGY
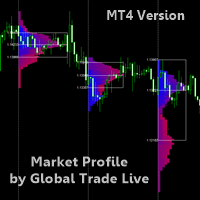
Market Profile By Global Trade Live A Market Profile is a graphical representation that combines price and time information in the form of a distribution. A Market Profile is used to determine elapsed time, number of ticks and volumes traded at specific prices, or over a price interval, over a given period. A Market Profile also makes it possible to identify prices accepted or rejected by the mark
FREE
Il MetaTrader Market è un negozio online unico di robot di trading e indicatori tecnici.
Leggi il promemoria utente di MQL5.community per saperne di più sui servizi unici che offriamo ai trader: copia dei segnali di trading, applicazioni personalizzate sviluppate da freelance, pagamenti automatici tramite il Sistema di Pagamento e il MQL5 Cloud Network.
Ti stai perdendo delle opportunità di trading:
- App di trading gratuite
- Oltre 8.000 segnali per il copy trading
- Notizie economiche per esplorare i mercati finanziari
Registrazione
Accedi
Se non hai un account, registrati
Consenti l'uso dei cookie per accedere al sito MQL5.com.
Abilita le impostazioni necessarie nel browser, altrimenti non sarà possibile accedere.