MacroStructure

*** 1 MONTH FREE ***


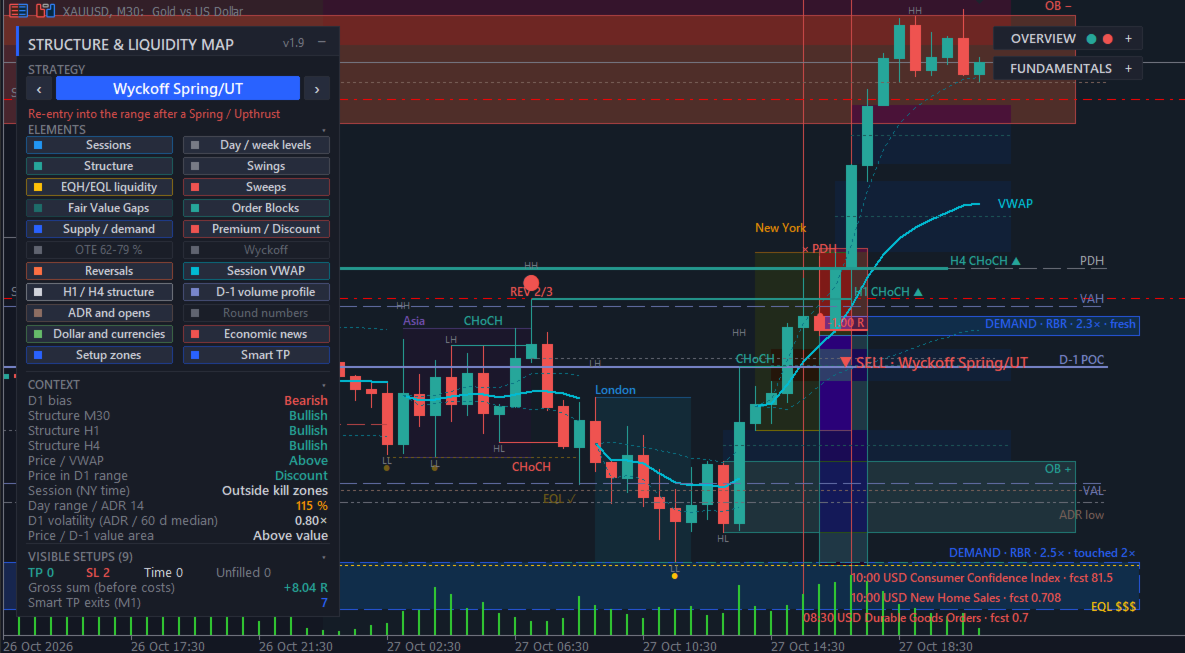
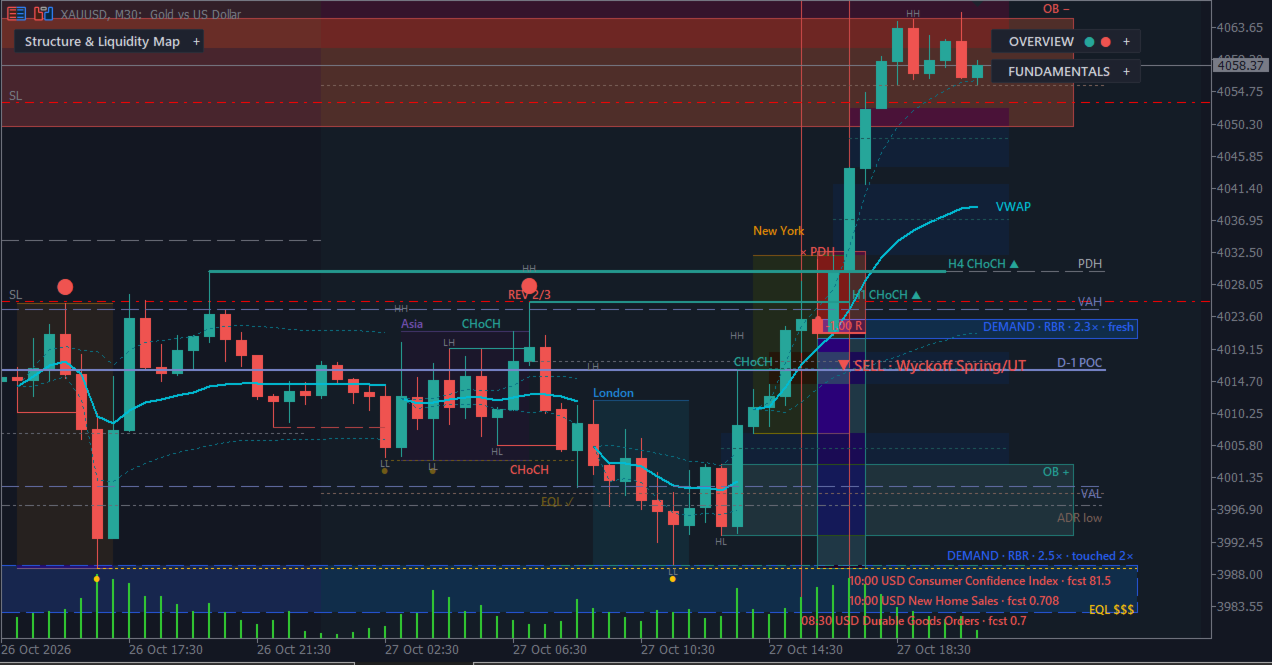
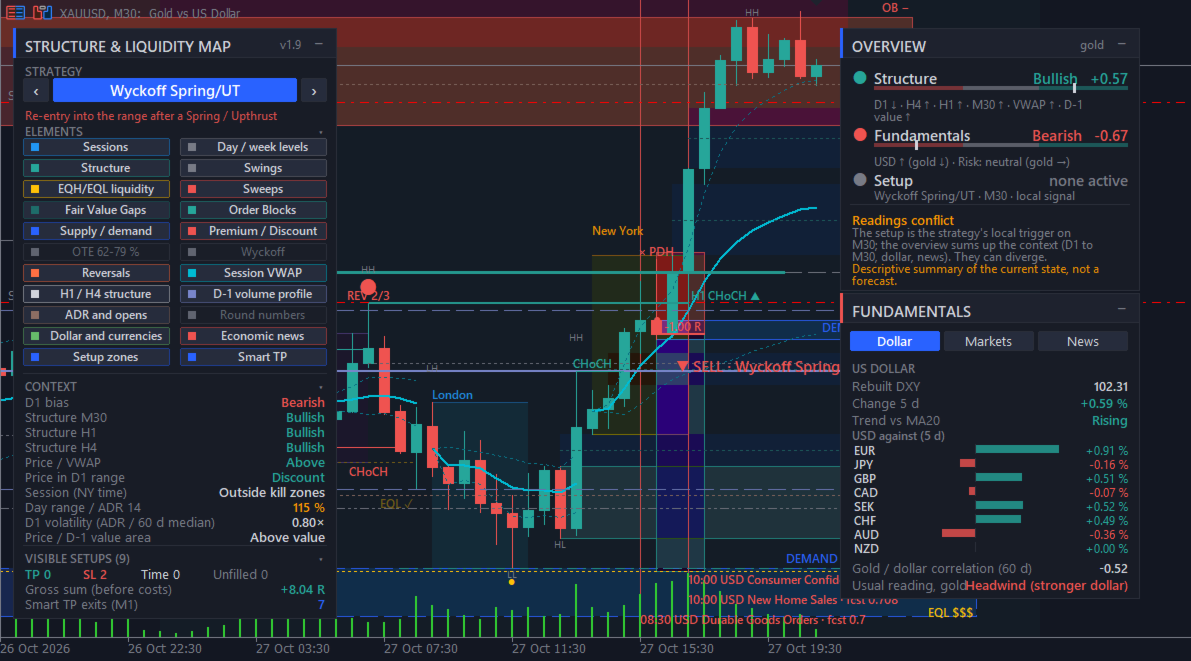
MacroStructure puts market structure, liquidity, session levels and the macro context of MetaTrader 5 on one chart. It draws documented, rule-based elements (Break of Structure, Change of Character, Fair Value Gaps, Order Blocks, liquidity sweeps, Wyckoff events), reference levels, and a fundamental panel with a rebuilt dollar index and the MT5 economic calendar. It is a visual analysis tool: it places, modifies and closes no orders.


WHY ONE INDICATOR

Discretionary traders who follow Smart Money Concepts, ICT-style sessions or Wyckoff often keep several tools open at the same time: one indicator for structure and zones, manual lines for sessions and previous highs and lows, a separate VWAP or volume profile, a dollar index chart, a currency strength table and an economic calendar website. MacroStructure gathers these readings in one chart and one panel, with the same colours, the same time reference (New York time) and the same rules everywhere.

Every element follows a written rule. Hover over any object to read its tooltip: type, price, time and, for setups, entry, stop, target and outcome. Nothing is hidden behind an unexplained score.


HOW TO START

1. Attach MacroStructure to a chart. It is designed for gold (XAUUSD) and the Nasdaq 100 index (NAS100) from M1 to H1, and it works on any symbol and timeframe.
2. Set the input "Server time minus New York time (h)". For a broker server at GMT+2 in winter and GMT+3 in summer, the value is usually 7. To check it, compare the 9:30 New York candle with the opening of the US stock index. If this value is wrong, sessions, kill zones, the midnight open and the session-based strategies are shifted.
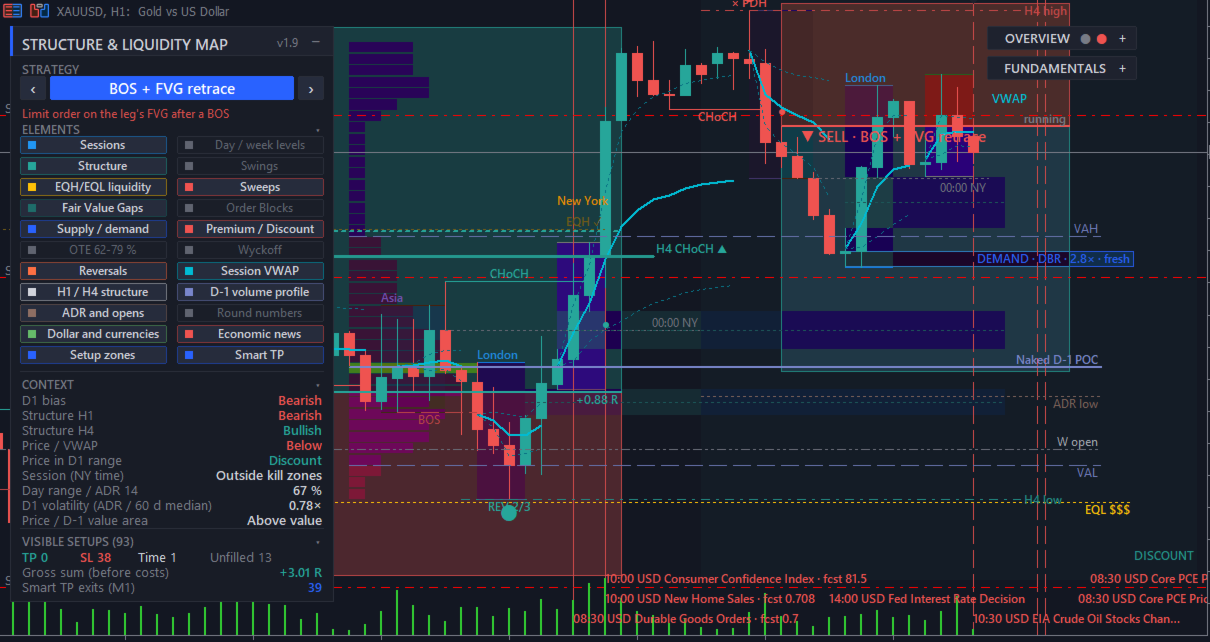
3. Use the left panel to choose a strategy view and to show or hide each of the 22 elements with one click. Your choice is saved per chart and restored when the chart is reopened.
4. Read the fundamental panel on the right (Dollar, Markets, News tabs) and the summary dial.


MARKET STRUCTURE AND LIQUIDITY

Market structure
- A Break of Structure (BOS) is marked when a candle closes beyond the last fractal swing in the direction of the trend.
- A Change of Character (CHoCH) is marked when a candle closes beyond the last fractal swing against the trend.
- Swing size is set by the number of fractal bars on each side (2 by default).

Swings
- Higher high (HH), higher low (HL), lower high (LH) and lower low (LL) labels on confirmed fractals.

Equal highs and equal lows
- Two highs or two lows within 0.10 Average True Range (ATR) are marked as resting liquidity.

Liquidity sweeps
- A sweep is marked when price trades beyond a swing or beyond the previous-day high or low, then closes back inside.

Reversals
- A Change of Character is scored out of 3: the CHoCH itself, a liquidity sweep before it, and an RSI divergence. The score is shown on the chart.

Wyckoff events
- Trading range detection.
- Spring (false break below the range) and Upthrust (false break above the range).
- Test or Last Point of Support on lesser volume.
- Jump Across the Creek (JAC) or Sign of Weakness (SOW) when price leaves the range.
- An optional volume filter can be applied. MT5 mostly provides broker tick volume.


ZONES

Fair Value Gaps (FVG)
- The gap between the wicks of candle 1 and candle 3 of a three-candle move.
- A dotted line marks the 50 percent level (consequent encroachment).
- A minimum size in ATR filters small gaps; filled gaps are hidden by default and can be shown.

Order Blocks (OB)
- The last opposite candles before a Break of Structure.

Supply and demand zones
- A tight base followed by a departure of at least 2 ATR: rally-base-rally, drop-base-rally, drop-base-drop and rally-base-drop.
- The tooltip counts how many times price returned into the zone.

Premium and discount
- The daily reference range is split in two: the upper half is premium, the lower half is discount.

Optimal Trade Entry (OTE)
- The 62 to 79 percent retracement band of the last leg.


LEVELS AND SESSIONS

Sessions (New York time, adjustable)
- Asian range 20:00 to 24:00.
- London kill zone 02:00 to 05:00.
- New York kill zone 07:00 to 10:00.
- Midnight open line.

Day and week levels
- Previous-day high and low (New York day).
- Previous-week high and low.

Session VWAP
- Volume-weighted average price reset at each session, with standard deviation bands.

Higher timeframes
- Structure trend of two higher timeframes (H1 and H4 by default), ignored when lower than the chart timeframe.

Previous-day volume profile
- Point of control (POC), value area high (VAH) and value area low (VAL).
- Untouched points of control from earlier days.

Average daily range and opens
- 14-day average daily range (ADR) projected from the day's low and from the day's high.
- Week open and month open.

Round numbers
- An automatic step of about half the average daily range. Off by default.


FUNDAMENTAL PANEL

Dollar tab
- Dollar index rebuilt from the broker's currency pairs with the ICE formula, or the broker's own DXY symbol if you enter it.
- Change over a chosen number of days and trend against its moving average.
- Change of the dollar against 8 currencies.
- Correlation of daily returns between gold and the dollar. This correlation is measured on the same days; it describes the past relationship and does not predict the next move.

Markets tab
- Equity index, VIX, silver, oil and the US 10-year yield, when your broker offers these symbols.
- Gold to silver ratio and a risk-on or risk-off reading.
- Usual readings are shown in plain words, for example: equities down and VIX up point to safe-haven demand; higher yields raise the opportunity cost of holding gold.

News tab and chart lines (MT5 economic calendar)
- A vertical line at the exact release time, with an optional band of plus or minus N minutes around it. Many proprietary trading firms restrict trading around high-impact releases; the band helps you see these windows. Check the rules of your own firm.
- Next releases with a countdown.
- Once published: actual versus forecast, and the size of the surprise scaled by a robust deviation of that release's past surprises.
- The chart symbol's past reaction to the same release.
- Currencies and minimum importance are selectable.
- Optional alert N minutes before a release.
- Release names follow the display language.

Summary dial
- A structural side: weighted reading of chart structure, higher timeframes, premium or discount, and recent sweeps.
- A fundamental side: weighted reading of the dollar, related markets and the latest releases.
- Each item is listed with its weight, so you can see why the dial points where it does.
- The dial describes the current context. It is not a forecast. A local setup on the chart timeframe can disagree with the wider context; the dial shows both so that you decide.


STRATEGY VIEW

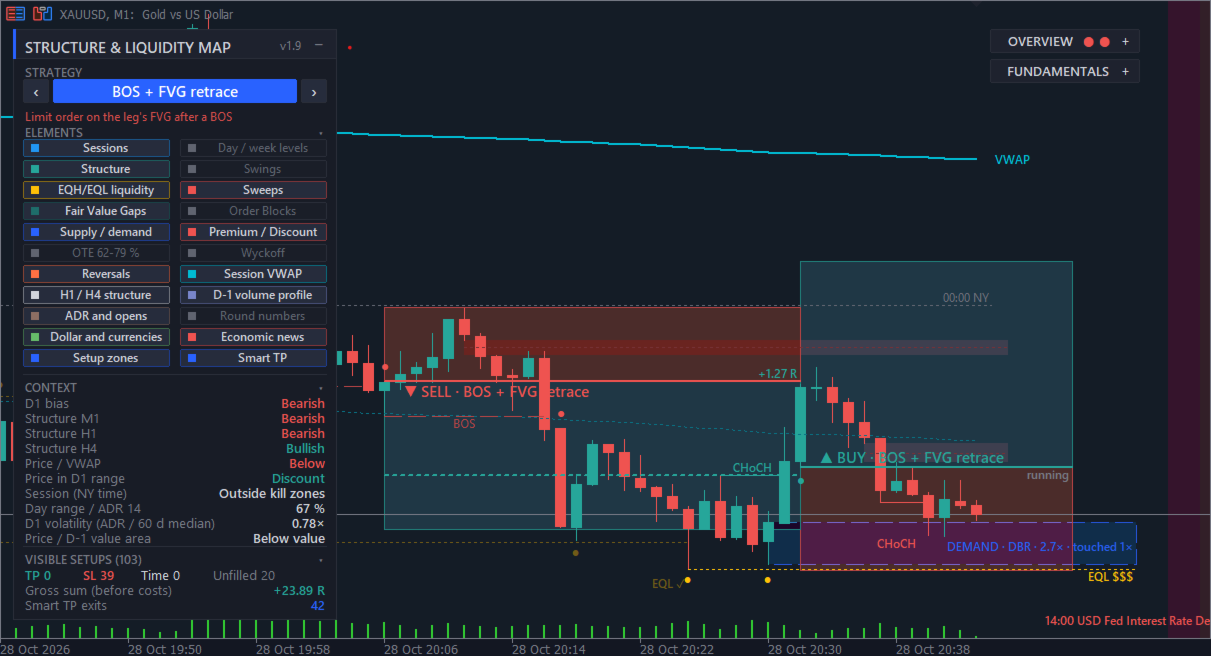
Choose one strategy, or all of them, in the panel. Each setup is drawn as a position box: entry, stop (red) and target (green). The tooltip shows the prices, the time and the outcome on the chart.

- 2022 Model: liquidity raid, market structure shift, then entry on the fair value gap, in the direction of the daily bias.
- Previous-day sweep: sweep of the previous-day high or low, then reversal.
- BOS and FVG: limit order on the fair value gap of the leg that broke structure.
- Wyckoff: re-entry into the range after a Spring or an Upthrust, with an optional low-volume filter.
- Judas swing: false break of the Asian range, then reversal.
- Reversal: Change of Character scored with sweep and RSI divergence.
- News surprise: see below.

The target in R and the time limits are adjustable.

The panel counts the visible setups (target reached, stop reached, time exits, unfilled orders, Smart TP exits) and their sum in R. These counts are gross: they do not include spread, commission or slippage, and they use the small sample visible on your chart. They describe what happened on the chart; they do not measure an edge and do not predict future results.


NEWS SURPRISE STRATEGY

For each past release of the selected currencies with a known actual and forecast value:

1. Surprise = (actual minus forecast) divided by a robust deviation of that release's past surprises (1.4826 times the median absolute deviation, with at least 5 past values).
2. The surprise is significant when its absolute value reaches the threshold you set (0.5 by default). Smaller surprises are ignored.
3. Direction: the usual effect of the release on its currency, taken from the MetaQuotes impact history or from keywords, then converted to the chart symbol. For gold, a positive US surprise that strengthens the dollar gives a sell zone.
4. Entry at the close of the release minute (M1). Protective stop in chart ATR (1 by default), target in R, and a time exit N minutes after the release (30 by default).

The tooltip shows the release name, its New York time, the actual and forecast values and the surprise in deviations. This view works on gold and on currency pairs that contain a calendar currency. On an index such as NAS100, no zone is drawn and the panel says so.

Please note: most of the price reaction to a release often happens within the first minute, before this entry, and spreads usually widen around releases. Judge these zones after your own costs.


SMART TP (OPTIONAL DYNAMIC EXIT)

Tick "Smart TP" in the panel to replace the fixed exit of every strategy with a dynamic exit. Untick it to return to the fixed stop and target.

After the entry is filled, the indicator follows price minute by minute on M1 bars:
1. Stop: if a bar trades through the current stop, the trade exits at the stop, or at the bar's open if price gapped through it.
2. Activation: once the trade has gained the chosen amount (1 R by default), the stop moves to break-even.
3. Trailing: the stop then follows each new M1 swing formed after the fill, only in the trade's favour.
4. Time exit: if nothing is hit, the trade closes at the strategy's usual time limit.

Three modes:
- Trail M1 swings, no fixed target: the target is ignored and the trade runs until the trailing stop is hit.
- Keep target, exit early on M1 reversal: the fixed target stays; the trailing stop only closes the trade earlier on a reversal.
- At target, keep running: trailing starts when the target is reached, with the stop locked one R below the target.

On the chart, a dashed line marks the Smart TP exit price and a dotted line shows the current trailing stop of a running trade.

Notes:
- Up to 120 days of M1 history are loaded. Older setups, or charts where M1 data is not available, use the chart's own bars, which is less precise. The panel shows when M1 data was used.
- Inside the fill bar, the order of price moves is unknown, so trailing starts on the next bar.
- A dynamic exit changes the shape of results (more small winners, a few larger ones, fewer full targets). It does not by itself create an edge.


CONTROL AND CUSTOMISATION

- 22 elements, each switched on or off with one button, saved per chart.
- Display languages: English (default), French, Spanish, Russian and Chinese for all text on the chart.
- Dark theme, light theme, or keep your current chart colours. The original chart colours are restored when the indicator is removed.
- All colours are adjustable.
- The panels can be moved and collapsed.
- Optional alerts on each new setup or reversal, and before economic releases.
- Lookback depth adjustable (1,500 bars by default).

Inputs are grouped by topic: General, Appearance, Elements shown at start, Sessions, Structure / FVG / OB, Supply and demand zones, Liquidity, Reversals, Session VWAP, Multi-timeframe structure, Volume profile / ADR / round numbers, Summary, Fundamentals (dollar and currencies, related markets, economic calendar), Wyckoff, Setups, News surprise strategy, Smart TP, Colors.


FOR DEVELOPERS: iCustom BUFFERS

- Buffers 0 and 1: setup entry prices (buy, sell).
- Buffers 2 and 3: reversals (buy, sell).
- Buffers 4 to 9: session VWAP and its bands (two alternating series per session).


IMPORTANT INFORMATION

- MacroStructure is a visual analysis tool. It places, modifies and closes no orders. It is not a signal service and not investment advice.
- Each rule is documented, but no rule shown here is presented as profitable. Past setup outcomes on a chart do not predict future results. Judge the tool on your own charts, in demo first, and after your own trading costs.
- Fractals and fair value gaps are confirmed one or two bars after they form, as with any swing-based tool. An element can therefore appear with a short delay.
- MT5 mostly provides broker tick volume, which can differ from exchange volume. Volume-based elements (VWAP, volume profile, Wyckoff volume filter) use this data.
- The MT5 economic calendar is not available in the Strategy Tester. In the tester, the fundamental panel shows "Calendar unavailable in the tester" and the calendar features are inactive. All other elements can be viewed in the tester's visual mode. Calendar features work on a live chart.
- Related-market readings appear only for the symbols your broker offers.
- Everything is recomputed on each new bar. On M1 with more than 5,000 bars of lookback, the display can slow down. Smart TP with M1 data adds some load on higher timeframes.
- The fundamental panel can cover the last candles at the top right: collapse it or move it with the panel margin input.


SUPPORT

Questions, bug reports and suggestions are welcome in the comments of this product page or by private message on MQL5. Please mention your broker, symbol and timeframe, and attach a screenshot of the panel when reporting an issue.
Produits recommandés
Important Lines
Terence Gronowski
4.88 (24)
This indicator displays Pivot-Lines, preday high and low, preday close and the minimum and maximum of the previous hour. You just have to put this single indicator to the chart to have all these important lines, no need to setup many single indicators. Why certain lines are important Preday high and low : These are watched by traders who trade in a daily chart. Very often, if price climbs over or falls under a preday low/high there is an acceleration in buying/selling. It is a breakout out of a
FREE
Pivot MT5
Dmitrij Isaenko
The indicator draws daily support and resistance lines on the chart, as well as the Pivot level (reversal level). Adapted to work in MT5 The standard timeframe for calculating support and resistance levels is D1. You can choose other timeframes according to your strategy (for example, for M1-M15, the optimal timeframe for calculations is H1) The function for calculating support and resistance levels has been updated; in this calculation option, fibonacci levels are taken into account, respec
FREE
Free automatic Fibonacci is an indicator that automatically plots a Fibonacci retracement based on the number of bars you select on the BarsToScan setting in the indicator. The Fibonacci is automatically updated in real time as new highest and lowest values appears amongst the selected bars. You can select which level values to be displayed in the indicator settings. You can also select the color of the levels thus enabling the trader to be able to attach the indicator several times with differe
FREE
Raymond Cloudy Day Indicator for MT5 – Pivot-Based Reversal and Trend Levels Raymond Cloudy Day Indicator is a pivot-based level indicator for MetaTrader 5 (MT5). It was developed by Ngo The Hung based on Raymond’s original idea and is designed to give a structured view of potential reversal zones, trend extensions and support/resistance levels directly on the chart. The default settings are optimised for XAUUSD on the H1 timeframe, but the indicator can be tested and adjusted for other symbols
FREE
Follow The Line MT5
Oliver Gideon Amofa Appiah
4.6 (35)
This indicator obeys the popular maxim that: "THE TREND IS YOUR FRIEND" It paints a GREEN line for BUY and also paints a RED line for SELL. (you can change the colors). It gives alarms and alerts of all kinds. IT DOES NOT REPAINT and can be used for all currency pairs and timeframes. Yes, as easy and simple as that. Even a newbie can use it to make great and reliable trades. NB: For best results, get my other premium indicators for more powerful and reliable signals. Get them here: https://www.m
FREE
JT360 DNA Mini PnL Pointer V1.04 Public Компактно. Наглядно. Всегда перед глазами. JT360 DNA Mini PnL Pointer — это лёгкий индикатор для MetaTrader 5, который отображает суммарную текущую прибыль или убыток по всем открытым позициям текущего символа графика. Компактная индикация непосредственно на графике объединяет PnL относительно первоначального риска в формате R, тонкую мини-полоску и настраиваемую цветовую матрицу. Фирменные цвета JT360 — бирюзовый и пурпурный — выделяют крайние значения и
FREE
PZ Penta O MT5
PZ TRADING SLU
3.8 (5)
The Penta-O is a 6-point retracement harmonacci pattern which usually precedes big market movements. Penta-O patterns can expand and repaint quite a bit. To make things easier this indicator implements a twist: it waits for a donchian breakout in the right direction before signaling the trade. The end result is an otherwise repainting indicator with a very reliable trading signal. The donchian breakout period is entered as an input. [ Installation Guide | Update Guide | Troubleshooting | FAQ | A
FREE
Donchian Breakout And Rsi
Mattia Impicciatore
4.5 (2)
Description générale Cet indicateur est une version améliorée du Canal Donchian classique, enrichie de fonctionnalités pratiques pour le trading réel. En plus des trois lignes standard (supérieure, inférieure et ligne médiane), le système détecte les cassures et les affiche visuellement avec des flèches sur le graphique, en montrant uniquement la ligne opposée à la direction actuelle de la tendance pour une lecture plus claire. L’indicateur comprend : Signaux visuels : flèches colorées lors des
FREE
RSI abcd
Francisco Gomes Da Silva
3.75 (4)
Détecteur de Motif ABCD RSI : Stratégie Technique 1. Fonctionnement de l'Indicateur Combine le RSI classique avec la détection automatique de motifs harmoniques ABCD . Composants Clés RSI standard (période ajustable) Marqueurs de sommets et creux (flèches) Motifs ABCD (lignes vertes/rouges) Filtres de surachat (70) et survente (30) 2. Configuration sur MT5 period = 14 ; // Période RSI size = 4 ; // Taille maximale du motif OverBought = 70 ; // Niveau de surachat OverSold = 30 ; // Niveau de surv
FREE
LT Donchian Channel
Thiago Duarte
4.86 (7)
Donchian Channel is an indicator created by Richard Donchian. It is formed by taking the highest high and the lowest low of the last specified period in candles. The area between high and low is the channel for the chosen period. Its configuration is simple. It is possible to have the average between the upper and lower lines, plus you have alerts when price hits one side. If you have any questions or find any bugs, please contact me. Enjoy!
FREE
Automatic Trendlines
Pasi Hakamaki
4.69 (51)
The indicator draws trendlines on chart. This indicator has six inputs. User can specify alternative labels for both lines. If multiple instances of the indicator are used, the labels must differ. User can set width and color of the lines and depth which specifies what significant peaks should be used. For example, Depth=10 sets trendlines using the current peaks and valleys that have at least 10 bars to the right and to the left and that have highs/lows less/greater than the peak's high/low. In
FREE
Daily Support and Resistance Levels est un indicateur professionnel qui calcule et affiche automatiquement les niveaux clés de prix pour le trading intraday selon la méthode classique des Points Pivots. Fonctionnalités clés : Calcul automatique du Point Pivot (PP) 3 niveaux de résistance (R1, R2, R3) 3 niveaux de support (S1, S2, S3) Affichage du plus haut/bas de la veille Panneau d’information en temps réel Indicateur de biais du marché (Haussier/Baissier) Distance aux niveaux les plus proches
FREE
VFI Quantum
Nikita Berdnikov
5 (1)
Introducing VFI (Volume Flow Indicator) – a trading indicator that analyzes the relationship between volume and price movement to identify key trading opportunities. The indicator displays the strength and direction of volume flow, providing clear signals about potential entry and exit points. Signals are formed based on zero line crossovers, crossovers between the VFI line and its exponential moving average (EMA), and when the indicator exits overbought and oversold zones. Attention! This stra
FREE
Dynamic Key Levels
Rodrigo Ivan Ahumada Pena
Key Levels S/R — Dynamic Support & Resistance Structure Key Levels S/R is a precise and reliable indicator that identifies true Support and Resistance levels based on confirmed swing structure. Instead of guessing or repainting, it waits for market validation before marking any level — giving traders clean, trustworthy zones to work with. This tool is ideal for breakout traders, pullback traders, and anyone who uses pending orders at structurally meaningful price levels. How the Logic Works The
FREE
CandlePro X
Murtadha Majid Jeyad Al-Khuzaie
CandlePro X — Free Professional Candle Visualizer for MetaTrader 5 CandlePro X is a free chart visualization indicator for MetaTrader 5, designed to make candlestick charts cleaner, sharper, and easier to read. If you find it difficult to quickly distinguish bullish and bearish candles, especially on busy charts, CandlePro X helps solve this problem by giving your candles stronger colors, clearer contrast, and a more professional appearance. CandlePro X does not generate trading signals, pred
FREE
Easy Correlations Indicator The Easy Correlations Indicator is designed to help traders analyze the relationship between two correlated instruments. By monitoring the distance between their Relative Strength Index (RSI) values, the indicator highlights situations where one instrument has moved significantly further than the other. This creates potential trading opportunities: Sell the stronger instrument (overstretched RSI) Buy the weaker instrument (lagging RSI) Because the positions are opened
FREE
Daily Pivot Point Levels
Maria Luisa Aparecida Vicentim
Daily Pivot Point Levels Identify daily support and resistance levels with clarity, precision, and simplicity. Daily Pivot Point Levels is a customizable indicator for MetaTrader 5 that automatically calculates and displays the central Pivot Point (P), support levels (S), and resistance levels (R) using previous-day price data. Designed for traders who value objective price references, clean chart organization, and flexibility, the indicator offers different calculation methods and extensive vi
FREE
PROMETHEUS TECHNICAN VERSION Free | By THE SONS A gift from The Sons — no strings, no trial, no expiry. Every trader deserves access to professional-grade market intelligence. That belief is why Prometheus Technical Version exists, and why it costs nothing. Consider it our handshake to the trading community. What You're Getting This is not a simplified tool dressed up as a gift. Prometheus Technican Version is a fully built, institutional-quality technical analysis indicator running a dual-model
FREE
MACD Enhanced
Nikita Berdnikov
4 (4)
Introducing the MACD  Enhanced – an advanced MACD (Moving Average Convergence Divergence) indicator that provides traders with extended capabilities for trend and momentum analysis in financial markets. The indicator uses the difference between the fast and slow exponential moving averages to determine momentum, direction, and strength of the trend, creating clear visual signals for potential entry and exit points. Attention! To achieve the best results, it is recommended to adapt the indicator
FREE
Aurum Pivot Point Breakout Free est un Expert Advisor de cassure gratuit pour MetaTrader 5. Il trade les cassures des niveaux classiques R1 et S1 des pivots journaliers du plancher (floor-pivot) avec des ordres stop, un stop basé sur l'ATR et une sortie par trailing. La taille de position est un pourcentage fixe du solde actuel, donc la taille du lot augmente et diminue avec le compte. Logique Calcule les pivots classiques du plancher à partir de la journée précédente (P, R1, S1). Place un buy s
FREE
KMB Smart Pattern Analyzer PRO
Karwan Msto Mohammed Mohammed
Présentation du produit KMB Smart Pattern Analyzer PRO est un indicateur avancé d'analyse technique conçu pour détecter et classer les configurations de marché présentant un fort niveau de correspondance dans une zone du graphique définie par l'utilisateur. L'indicateur combine plusieurs moteurs d'analyse dans un seul outil professionnel : Analyse des configurations de chandeliers Reconnaissance des figures chartistes classiques Détection des structures harmoniques Analyse de structure de marché
FREE
Girassol Sunflower MT5 Indicator
Saullo De Oliveira Pacheco
3.86 (7)
This is the famous Sunflower indicator for Metatrader5. This indicator marks possible tops and bottoms on price charts. The indicator identifies tops and bottoms in the asset's price history, keep in mind that the current sunflower of the last candle repaints, as it is not possible to identify a top until the market reverses and it is also not possible to identify a bottom without the market stop falling and start rising. If you are looking for a professional programmer for Metatrader5, please
FREE
Reversal Composite Candles
MetaQuotes Ltd.
3.69 (16)
The idea of the system is to indentify the reversal patterns using the calculation of the composite candle. The reversal patterns is similar to the "Hammer" and "Hanging Man" patterns in Japanese candlestick analysis. But it uses the composite candle instead the single candle and doesn't need the small body of the composite candle to confirm the reversal. Input parameters: Range - maximal number of bars, used in the calculation of the composite candle. Minimum - minimal size of the composite can
FREE
Indicator Description 4 Hull MA Color + Envelopes is a powerful trend-following indicator for MetaTrader 5 that combines four Hull Moving Averages (HMA) with Moving Average Envelopes to clearly identify market direction, trend strength, and potential reversal or pullback zones. This indicator is designed to reduce noise, react quickly to price movement, and provide a clean visual structure for professional trading.   Key Features   4 Hull Moving Averages (20, 50, 100, 200) Automatic color change
FREE
High Low Open Close
Alexandre Borela
4.98 (46)
Si vous aimez ce projet, laissez un examen 5 étoiles. Cet indicateur tire les prix ouverts, élevés, bas et de fermeture pour les prix spécifiés période et il peut être ajusté pour un fuseau horaire spécifique. Il s ' agit là d ' un niveau important qui s ' intéresse à de nombreux domaines institutionnels et professionnels. traders et peut être utile pour vous de connaître les endroits où ils pourraient être plus active. Les périodes disponibles sont les suivantes : Jour précédent. Semaine pré
FREE
Haven Key Levels PDH PDL
Maksim Tarutin
4.92 (12)
L'indicateur   "Haven Key Levels PDH PDL"   aide les traders à visualiser les niveaux clés sur le graphique. Il marque automatiquement les niveaux suivants : DO (Daily Open)   — Niveau d'ouverture du jour. NYM (New York Midnight)   — Niveau de minuit à New York. PDH (Previous Day High)   — Plus haut du jour précédent. PDL (Previous Day Low)   — Plus bas du jour précédent. WO (Weekly Open)   — Niveau d'ouverture de la semaine. MO (Monthly Open)   — Niveau d'ouverture du mois. PWH (Previous Week
FREE
Dynamic Pivot Zones
Vincent Jose Proenca
Dynamic Pivot Zones – Your Level Assistant on the Chart This indicator is a bit like a GPS for your trading . It shows you where the price likes to hang out, where it gets nervous, and where it flies through. No more calculating pivots by hand or guessing support and resistance levels. What it does: Automatically plots H1, H4, and D1 pivots . Shows support and resistance zones : R1, R2, S1, S2. Lines are colored and easy to read , so you can instantly see what’s hot or cold. Why you’ll love it:
FREE
FibRetrace Zones Zones de retracement de Fibonacci du dernier mouvement FibRetrace Zones est le compagnon visuel gratuit de l'Expert Advisor FibRetrace. Il trace les niveaux de retracement de Fibonacci et met en évidence la zone de repli du dernier mouvement, pour que vous voyiez où se situent les entrées avant de trader. La zone est colorée selon la direction : vert pour les configurations haussières, rouge pour les baissières. Fonctionne sur tout symbole et toute unité de temps. FONCTIONNALITÉ
FREE
Support and Resistance Levels with Breaks is a MetaTrader 5 indicator designed to detect important support and resistance levels based on pivot points and identify price breaks with volume confirmation. The indicator analyzes price movements around key market levels and highlights breakouts only when the volume condition is satisfied. This helps traders distinguish stronger price movements from low-volume level breaks. There are even better indicators—get them here. https://www.mql5.com/en/users
FREE
Are you tired of drawing trendlines every time you're analyzing charts? Or perhaps you would like more consistency in your technical analysis. Then this is for you. This indicator will draw trend lines automatically when dropped on a chart. How it works Works similar to standard deviation channel found on mt4 and mt5. It has 2 parameters: 1. Starting Bar 2. Number of bars for calculation The   starting bar   is the bar which drawing of the trend lines will begin, while the   number of bars for c
FREE
Les acheteurs de ce produit ont également acheté
Trend Sniper X
Sarvarbek Abduvoxobov
4.86 (43)
Trend Sniper X est un indicateur de suivi de tendance multi-unités de temps pour MetaTrader 5 qui aide les traders à identifier la direction de la tendance et les points d'inversion potentiels avec clarté et précision. pour MT4: https://www.mql5.com/en/market/product/193245 Informations sur le prix : Le prix actuel est un prix promotionnel et est susceptible de changer lors des prochaines mises à jour et nouvelles fonctionnalités. Offre bonus : Pour obtenir GRATUITEMENT l'Auto-Trade Assistant E
Un nouveau Roi en ville - Indicateur + Gestion des ordres (TP1 + TP2 + TP3) + Envoi optionnel de signaux Telegram INCLUS (GRATUIT) (SYSTÈME COMPLET DE TRADING et DE SIGNAUX) Notre meilleur EA pour l’Or : Gold Slayer Cet indicateur inclut une stratégie avancée, un système de trading avec gestion des ordres personnalisable ainsi qu’un système de retour à la moyenne combinant des extensions d’enveloppes, soutenu par plusieurs filtres intelligents de confirmation comme le RSI afin de détecter des en
Smart Trend Trading System — MetaTrader 5 Après votre achat, envoyez-moi un message sur MQL5 pour recevoir GRATUITEMENT Smart Universal Expert Advisor, ainsi que le cours en ligne, le manuel PDF et l’accès au groupe privé. STTS réunit la direction de la tendance, les signaux d’entrée et de sortie, les zones de retournement et les niveaux de prix importants directement sur votre graphique. Suivez le système manuellement ou connectez un EA compatible distinct pour une exécution automatique selon l
Zoryk Gold
Reda El Koutbane
4.76 (17)
ZORYK — Système avancé de signaux XAUUSD pour MetaTrader 5 Vous connaissez certainement cette sensation. Vous passez du temps à analyser l’or. Vous attendez le bon point d’entrée. Vous ouvrez enfin la position, puis le prix commence immédiatement à évoluer contre vous. Vous fermez trop tôt, déplacez le Stop Loss ou hésitez pendant quelques secondes. Ensuite, le marché atteint exactement l’objectif que vous aviez initialement prévu, mais sans vous dans la position. Le problème n’était pas toujour
Gardez votre avantage de trading dans votre ligne de mire ! M5 Sniper est un nouvel indicateur de MeanFX. Il combine des signaux de trading précis avec des niveaux de TP/SL adaptatifs — créant ainsi les meilleures opportunités de trading statistiques possibles ! Le prix augmente tous les 5 achats, le prochain prix est de 69$ Envoyez-moi un message après l’achat pour recevoir des conseils/un guide et un EA bonus Qu’est-ce qui le distingue ? Performance statistique éprouvée sur Gold XAUUSD ( fonct
SuperScalp Pro
Van Minh Nguyen
4.54 (37)
SuperScalp Pro - Professional Multi-Layer Confluence Scalping System SuperScalp Pro est un indicateur de scalping avancé qui améliore le Supertrend classique grâce à plusieurs filtres intelligents de confirmation. Il vous aide à identifier des opportunités de trading Buy/Sell présentant une probabilité de réussite plus élevée, tout en réduisant considérablement les faux signaux. Des flèches Buy et Sell bien visibles apparaissent directement sur le graphique, avec des niveaux de Stop Loss et de T
SMC Intraday Formula
VividMind Digital Solutions
5 (26)
Commençons par être honnêtes. Aucun indicateur ne vous rendra rentable à lui seul. Si quelqu’un vous dit le contraire, il vous vend un rêve. Tout indicateur qui affiche des flèches parfaites d’achat/vente peut être rendu impeccable — il suffit de zoomer sur la bonne partie de l’historique et de capturer uniquement les trades gagnants. Nous ne faisons pas cela.  SMC Intraday Formula est un outil. Il lit la structure du marché pour vous, identifie les zones de prix à la probabilité la plus élevée
La légende est de retour : Entry Points Pro 10. La relance de l'indicateur légendaire qui s'est maintenu 3 ans dans le Top-3 du MQL5 Market. Plus de 600 avis sur les deux versions, des milliers de traders l'utilisent chaque jour, plus de 28 000 téléchargements de la démo   MT4+MT5 . J'ai lu chacun de vos avis publiés en cinq ans — et au lieu de promettre, j'ai intégré les réponses directement dans la version 10. Par un auteur présent sur les marchés depuis 1999, qui tient à l'honnêteté, à sa rép
GoldenX Entry MT5
VividMind Digital Solutions
5 (17)
GoldenX Entry est un indicateur MT5 doté d’un algorithme adaptatif Smart Entry Trend, d’un système de scoring des signaux, d’un détecteur de régime de marché et d’un filtre de volatilité. Chaque signal inclut un niveau d’entrée calculé, trois niveaux de Take-Profit (TP1, TP2, TP3) ainsi qu’un niveau de Stop-Loss. Il est construit sur plusieurs couches analytiques conçues pour s’adapter à différentes conditions de marché, combinant un système analytique multicouche avec un optimiseur intégré et u
Auto Optimized SpeedAngle est un système de vectorisation du momentum de niveau institutionnel qui élimine l'ajustement de courbe ( curve-fitting ) grâce à une optimisation continue par avancement ( Walk-Forward Optimization , WFO). Plutôt que de s'appuyer sur des entrées statiques qui se dégradent lorsque les régimes de marché changent, l'indicateur recalibre dynamiquement ses paramètres en utilisant une validation hors échantillon ( Out-of-Sample , OOS), garantissant ainsi que les signaux affi
ARIPoint
Temirlan Kdyrkhan
1 (4)
ARIPoint is a powerful trading companion designed to generate high-probability entry signals with dynamic TP/SL/DP levels based on volatility. Built-in performance tracking shows win/loss stats, PP1/PP2 hits, and success rates all updated live. Key Features: Buy/Sell signals with adaptive volatility bands Real-time TP/SL/DP levels based on ATR Built-in MA Filter with optional ATR/StdDev volatility Performance stats panel (Success, Profit/Loss, PP1/PP2) Alerts via popup, sound, push, or email Cu
Gann Made Easy   est un système de trading Forex professionnel et facile à utiliser qui est basé sur les meilleurs principes de trading en utilisant la théorie de mr. WD Gann. L'indicateur fournit des signaux d'ACHAT et de VENTE précis, y compris les niveaux Stop Loss et Take Profit. Vous pouvez échanger même en déplacement en utilisant les notifications PUSH. VEUILLEZ ME CONTACTER APRÈS L'ACHAT POUR RECEVOIR GRATUITEMENT DES INSTRUCTIONS DE TRADING ET D'EXCELLENTS INDICATEURS SUPPLÉMENTAIRES! V
M1 Sniper MT5
Oleg Rodin
5 (7)
M1 SNIPER   est un système d'indicateurs de trading facile à utiliser. Il s'agit d'un indicateur à flèche conçu pour l'unité de temps M1. Cet indicateur peut être utilisé seul pour le scalping sur l'unité de temps M1 ou intégré à votre système de trading existant. Bien que conçu spécifiquement pour le trading sur l'unité de temps M1, ce système peut également être utilisé avec d'autres unités de temps. Initialement, j'avais conçu cette méthode pour le trading du XAUUSD et du BTCUSD. Cependant, j
Adaptive Price Action Engine Achetez un indicateur, obtenez l'EA gratuitement Analyse auto-optimisée des tendances et des figures de chandeliers Multi-Timeframe Les marchés évoluent constamment, et tous les modèles de Price Action n’ont pas la même valeur dans toutes les conditions de marché. Adaptive Price Action Engine a été conçu pour s’adapter aux changements du marché en combinant structure de tendance, analyse Multi-Timeframe, figures de chandeliers et optimisation statistique au sein d’un
Power Candles MT5
Daniel Stein
4.58 (12)
Power Candles V3 - Indicateur de force à optimisation automatique Power Candles V3 transforme la force des devises et des instruments en un plan de trading exploitable sur chaque graphique auquel il est associé. Au lieu de se contenter de colorer les bougies, il effectue une optimisation automatique en temps réel en arrière-plan et vous fournit les meilleurs niveaux de Stop Loss, Take Profit et seuils de signal pour le symbole que vous avez sous les yeux. Un simple clic suffit pour l'adopter en
Prochaine mise à jour — Version 2.52 bientôt disponible ! [NOUVEAU] Préparez-vous à découvrir 4 nouvelles fonctionnalités majeures conçues pour améliorer votre analyse du marché et votre flux de travail de trading Nous faisons passer l’analyse du marché au niveau supérieur avec 4 nouvelles fonctionnalités conçues pour répondre à vos besoins en trading. Découvrez : 1. TRADE OVERVIEW DASHBOARD 2. CONFLUENCE AT ZONE 3. STRONG & WEAK HIGH/LOW 4. OTE 1. TRADE OVERVIEW DASHBOARD Un tableau de bord qu
Boba Analysis Suite
Trade Ready Solutions LLC
5 (2)
Boba Analysis Suite Boba Analysis Suite est un indicateur d’analyse pour MetaTrader 5. Il réunit la structure du marché, les zones de prix pertinentes et le contexte général du marché dans une même vue graphique. Développé à partir de l’expérience pratique d’un trader et formateur en trading, il accompagne une démarche d’analyse structurée : évaluer la direction du marché, identifier les niveaux importants et analyser plusieurs unités de temps conjointement. Une analyse en contexte La significat
Gold Entry Sniper
Tahir Mehmood
5 (21)
Gold Entry Sniper – Tableau de Bord ATR Multi-Unités de Temps pour Scalping et Swing Trading sur l'Or Gold Entry Sniper est un indicateur avancé pour MetaTrader 5 qui fournit des signaux d'achat/vente précis sur XAUUSD et autres actifs, basé sur la logique de Trailing Stop ATR et l' analyse multi-unités de temps . Caractéristiques et Avantages Clés Analyse Multi-Unités de Temps – Affiche les tendances en M1, M5, M15 sur un seul tableau. Trailing Stop Basé sur l'ATR – Ajuste automatiquement selon
FiboSniper Pro
Van Minh Nguyen
5 (4)
FiboSniper Pro – Multi-Filter Fibonacci System with Auto SL/TP and Control Panel FiboSniper Pro est un indicateur technique qui combine des Fibonacci Envelopes dynamiques avec plusieurs filtres de confirmation afin de générer des signaux Buy et Sell sélectionnés. Les niveaux de Fibonacci sont calculés à partir de Moving Average et ATR, puis filtrés par ADX, EMA, RSI, ATR, Volume, Time et la structure des bougies. L’indicateur affiche directement sur le graphique les niveaux automatiques de Stop
Tokyo mt5 Indicator
Vasiliy Strukov
5 (12)
Le Tokyo Indicator offre une vue d'ensemble visuelle et claire de l'orientation de la tendance, des signaux de trading potentiels et des conditions du marché. Sa ligne de tendance en escalier, codée par couleur, distingue les phases haussières (en bleu) des phases baissières (en magenta). Des flèches directionnelles associées mettent en évidence les opportunités d'achat et de vente potentielles lors des changements de tendance. Un tableau de bord intégré regroupe le signal actuel, l'orientation
Trend Catcher ind mt5
Ramil Minniakhmetov
5 (18)
INDICATEUR DE DÉTECTEUR DE TENDANCE L'indicateur de détecteur de tendance analyse les mouvements de prix du marché grâce à une combinaison d'indicateurs d'analyse de tendance adaptatifs, propriétaires et personnalisés. Il identifie la véritable direction du marché en filtrant les fluctuations à court terme et en se concentrant sur la force de la dynamique sous-jacente, l'expansion de la volatilité et la structure des prix. Il utilise également une combinaison d'indicateurs personnalisés de lis
Gold Trend Coach MT5
Cristhian Alexander Gaibor Cuasquer
5 (2)
Gold Trend Coach est un indicateur de tendance pour l'or (XAUUSD) sur MetaTrader 5 avec des signaux d'achat et de vente, un stop loss et trois objectifs de take profit, confirmés à la clôture de la bougie, un tableau de bord coach multi-unités de temps et des alertes sur votre téléphone et sur Telegram. Conçu pour le scalping en M5 et l'intraday en M15 pendant les sessions de Londres et de New York. Gold Trend Coach : signaux de tendance sur l'or XAUUSD avec entrée, stop et trois objectifs. Prix
Quantum TrendPulse
Bogdan Ion Puscasu
5 (26)
Présentation de   Quantum TrendPulse   , l'outil de trading ultime qui combine la puissance de   SuperTrend   ,   RSI   et   Stochastic   dans un seul indicateur complet pour maximiser votre potentiel de trading. Conçu pour les traders qui recherchent précision et efficacité, cet indicateur vous aide à identifier les tendances du marché, les changements de dynamique et les points d'entrée et de sortie optimaux en toute confiance. Caractéristiques principales : Intégration SuperTrend :   suivez f
Neuro Poseidon MT5
Daria Rezueva
4.75 (52)
Neuro Poseidon is a new indicator by Daria Rezueva. It combines precise trading signals with adaptive TP/SL levels - creating best possible trades as a result! Message me and get  Neuro Poseidon Assistant  as a gift to automize your trading process! What makes it stand out? 1. Proven profitability on all assets and timeframes 2. Only confirmed BUY and SELL signals present on the chart 3. Adaptive TP & SL levels generated by the software for each trade 4. Easy to understand - suitable for al
Azimuth Pro
Ottaviano De Cicco
5 (7)
Azimuth Pro V2: Synthetic Fractal Structure and Confirmed Entries for MT5 Overview Azimuth Pro is a multi-level swing structure indicator by Merkava Labs . Four nested swing layers, swing-anchored VWAP, ABC pattern detection, three-timeframe structural filtering, and closed-bar confirmed entries — one chart, one workflow from micro-swings to macro-cycles. This is not a blind signal product. It is a structure-first workflow for traders who care about location, context, and timing. Halloween P
Présentation       Quantum Breakout PRO   , l'indicateur révolutionnaire MQL5 qui transforme la façon dont vous négociez les zones d'évasion ! Développé par une équipe de traders expérimentés avec une expérience commerciale de plus de 13 ans,       Évasion quantique PRO       est conçu pour propulser votre parcours commercial vers de nouveaux sommets grâce à sa stratégie de zone de discussion innovante et dynamique. Quantum Breakout Indicator vous donnera des flèches de signalisation sur les z
Indicateur de force et de momentum multi-devises MT5 Dynamic Forex28 Navigator est l'évolution de nos indicateurs populaires de longue date et réunit la puissance de trois outils en un : Advanced Currency Strength28 Indicator (700 avis) Advanced Currency IMPULSE with ALERT (530 avis) CS28 Combo Signals (bonus actuel) Les deux indicateurs précédents totalisent plus de 1 200 avis sur le MQL5 Market et font partie des outils incontournables de la communauté MT4 depuis 2016. Dynamic Forex28 Navigato
Scalper Vault est un système de trading puissant et complet, conçu pour les traders en quête de régularité dans le cadre du trading intrajournalier. Cet indicateur de haute précision constitue un système de trading autonome et exhaustif, offrant des analyses de qualité institutionnelle, aussi bien pour le Forex que pour les options binaires. VEUILLEZ ME CONTACTER APRÈS VOTRE ACHAT POUR OBTENIR MES CONSEILS DE TRADING AINSI QU'UN EXCELLENT BONUS ! En éliminant les incertitudes et les analyses man
Volatility Master for MetaTrader is a real-time dashboard tool that scans up to  50 symbols  to identify high-volatility , trending markets instantly. With bullish/bearish signals, customizable alerts, and a user-friendly interface, it helps you avoid range-bound conditions and focus on high-probability trades. Clarity leads to confidence. Trade confidently and protect your capital effectively with this powerful dashboard. We don't offer free or bonus indicators in exchange of reviews from you.
SR Liquidity   est un indicateur de trading conçu pour révéler les zones cachées où se concentre la liquidité du marché et où le prix réagit avec le plus d'intensité. Ces zones de liquidité spécifiques agissent comme de puissants niveaux de support et de résistance, vous offrant une cartographie claire des points où le marché est le plus susceptible de se retourner. Plutôt que de tracer des lignes de support et de résistance classiques, l'indicateur SR Liquidity analyse le comportement réel des
Plus de l'auteur
OhMyGold
Nathan Allane Philippe Keliby
OHMYGOLD Multi-Strategy XAUUSD Expert Advisor for MetaTrader 5 5 Trading Systems. 1 Gold Market. OHMYGOLD is a multi-strategy Expert Advisor designed specifically for XAUUSD / Gold trading on MetaTrader 5 . It combines five distinct rule-based breakout systems , each operating on a different trading horizon and market structure. Every system can be enabled or disabled independently and assigned its own position-sizing and risk settings. Run a single system, combine several systems, or operate al
Filtrer:
Aucun avis
Répondre à l'avis