Stochastic SuperTrend MT4 Scanner

Offre spéciale : ALL TOOLS, seulement 35 $ chacun !

Les nouveaux outils seront à 30 $ pendant la première semaine ou pour les 3 premiers achats

Trading Tools Channel on MQL5 : Rejoignez mon canal MQL5 pour recevoir mes dernières actualités

Cet outil combine Stochastic RSI avec la logique SuperTrend afin de générer des signaux directionnels basés sur les changements de momentum. Il superpose une enveloppe de type SuperTrend sur le Stochastic RSI et met en évidence les points de retournement lorsque le momentum franchit les seuils de surachat/survente.

Voir la version MT5 : Stochastic SuperTrend MT5 Scanner

Voir la version MT4 : Stochastic SuperTrend MT4 Scanner

Voir plus de produits : All Products

CONCEPTS

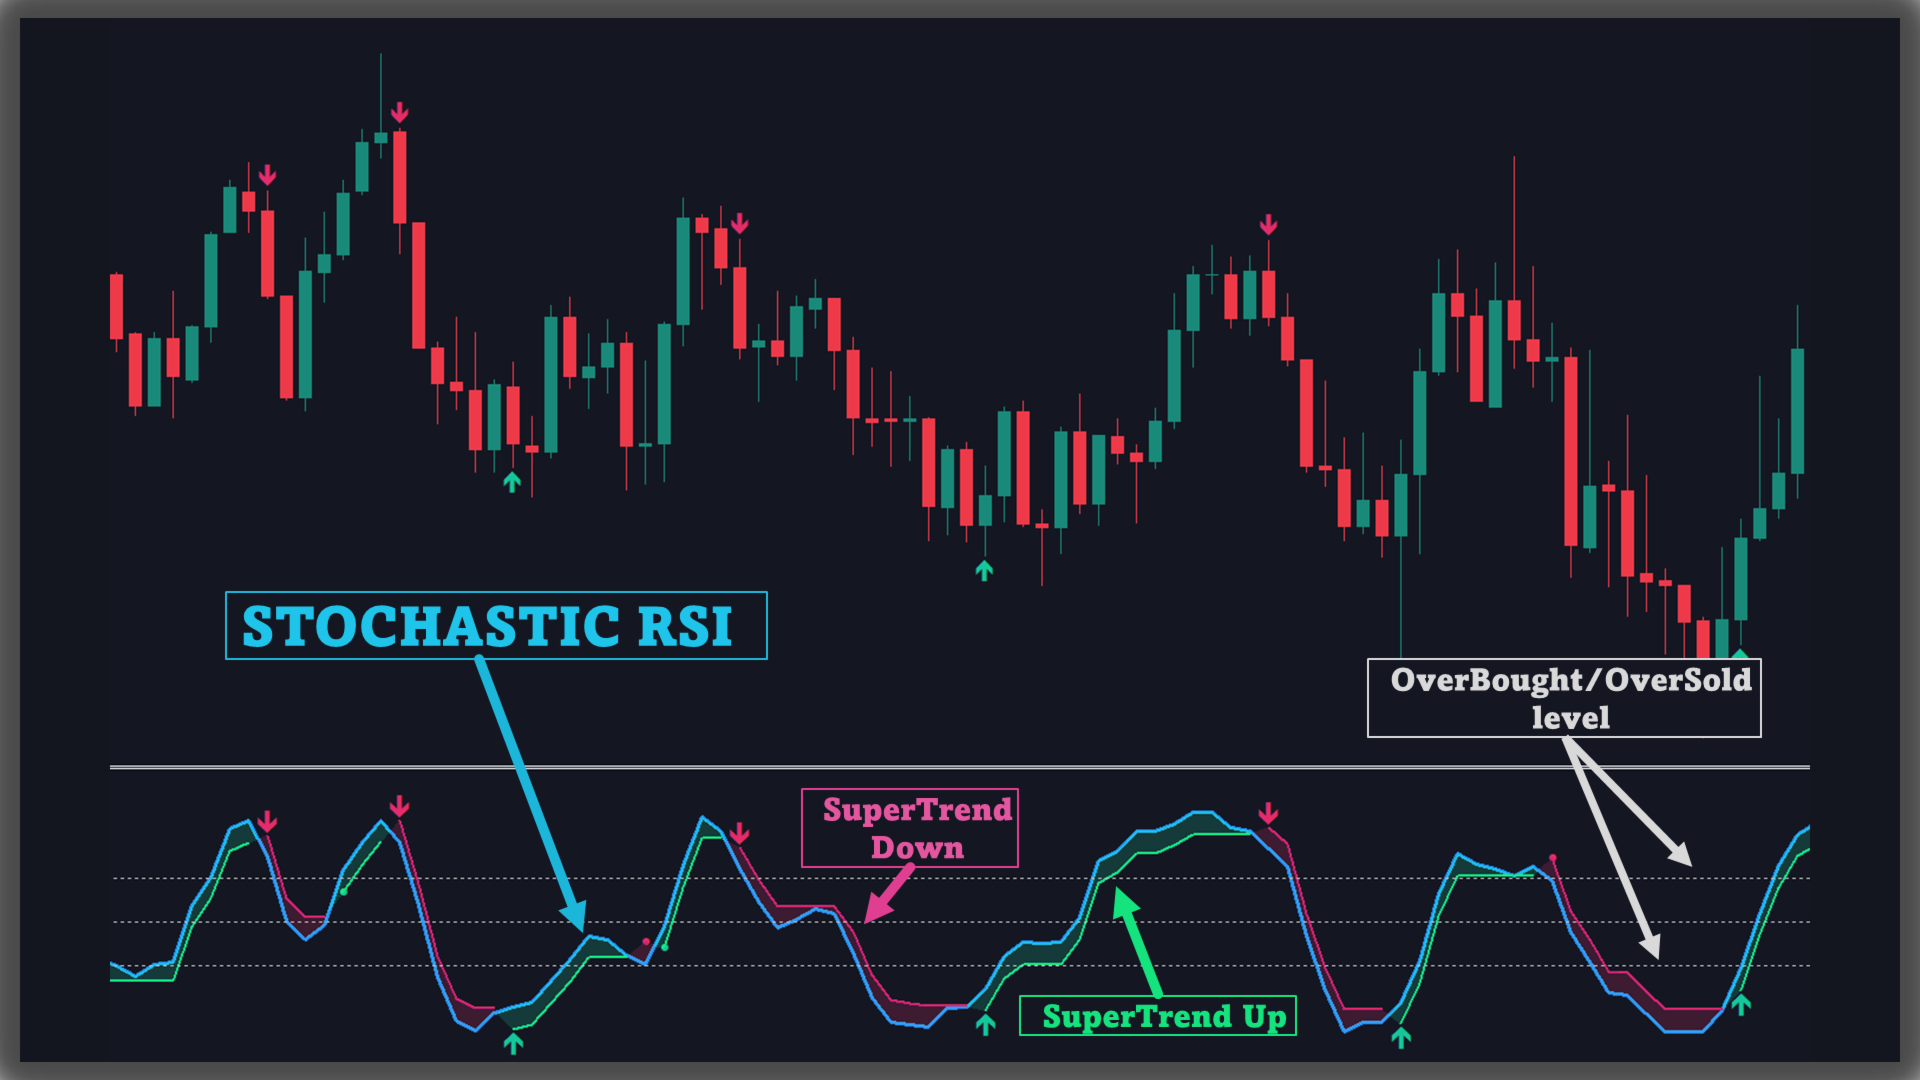
  • Stochastic RSI : Mesure le momentum en appliquant des calculs stochastiques à la ligne RSI plutôt qu’au prix.

  • Bandes SuperTrend : Bandes dynamiques hautes/basses tracées autour du Stochastic RSI lissé à l’aide d’un multiplicateur défini par l’utilisateur.

  • Direction du momentum : La tendance change lorsque le Stochastic RSI lissé franchit au-dessus/en dessous des bandes calculées.

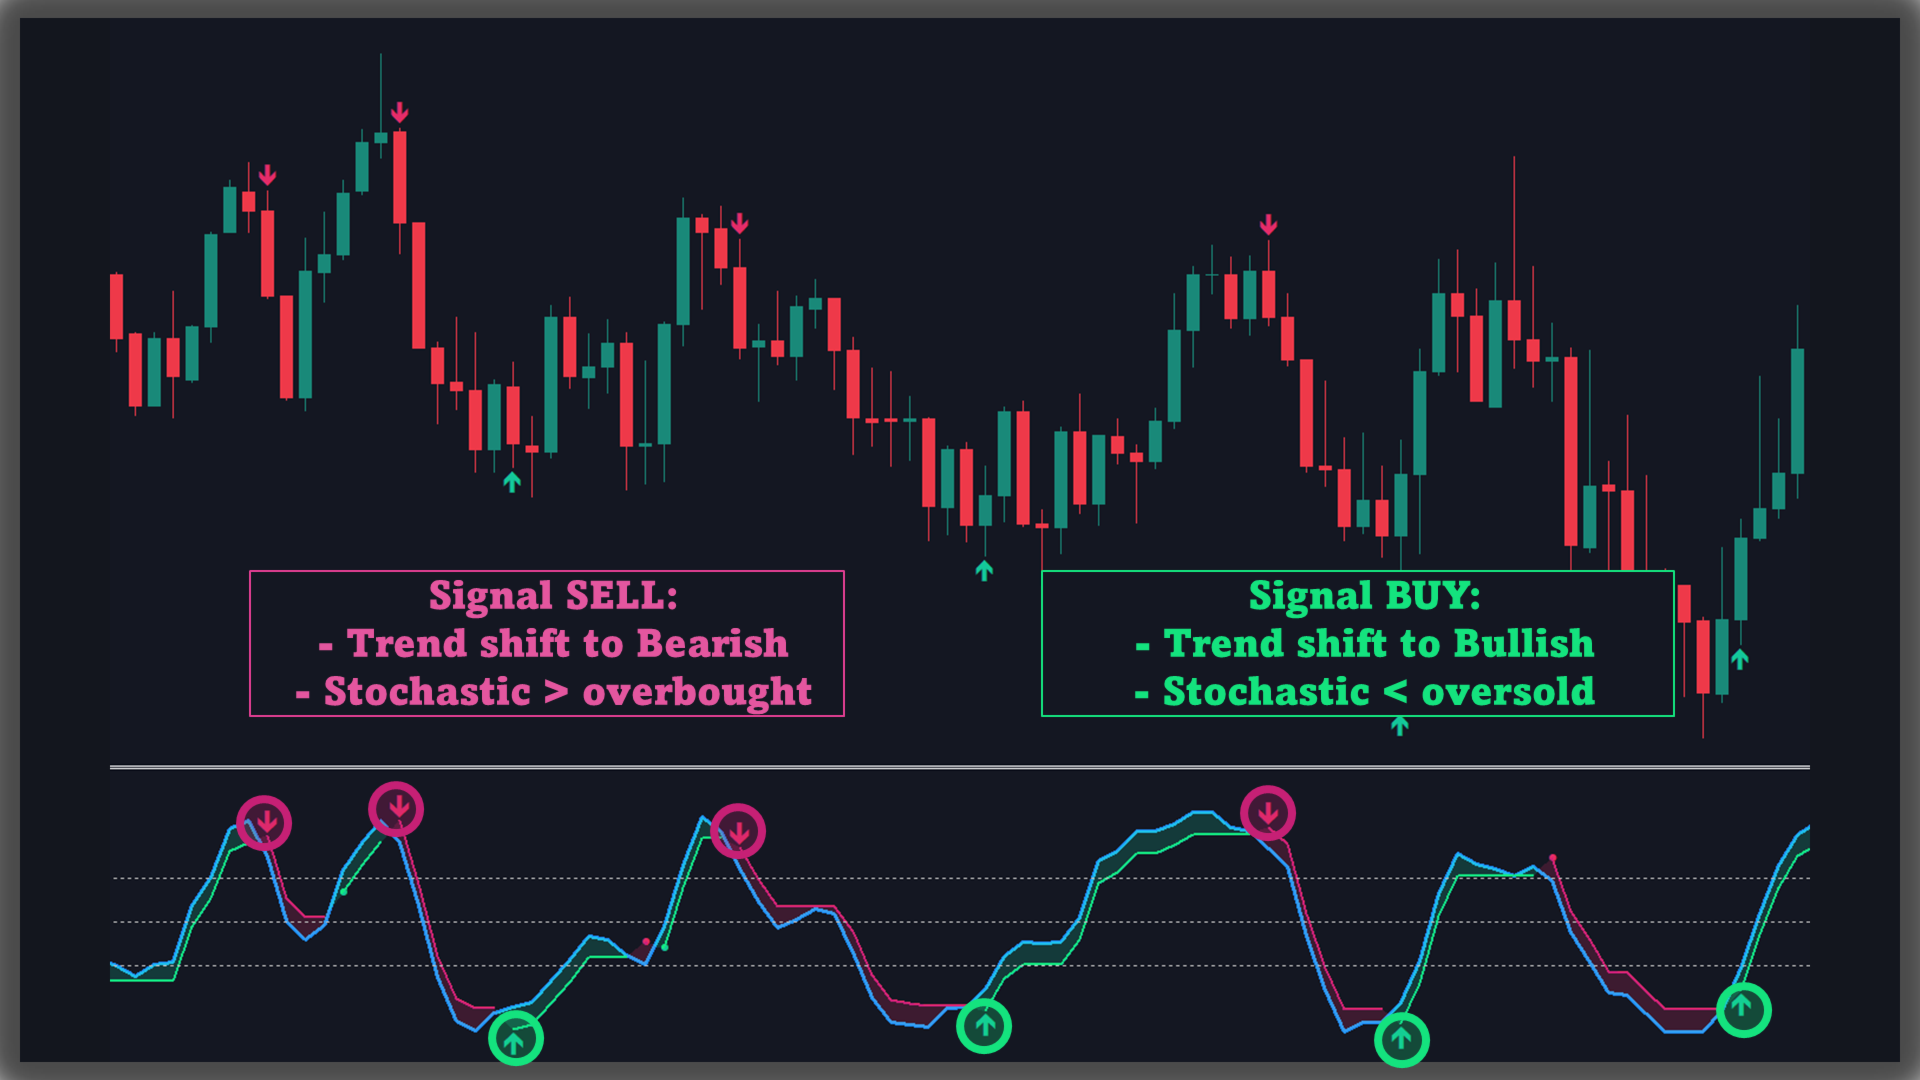
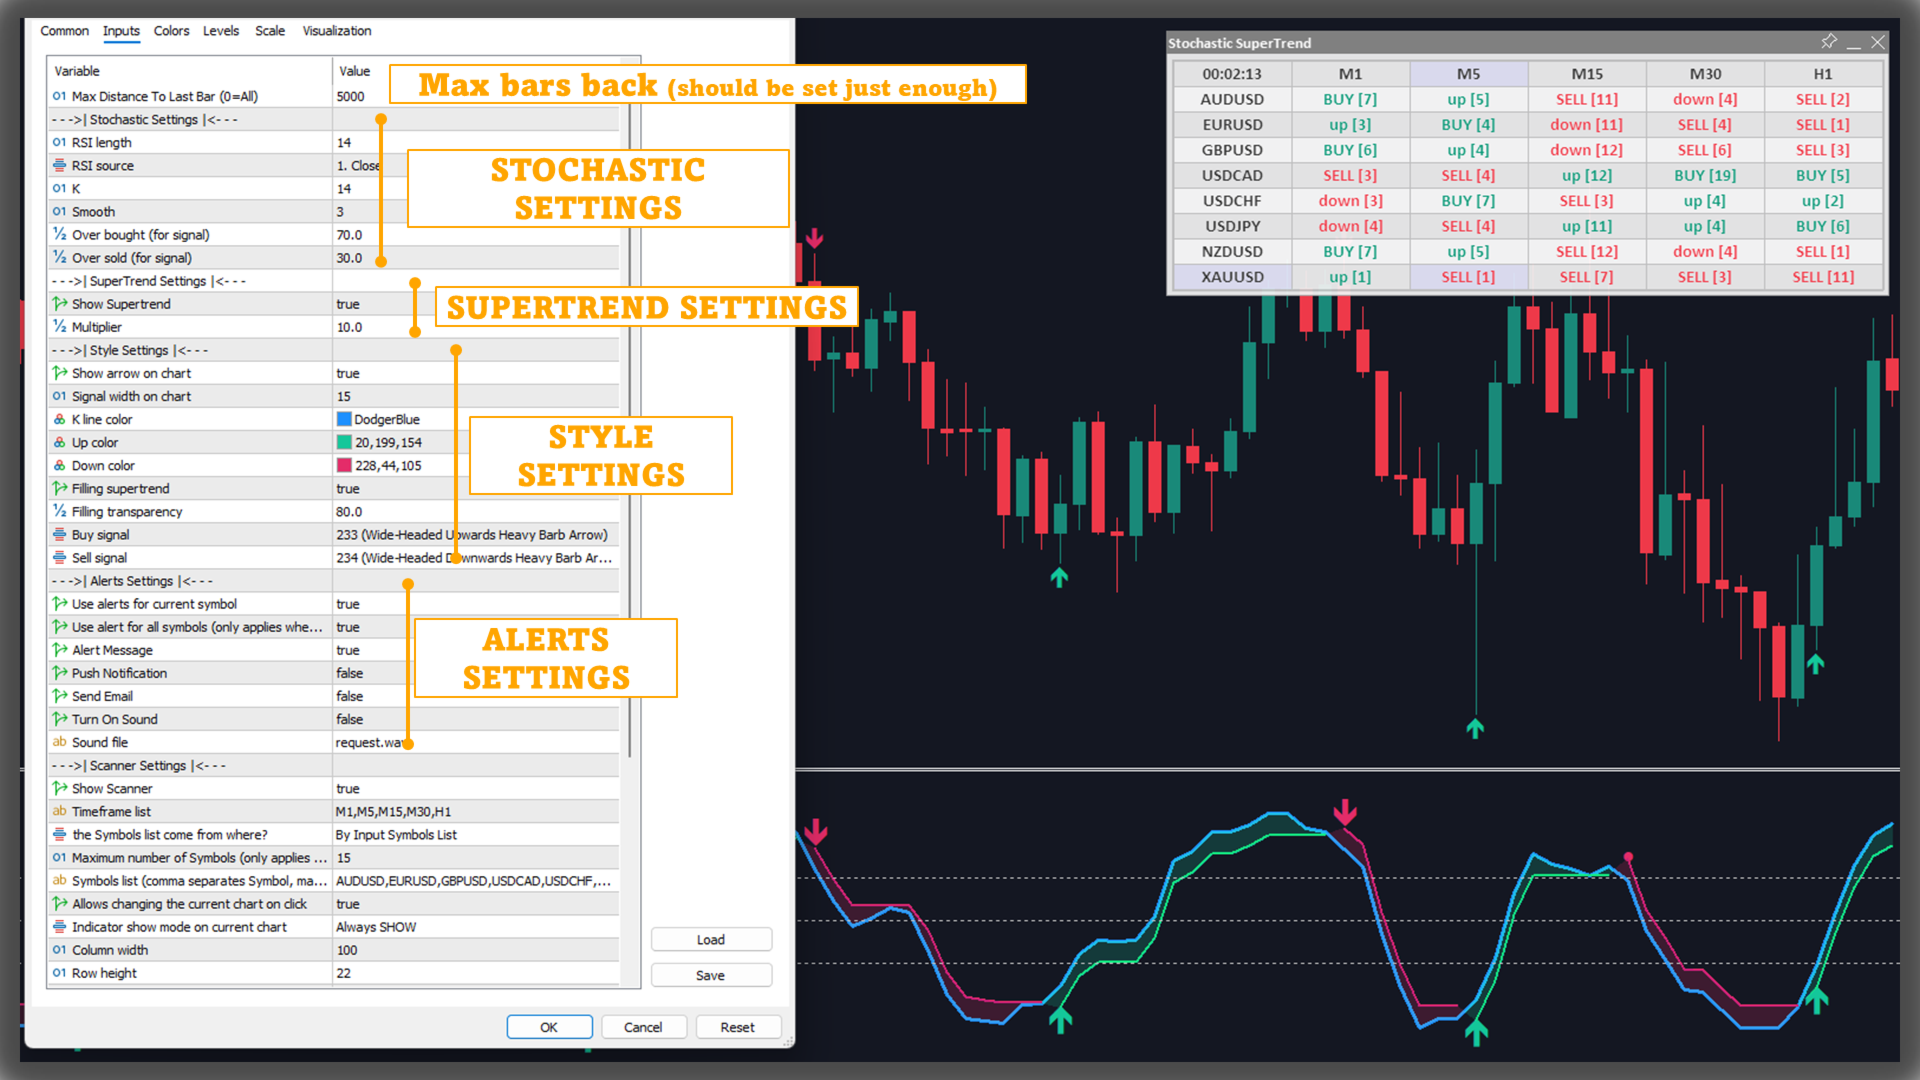
  • Filtre de signaux : Des flèches directionnelles apparaissent uniquement lorsque le momentum dépasse le niveau de surachat (par défaut 70) ou passe sous le niveau de survente (par défaut 30).

FONCTIONNALITÉS

  • Détection de tendance sur l’oscillateur : Applique la logique SuperTrend directement à la courbe du Stochastic RSI.

  • Signaux d’entrée :

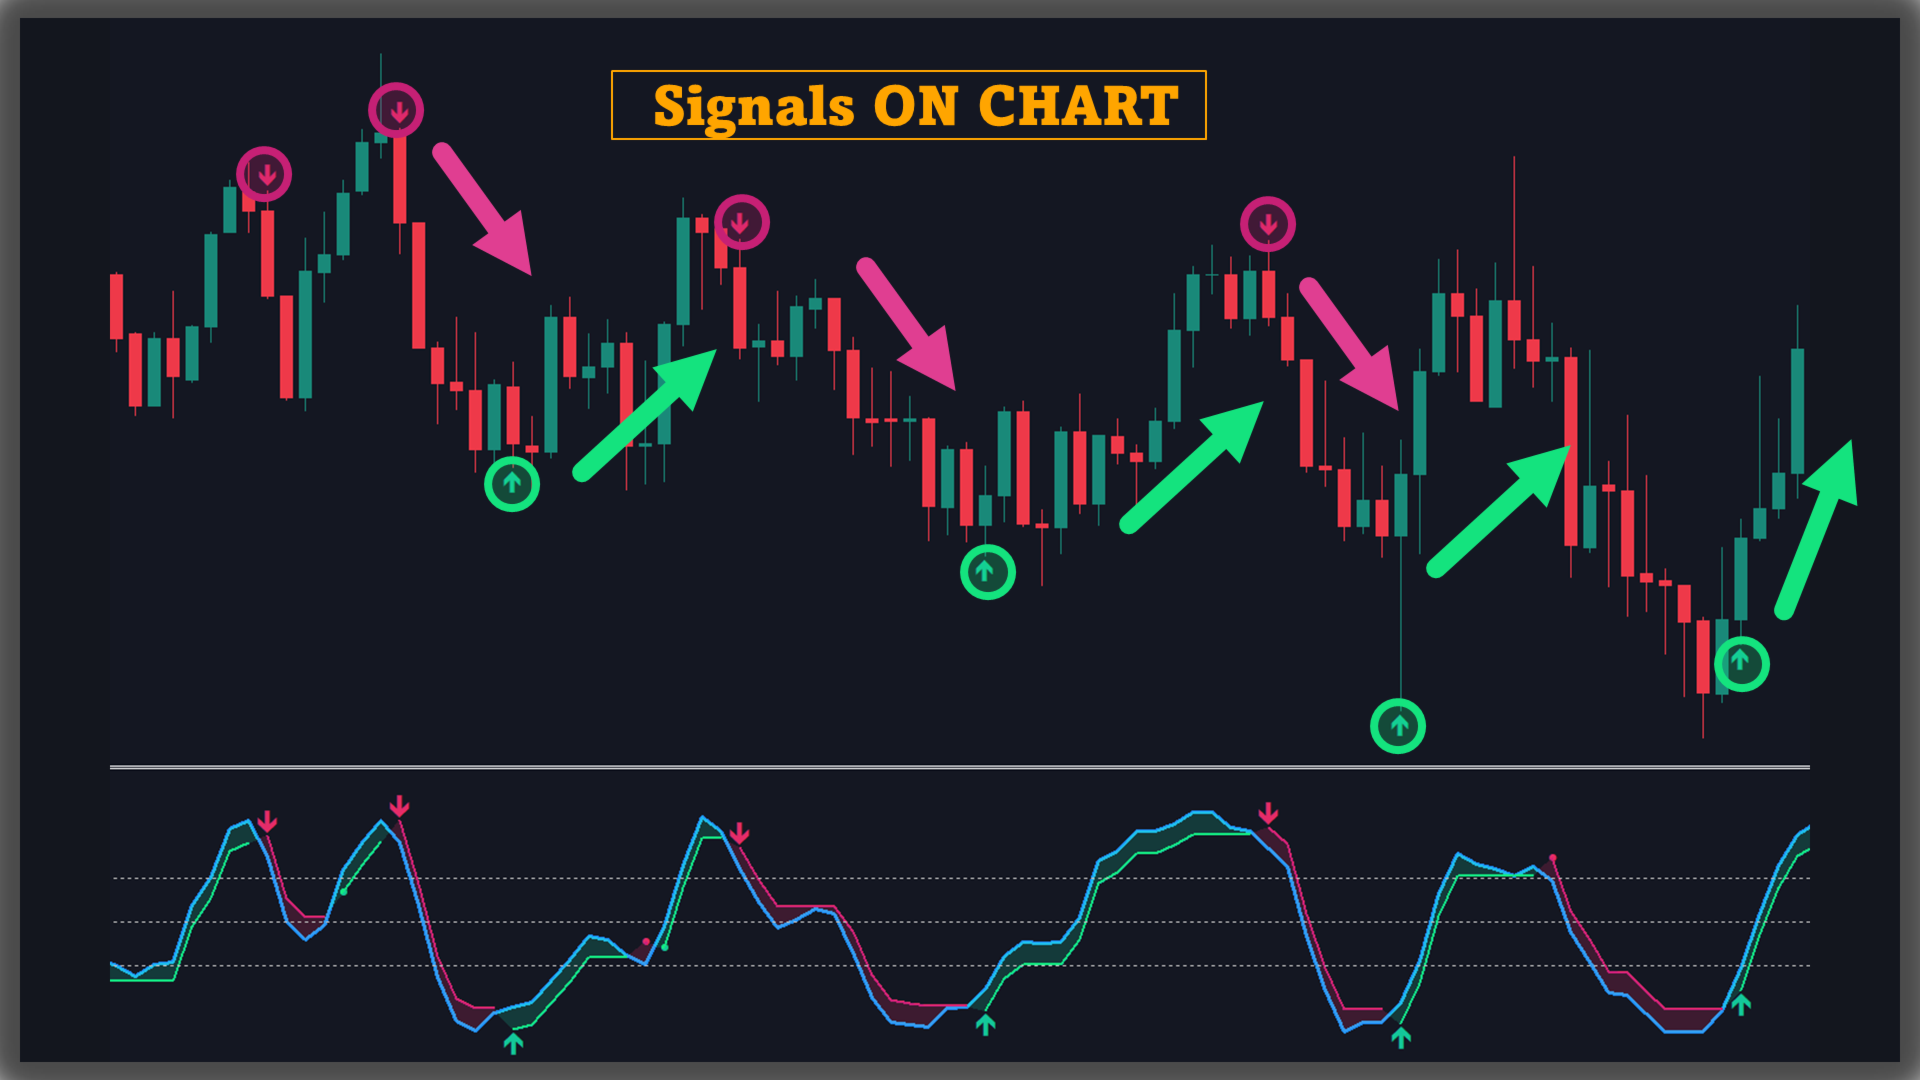
    • Affiche une flèche vers le haut lorsque la tendance devient haussière sous le niveau de survente (30), indiquant un possible retournement de creux.

    • Affiche une flèche vers le bas lorsque la tendance devient baissière au-dessus du niveau de surachat (70), indiquant un possible retournement de sommet.

  • Multiplicateur personnalisé : Ajuste l’espacement des bandes SuperTrend autour de l’oscillateur.

  • Afficher/Masquer la ligne SuperTrend : Option pour afficher ou masquer la trace SuperTrend sur le Stochastic RSI.

MODE D’UTILISATION

  • Utilisez les flèches vers le haut pour les retournements potentiels de creux lorsque le momentum devient haussier depuis les zones de survente.

  • Utilisez les flèches vers le bas pour les retournements potentiels de sommet lorsque le momentum devient baissier depuis les zones de surachat.

  • Peut être combiné avec un SuperTrend basé sur le prix ou des zones de support/résistance pour une confirmation supplémentaire.

  • Applicable au scalping, au swing trading ou au filtrage du momentum sur plusieurs unités de temps.
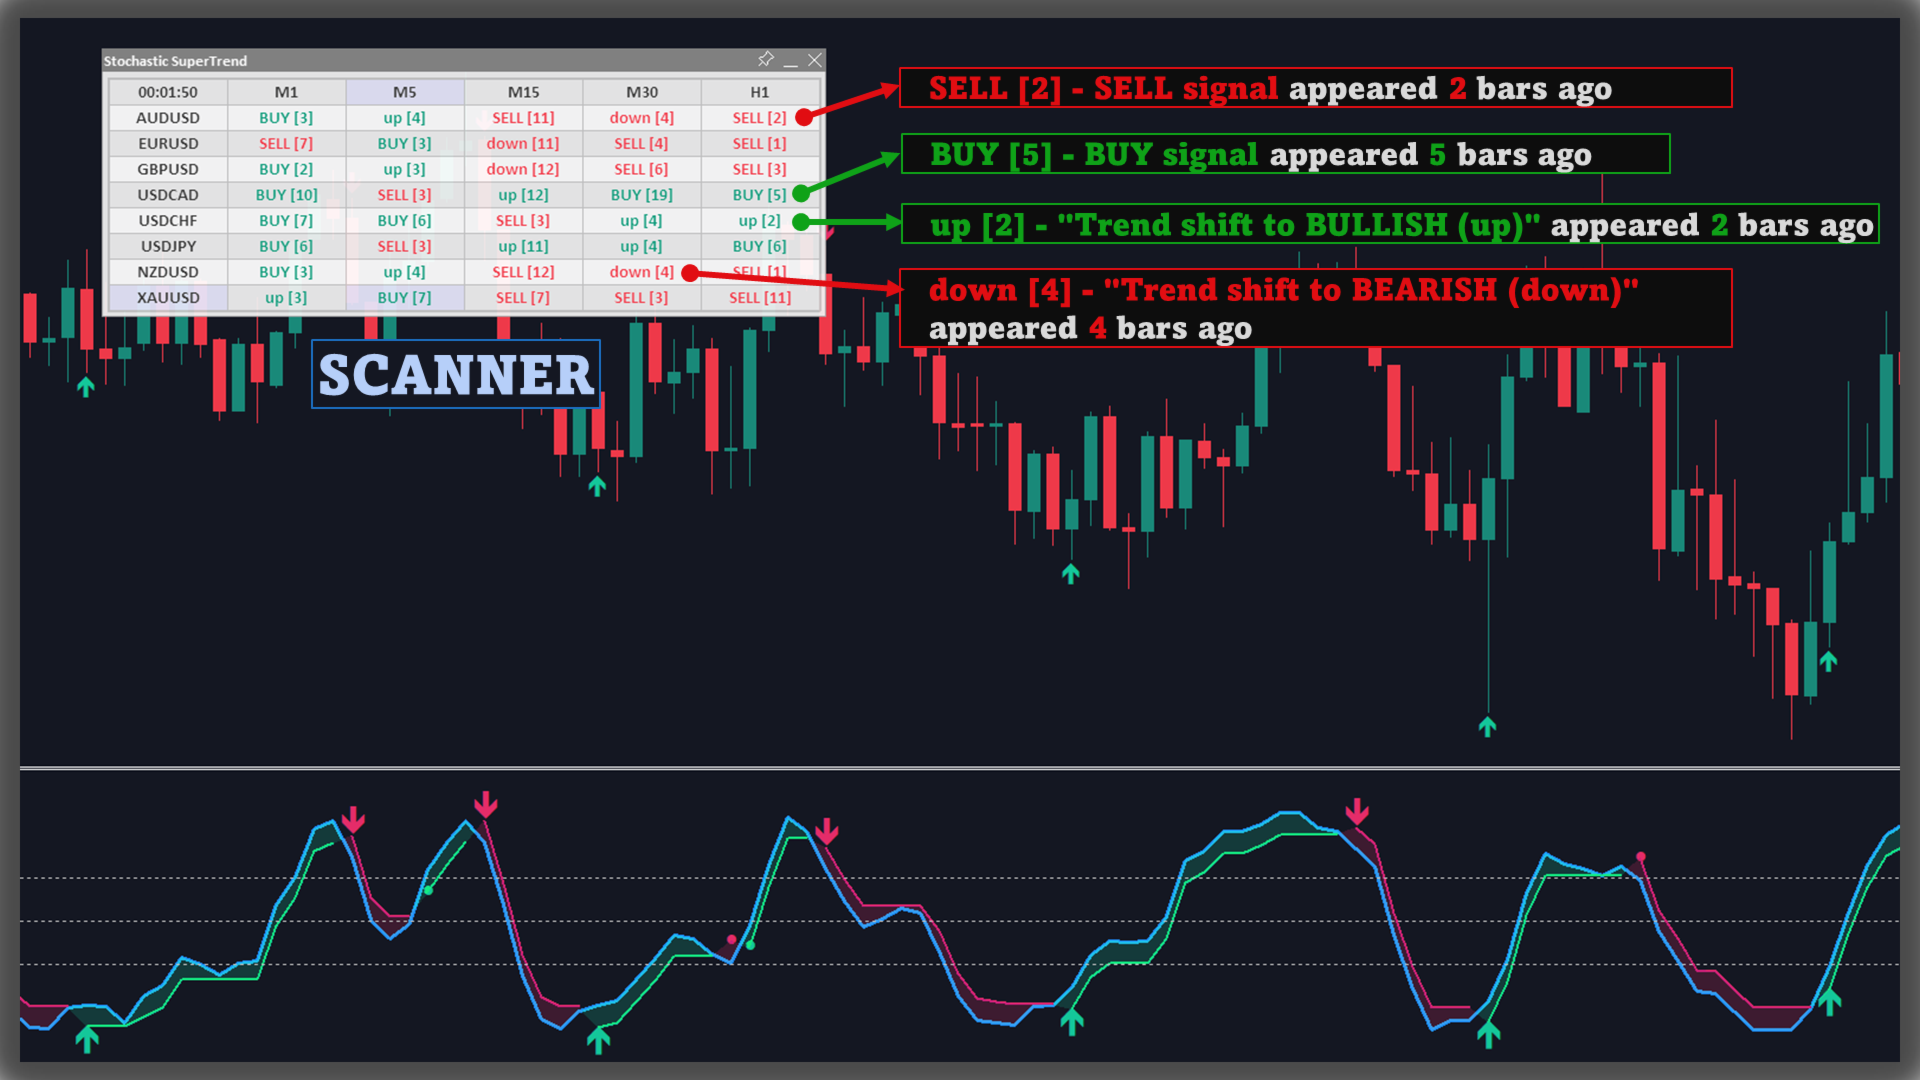
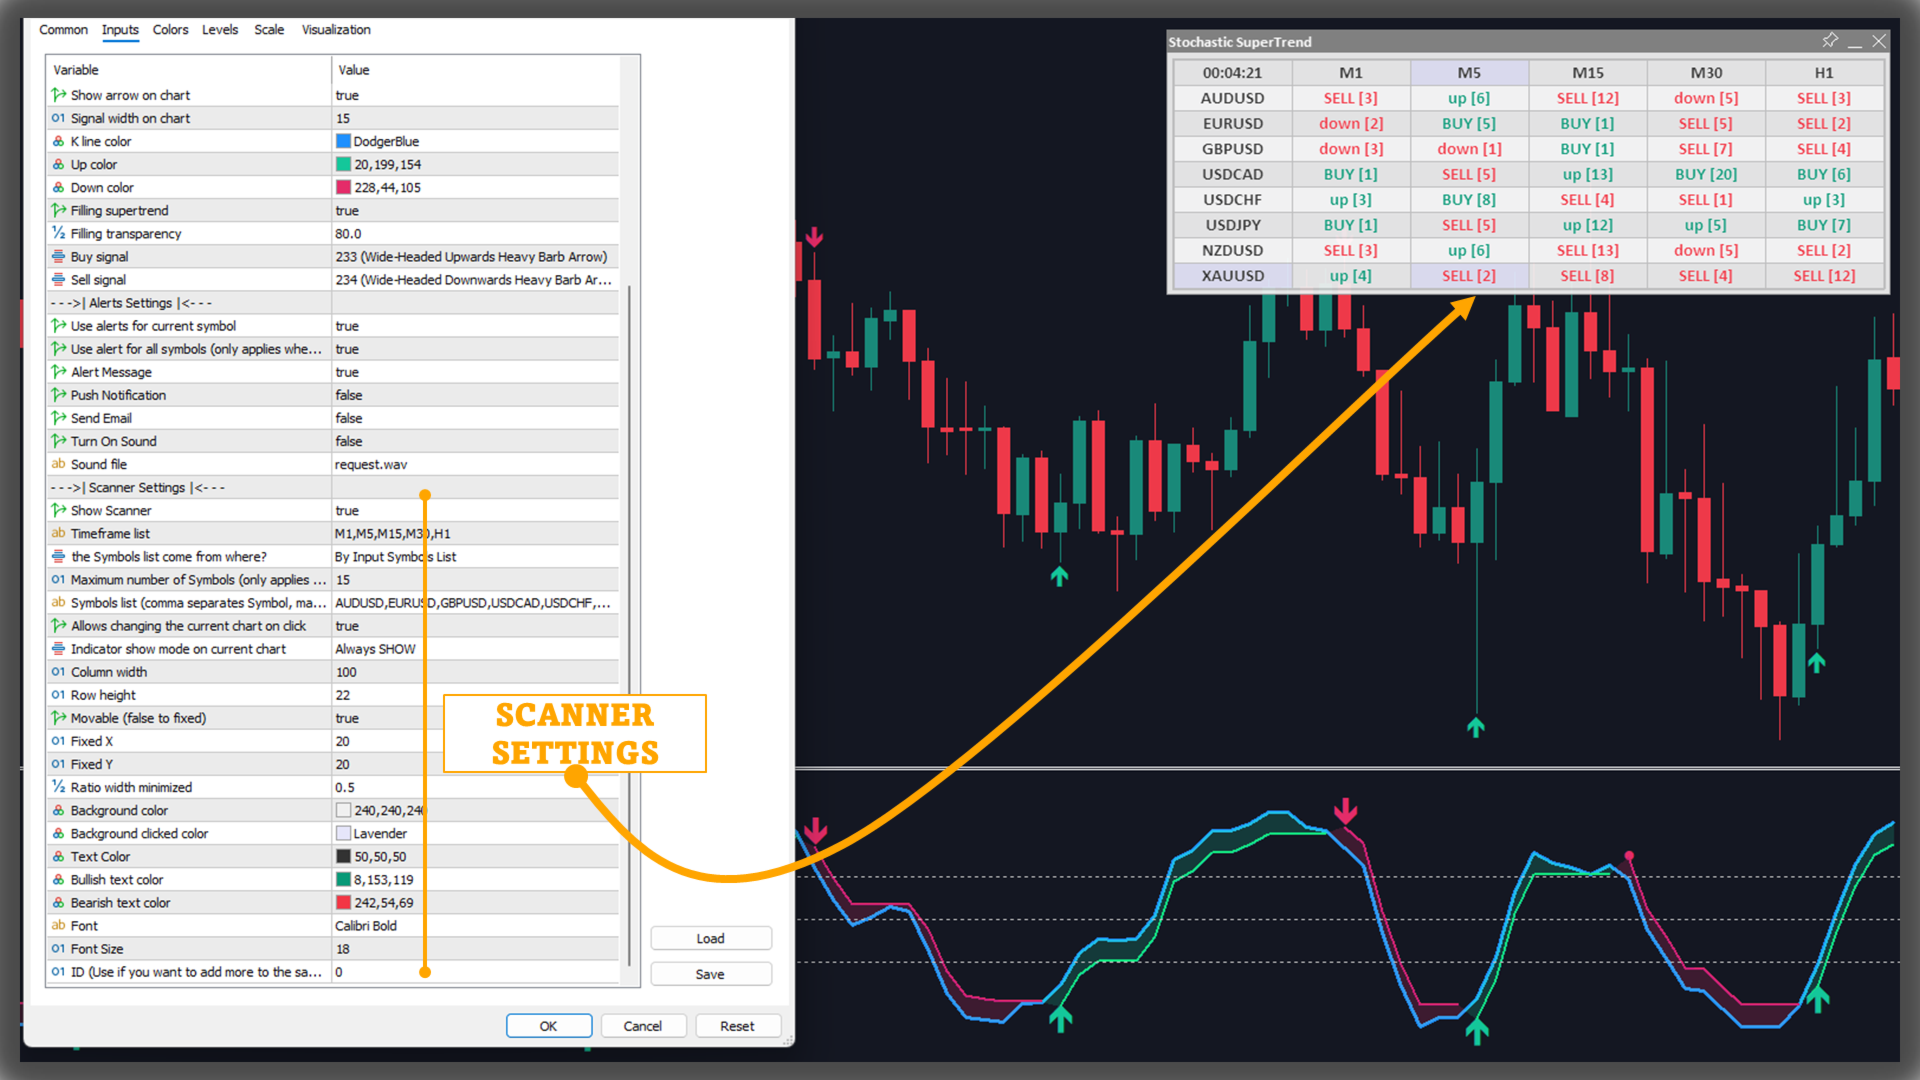
SCANNER ET ALERTES

Les utilisateurs peuvent activer/désactiver le scanner pour surveiller rapidement d’autres graphiques.
L’indicateur génère des alertes lorsque des signaux d’Achat/Vente apparaissent et lorsque des flèches de basculement de tendance vers Haussière/Baissière se forment ; grâce à ces alertes (notamment avec le Scanner), il est facile de saisir les informations du marché.

CONCLUSION

Stochastic SuperTrend met l’accent sur les changements de momentum et les variations directionnelles sur l’oscillateur. Il aide à repérer les retournements, à filtrer les entrées et à observer un éventuel essoufflement de tendance.


Produits recommandés
"Auto FIBO Pro" Crypto_Forex indicator - est un excellent outil auxiliaire dans le trading ! - L'indicateur calcule et place automatiquement sur le graphique les niveaux de Fibo et les lignes de tendance locales (couleur rouge). - Les niveaux de Fibonacci indiquent les zones clés où le prix peut s'inverser. - Les niveaux les plus importants sont 23,6 %, 38,2 %, 50 % et 61,8 %. - Vous pouvez l'utiliser pour le scalping inversé ou pour le trading en grille de zones. - Il existe également de nombr
Phase Analytics Pro: Advanced Cyclic Market Analyzer Phase Analytics Pro is a sophisticated technical tool designed for traders who prioritize mathematical precision over lag-heavy traditional indicators. Based on the principles of digital signal processing, this indicator decomposes price action into phase and quadrature components to identify the dominant market cycle. How it works: The algorithm calculates the instantaneous phase of the market, allowing it to distinguish between trending and
Super Reversal Pattern
Parfait Mujinga Ndalika
Super Reversal Pattern Indicator Unlock the power of advanced pattern recognition with our Super Reversal Pattern Indicator. Designed for traders seeking precision and reliability, this indicator identifies one of the most effective reversal patterns in technical analysis, offering a significant edge in your trading strategy. Key Features: Non-Repainting Accuracy: Enjoy the confidence of non-repainting technology. Once a Super Reversal Pattern is detected, it remains static, providing consiste
Trendiness Index
Libertas LLC
5 (3)
"The trend is your friend" is one of the best known sayings in investing, because capturing large trendy price movements can be extremely profitable. However, trading with the trend is often easier said than done, because many indicators are based on price reversals not trends. These aren't very effective at identifying trendy periods, or predicting whether trends will continue. We developed the Trendiness Index to help address this problem by indicating the strength and direction of price trend
VR Cub
Vladimir Pastushak
VR Cub est un indicateur permettant d'obtenir des points d'entrée de haute qualité. L'indicateur a été développé pour faciliter les calculs mathématiques et simplifier la recherche de points d'entrée dans un poste. La stratégie de trading pour laquelle l'indicateur a été rédigé prouve son efficacité depuis de nombreuses années. La simplicité de la stratégie de trading est son grand avantage, qui permet même aux traders débutants de négocier avec succès avec elle. VR Cub calcule les points d'ouve
Infinity Trend Pro
Yaroslav Varankin
1 (1)
This is a trend indicator without redrawing Developed instead of the binary options strategy (by the color of the Martingale candlestick) Also works well in forex trading When to open trades (binary options) A signal will appear in the place with a candle signaling the current candle It is recommended to open a deal for one candle of the current timeframe M1 and M5 When a blue dot appears, open a deal up When a red dot appears, open a trade down. How to open trades on Forex. When a signal is rec
Alpha Trend sign est notre outil de Trading très populaire depuis longtemps, il valide notre système de Trading et invite clairement les signaux de Trading sans dérive. Fonctions principales: • En fonction de la zone active du marché, selon les indicateurs, il est intuitif de déterminer si le cours actuel appartient à la tendance ou à la tendance. Et coupez le marché selon les flèches d'indication de l'indicateur, les flèches vertes suggèrent d'acheter et les flèches rouges suggèrent de vend
Noize Absorption Index MT4
Ekaterina Saltykova
5 (1)
Noize Absorption Index - is the manual trading system that measures the difference of pressure between bears forces and bulls forces. Green line - is a noize free index that showing curent situation. Zero value of index shows totally choppy/flat market.Values above zero level shows how powerfull bullish wave is and values below zero measures bearish forces.Up arrow appears on bearish market when it's ready to reverse, dn arrow appears on weak bullish market, as a result of reverse expectation. S
L'indicateur SMC Venom Model BPR est un outil professionnel pour les traders travaillant dans le concept Smart Money (SMC). Il identifie automatiquement deux modèles clés sur le graphique des prix: FVG   (Fair Value Gap) est une combinaison de trois bougies, dans laquelle il y a un écart entre la première et la troisième bougie. Forme une zone entre les niveaux où il n'y a pas de support de volume, ce qui conduit souvent à une correction des prix. BPR   (Balanced Price Range) est une combinaiso
Trade with Gann on your side!! MASTER CIRCLE 360 CIRCLE CHART, originally created by Gann admitted that this is “The Mother of all charts”. It is one of the last studies that this great trader left for us. The numeric tab le is apparently quite simple like all the tables and is based on square numbers, the SQUARE OF 12 and is by evolution, one of the most important square numbers. Here we can find CYCLE, PRICE AND TIME thanks to angles and grades, to show past and future support and resistance.
The Th3Eng PipFinite indicator is based on a very excellent analysis of the right trend direction with perfect custom algorithms. It show the true direction and the best point to start trading. With StopLoss point and Three Take Profit points. Also it show the right pivot of the price and small points to order to replace the dynamic support and resistance channel, Which surrounds the price. And Finally it draws a very helpful Box on the left side on the chart includes (take profits and Stop loss
Rainbow Price Visualizer v1.21 See where the market really breathes. Turns your MT4 chart into an ultra-precise heatmap that highlights price zones favored by big players. Why it matters 300 price levels at 0.2‑pip resolution — microscopic detail. 8 visual themes (Rainbow, Fire, Ocean…) for instant readibility. Smart opacity: low noise fades, real zones pop. Lightweight rendering with automatic cleanup. Fully customizable: saturation, opacity, resolution, history depth. Bands project into the f
RSI Speed mp
DMITRII GRIDASOV
Indicateur Crypto_Forex « RSI SPEED » pour MT4 : excellent outil prédictif, sans retouche. - Le calcul de cet indicateur est basé sur des équations physiques. Le RSI SPEED est la dérivée première du RSI lui-même. - Le RSI SPEED est idéal pour scalper les entrées dans la direction de la tendance principale. - Utilisez-le en combinaison avec un indicateur de tendance approprié, par exemple HTF MA (comme sur les images). - L'indicateur RSI SPEED indique la vitesse à laquelle le RSI change de dire
Point61 Indicator
Evgeniy Machok
5 (1)
The Point61 indicator is the result of many years of monitoring of price behavior of currency pairs and metals. It is not a secret, that in times of uncertainty, traders are looking for possible levels of support and resistance - the point, where price should stop its movement. There are 2 possible scenarios at these points: 1. Reverse (correction) to the opposite direction; 2. Breakthrough to continue movement. Very often these points are used to set stop orders - TakeProfit or StopLoss
Trend Ray
Andriy Sydoruk
The indicator shows the potential trend direction by cyclical-wave dependence. Thus, all the rays of the intersection will be optimal rays, in the direction of which the price is expected to move, taking into account the indicator period. Rays can be used as a direction for potential market movement. But we must not forget that the approach must be comprehensive, the indicator signals require additional information to enter the market.
Indicateur Crypto_Forex « Morning Star » pour MT4. - L'indicateur « Morning Star » est un indicateur très performant pour le trading Price Action : sans refonte, sans délai. - L'indicateur détecte les figures haussières Morning Star sur le graphique : signal de flèche bleue (voir images). - Alertes PC, mobile et e-mail. - Son homologue baissier « Evening Star » est également disponible (suivez le lien ci-dessous). - L'indicateur « Morning Star » est idéal pour combiner les niveaux de support e
[ZhiBiCCI] indicators are suitable for all cycle use, and are also suitable for all market varieties. [ZhiBiCCI] Green solid line is a reversal of bullish divergence. The green dotted line is a classic bullish divergence. [ZhiBiCCI] The solid line to the red is a reverse bearish divergence. The red dotted line is a classical bearish divergence. [ZhiBiCCI] can be set in the parameters (Alert, Send mail, Send notification), set to (true) to send instant signals to the alarm window, email, insta
Stepping Trend
Mpendulo Chiliza
The Stepping Trend Indicator     The Steppi ng Trend indicator uses the  average true range  (ATR indicator) in its calculation. This gives you control to set your own average true range period, I set the Default as 10.   Indicator Details. Green Arrow Up: This means you are at the starting point of a new bullish trend, it’s time to buy.   Red  Arrow  Down : This means you are at the starting point of a new  bearish  trend, it’ s time to sell .   What if you miss the Arrow Signal?   No prob
Cosmic Diviner X Planet
Olena Kondratenko
4 (2)
This unique multi-currency strategy simultaneously determines the strength of trends and market entry points, visualizing this using histograms on the chart. The indicator is optimally adapted for trading on the timeframes М5, М15, М30, Н1. For the convenience of users, the indicator renders the entry point (in the form of an arrow), recommended take profit levels (TP1, TP2 with text labels) and the recommended Stop Loss level. The take profit levels (TP1, TP2) are automatically calculated for
We present you the indicator "Candle closing counter", which will become your indispensable assistant in the world of trading. That’s why knowing when the candle will close can help: If you like to trade using candle patterns, you will know when the candle will be closed. This indicator will allow you to check if a known pattern has formed and if there is a possibility of trading. The indicator will help you to prepare for market opening and market closure. You can set a timer to create a pre
Daily Candle Predictor est un indicateur qui prédit le cours de clôture d'une bougie. L'indicateur est principalement destiné à être utilisé sur les graphiques D1. Cet indicateur convient à la fois au trading forex traditionnel et au trading d'options binaires. L'indicateur peut être utilisé comme un système de trading autonome, ou il peut servir de complément à votre système de trading existant. Cet indicateur analyse la bougie actuelle, calcule certains facteurs de force à l'intérieur du corps
"Impulses and Corrections 4" is created to help traders navigate the market situation. The indicator shows multi-time frame upward and downward "Impulses" of price movements. These impulses are the basis for determining the "Base" , which is composed of zones of corrections of price movements, as well as "Potential" zones for possible scenarios of price movement. Up and down impulses are determined based on a modified formula of Bill Williams' "Fractals" indicator. The last impulse is always "U
The indicator displays the data of the Stochastic oscillator from a higher timeframe on the chart. The main and signal lines are displayed in a separate window. The stepped response is not smoothed. The indicator is useful for practicing "manual" forex trading strategies, which use the data from several screens with different timeframes of a single symbol. The indicator uses the settings that are identical to the standard ones, and a drop-down list for selecting the timeframe. Indicator Paramet
Fibonacci retracement and extension line drawing tool Fibonacci retracement and extended line drawing tool for MT4 platform is suitable for traders who use  golden section trading Advantages: There is no extra line, no too long line, and it is easy to observe and find trading opportunities Trial version: https://www.mql5.com/zh/market/product/35884 Main functions: 1. Multiple groups of Fibonacci turns can be drawn directly, and the relationship between important turning points can be seen
Price Magnet — Price Density and Attraction Levels Indicator Price Magnet is a professional analytical tool designed to identify key support and resistance levels based on statistical Price Density. The indicator analyzes a specified historical period and detects price levels where the market spent the most time. These zones act as “magnets,” attracting price action or forming a structural base for potential reversals. Unlike traditional Volume Profile tools, Price Magnet focuses on price-time d
Distinctive
Tatiana Savkevych
Distinctive is a forex trending arrow indicator for identifying potential entry points. I like it, first of all, because it has a simple mechanism of work, adaptation to all time periods and trading tactics. Created on the basis of a regression channel with filters. Plotting the Lawrence indicator signals on a price function chart using a mathematical approach. How it works - when the price breaks out in the overbought / oversold zone (channel levels), a buy or sell signal is generated. Everyt
Trend Oscillator - est un indicateur Crypto_Forex personnalisé avancé, un outil de trading efficace ! - Une nouvelle méthode de calcul avancée est utilisée - 20 options pour le paramètre « Prix pour le calcul ». - L'oscillateur le plus fluide jamais développé. - Couleur verte pour les tendances à la hausse, couleur rouge pour les tendances à la baisse. - Valeurs de survente : inférieures à 5, Valeurs de surachat : supérieures à 95. - Il existe de nombreuses possibilités de mettre à niveau même
For sure, this indicator has become very popular amongst traders. Through coding this indicator will give you the most accurate levels possible for your trading analysis. We have also added in the ability for you to receive alerts when the price breaks above or below a Support or Resistance lines! HOW TO USE The red rectangles represent your resistance/supply zone. The green rectangles represent your support/demand zone.  BONUS FEATURES We coded this indicator with the ability to switch between
Mirror
Stanislav Korotky
This indicator predicts rate changes based on the chart display principle. It uses the idea that the price fluctuations consist of "action" and "reaction" phases, and the "reaction" is comparable and similar to the "action", so mirroring can be used to predict it. The indicator has three parameters: predict - the number of bars for prediction (24 by default); depth - the number of past bars that will be used as mirror points; for all depth mirroring points an MA is calculated and drawn on the ch
PZ Harmonacci Patterns
PZ TRADING SLU
3.17 (6)
Trade smarter, not harder: Empower your trading with Harmonacci Patterns This is arguably the most complete harmonic price formation auto-recognition indicator you can find for the MetaTrader Platform. It detects 19 different patterns, takes fibonacci projections as seriously as you do, displays the Potential Reversal Zone (PRZ) and finds suitable stop-loss and take-profit levels. [ Installation Guide | Update Guide | Troubleshooting | FAQ | All Products  ] It detects 19 different harmonic pric
Les acheteurs de ce produit ont également acheté
Neuro Poseidon MT4
Daria Rezueva
4.95 (37)
Neuro Poseidon is a new indicator by Daria Rezueva. It combines precise trading signals with adaptive TP/SL levels - creating best possible trades as a result! Message me and get  Neuro Poseidon Assistant  as a gift to automize your trading process! What makes it stand out? 1. Proven profitability on all assets and timeframes 2. Only confirmed BUY and SELL signals present on the chart 3. Adaptive TP & SL levels generated by the software for each trade 4. Easy to understand - suitable for all
Gann Made Easy
Oleg Rodin
4.84 (165)
Gann Made Easy est un système de trading Forex professionnel et facile à utiliser qui est basé sur les meilleurs principes de trading en utilisant la théorie de mr. WD Gann. L'indicateur fournit des signaux d'ACHAT et de VENTE précis, y compris les niveaux Stop Loss et Take Profit. Vous pouvez échanger même en déplacement en utilisant les notifications PUSH. VEUILLEZ ME CONTACTER APRÈS L'ACHAT POUR RECEVOIR GRATUITEMENT DES INSTRUCTIONS DE TRADING ET D'EXCELLENTS INDICATEURS SUPPLÉMENTAIRES! Vou
Trend Catcher ind
Ramil Minniakhmetov
5 (3)
INDICATEUR DE DÉTECTEUR DE TENDANCE L'indicateur de détecteur de tendance analyse les mouvements de prix du marché grâce à une combinaison d'indicateurs d'analyse de tendance adaptatifs, propriétaires et personnalisés. Il identifie la véritable direction du marché en filtrant les fluctuations à court terme et en se concentrant sur la force de la dynamique sous-jacente, l'expansion de la volatilité et la structure des prix. Il utilise également une combinaison d'indicateurs personnalisés de lis
M1 Sniper
Oleg Rodin
5 (24)
M1 SNIPER est un système d'indicateurs de trading facile à utiliser. Il s'agit d'un indicateur à flèche conçu pour l'unité de temps M1. Cet indicateur peut être utilisé seul pour le scalping sur l'unité de temps M1 ou intégré à votre système de trading existant. Bien que conçu spécifiquement pour le trading sur l'unité de temps M1, ce système peut également être utilisé avec d'autres unités de temps. Initialement, j'avais conçu cette méthode pour le trading du XAUUSD et du BTCUSD. Cependant, je
Dynamic Forex28 Navigator
Bernhard Schweigert
4.43 (7)
Dynamic Forex28 Navigator - L'outil de trading Forex de nouvelle génération. ACTUELLEMENT 49 % DE RÉDUCTION. Dynamic Forex28 Navigator est l'évolution de nos indicateurs populaires de longue date, combinant la puissance de trois en un : Advanced Currency Strength28 Indicator (695 avis) + Advanced Currency IMPULSE avec ALERT (520 avis) + CS28 Combo Signals (Bonus). Détails sur l'indicateur https://www.mql5.com/en/blogs/post/758844 Qu'offre l'indicateur de force de nouvelle génération ? Tout
MetaBands M4
Vahidreza Heidar Gholami
3.5 (6)
MetaBands uses powerful and unique algorithms to draw channels and detect trends so that it can provide traders with potential points for entering and exiting trades. It’s a channel indicator plus a powerful trend indicator. It includes different types of channels which can be merged to create new channels simply by using the input parameters. MetaBands uses all types of alerts to notify users about market events. Features Supports most of the channel algorithms Powerful trend detection algorith
Scalper Inside PRO
Alexey Minkov
4.68 (69)
Scalper Inside PRO Scalper Inside PRO is an intraday trend and scalping indicator that uses exclusive built-in algorithms to evaluate market direction and key target levels. The indicator automatically calculates entry and exit points and several profit target levels, and it shows detailed performance statistics, so you can see how different instruments and strategies behaved on historical data. This helps you select instruments that fit current market conditions. You can also connect your own a
Advanced Supply Demand
Bernhard Schweigert
4.91 (300)
Offre spéciale : 30 % de réduction La solution idéale pour les traders débutants comme experts ! Cet indicateur est un outil de trading unique, performant et abordable grâce à l’intégration de nombreuses fonctionnalités exclusives et d’une nouvelle formule. Cette mise à jour vous permet d’afficher des zones sur deux unités de temps. Vous pourrez ainsi visualiser non seulement une unité de temps supérieure, mais aussi l’unité de temps du graphique, ainsi que l’unité de temps supérieure : des z
Genesis Matrix Pro is a professional multi-timeframe trend detection indicator designed to help traders identify high-quality market alignment with clarity and structure. It combines 12 different technical indicators into one visual alignment matrix, allowing traders to quickly see when market conditions are bullish, bearish, or neutral. A signal is generated only when the selected strategies are aligned, helping reduce noise and improve decision-making. PLEASE CONTACT ME AFTER PURCHASE TO GET
L'indicateur de Carré Gann est un puissant outil d'analyse du marché basé sur l'article "Formule Mathématique pour les Prédictions de Marché" écrit par W.D. Gann. Cet outil utilise des concepts mathématiques et des théories de Gann pour réaliser une analyse précise du marché. Il utilise les carrés de 144, 90, 52 et aussi le carré de 9. De plus, il intègre la méthode du  pour le carré de 9 et sa relation avec les canaux et le modèle en étoile de ce carré. Manuel d'Utilisateur et Application : Ava
Breakout Arrows Mt4
Michael Oko Oboh
5 (1)
Trend Breakout Arrows Indicator The Trend Breakout Arrows Indicator is a momentum-based signal tool designed to identify potential bullish and bearish breakout opportunities. It displays clear arrow signals directly on the price chart, helping traders quickly recognize possible trend changes and continuation setups. Up Arrow (Buy Signal) A magenta up arrow appears below a candle when bullish momentum begins to strengthen. This signal indicates that buying pressure may be overtaking selling press
Neo Wave PRO
Nikolay Raykov
5 (1)
Price & Time Market Structure Indicator A professional market structure tool that analyzes waves through both price and time — not price alone. Main Description NeoWave PRO is a professional market structure indicator for MetaTrader 4 designed for traders who want to move beyond traditional one-dimensional wave tools such as ZigZag, swing indicators, and basic high/low systems. Most wave indicators analyze only one thing: Price. But a real market wave is not only a price movement. A true wave de
Ce produit a été mis à jour pour le marché 2026 et optimisé pour les dernières versions de MT5. AVIS DE MISE À JOUR DU PRIX : Smart Trend Trading System est actuellement disponible à $99 . Le prix passera à $199 après les 30 prochains achats . OFFRE SPÉCIALE : Après avoir acheté Smart Trend Trading System, envoyez-moi un message privé pour recevoir Smart Universal EA GRATUITEMENT et transformer vos signaux Smart Trend en trades automatisés. Smart Trend Trading System est un système de trading c
BTMM State Engine Pro is a MetaTrader 4 indicator for traders who use the Beat The Market Maker approach: Asian session context, kill zone timing, level progression, peak formation detection, and a multi-pair scanner from a single chart. It combines cycle state logic with a built-in scanner dashboard so you do not need the same tool on many charts at once. What it does Draws the Asian session range; session times can follow broker server offset or be set in inputs. Tracks level progression (L
IQ FX Gann Levels a precision trading indicator based on W.D. Gann’s square root methods . It plots real-time, non-repainting support and resistance levels to help traders confidently spot intraday and scalping opportunities with high accuracy. William Delbert Gann (W.D. Gann) was an exceptional market analyst, whose trading technique was based on a complex blend of mathematics, geometry, astrology, and ancient mathematics which proved to be extremely accurate. Setup & Guide:  Download  MT5 Ver
Le système PRO Renko est un système de trading très précis spécialement conçu pour le trading de graphiques RENKO. Il s'agit d'un système universel qui peut être appliqué à divers instruments de négociation. Le système neutralise efficacement ce qu'on appelle le bruit du marché en vous donnant accès à des signaux d'inversion précis. L'indicateur est très facile à utiliser et n'a qu'un seul paramètre responsable de la génération du signal. Vous pouvez facilement adapter l'outil à n'importe que
GOLD Impulse with Alert
Bernhard Schweigert
4.67 (12)
Cet indicateur est une super combinaison de nos 2 produits Advanced Currency IMPULSE with ALERT  +   Currency Strength Exotics . Il fonctionne pour tous les cadres temporels et montre graphiquement l'impulsion de force ou de faiblesse pour les 8 principales devises plus un symbole ! Cet indicateur est spécialisé pour montrer l'accélération de la force des devises pour tout symbole comme l'or, les paires exotiques, les matières premières, les indices ou les contrats à terme. C'est le premier
Market Structure Order Block Dashboard MT4 est un indicateur MetaTrader 4 conçu pour les traders qui veulent lire la structure de marché et les principales zones de réaction du prix directement sur le graphique. Il combine BOS, ChoCH, Order Blocks, Fair Value Gaps (FVG), Liquidité, Kill Zones, Volume Profile, et un dashboard compact pour une analyse rapide. Cet indicateur s'adresse aux traders qui utilisent la structure de marché, les concepts ICT et Smart Money comme cadre de décision. Il peut
Enigmera
Ivan Stefanov
5 (8)
ENIGMERA : Le cœur du marché Important : La démo de MQL5.com fonctionne dans le Strategy Tester et peut ne pas refléter pleinement les fonctionnalités d'Enigmera. Consultez la description, les captures d'écran et la vidéo pour plus de détails. N'hésitez pas à m'envoyer un message si vous avez des questions ! Le code de l'indicateur a été entièrement réécrit. La version 3.0 ajoute de nouvelles fonctionnalités et corrige les bugs accumulés depuis le lancement de l'indicateur. Introduction Cet in
Cet indicateur est un indicateur d'analyse automatique des vagues, parfait pour le trading pratique ! Cas... Remarque :   je n'ai pas l'habitude d'utiliser des noms occidentaux pour l'évaluation des vagues. En raison de l'influence de la convention de dénomination de Tang Lun (Tang Zhong Shuo Zen), j'ai nommé la vague de base comme   un stylo   et la bande d'onde secondaire comme   un segment   . en même temps, le segment a la direction de la tendance.Le   segment de tendance principal   est no
Introduction Harmonic Patterns are best used to predict potential turning point. Traditionally, Harmonic Pattern was identified manually connecting peaks and troughs points in the chart. Manual harmonic pattern detection is painfully tedious and not suitable for everyone. You are often exposed under subjective pattern identification with manual pattern detection. To avoid these limitations, Harmonic Pattern Plus was designed to automate your harmonic pattern detection process. The functionality
Current event:  https://c.mql5.com/1/326/A2SR2025_NoMusic.gif A. Qu'est-ce que l'A2SR ?   * C'est un indicateur technique avancé (pas de peinture, pas de retard). -- Conseils : -- sur https://www.mql5.com/en/blogs/post/734748/page4#comment_16532516 -- et https://www.mql5.com/en/users/yohana/blog A2SR a une technique spéciale pour déterminer les niveaux de Support (demande) et de Résistance (offre). Contrairement à la manière ordinaire que nous avons vue sur le net, A2SR a un concept original
Day Trader Master est un système de trading complet pour les day traders. Le système se compose de deux indicateurs. Un indicateur est un signal fléché pour acheter et vendre. C'est l'indicateur de flèche que vous obtenez. Je vous fournirai le deuxième indicateur gratuitement. Le deuxième indicateur est un indicateur de tendance spécialement conçu pour être utilisé conjointement avec ces flèches. LES INDICATEURS NE RÉPÉTENT PAS ET NE TARDENT PAS! L'utilisation de ce système est très simple. Il v
Market Structure Patterns MT4
Samuel Manoel De Souza
5 (18)
Market Structure Patterns   est un indicateur basé sur les   Smart Money Concepts   qui affiche les   éléments SMC/ICT   pouvant améliorer vos décisions de trading. Profitez des   alertes ,   notifications push   et   emails   pour être informé lorsqu’un élément se forme sur le graphique, que le prix franchit un niveau et/ou entre dans une zone. Les développeurs peuvent accéder aux valeurs des éléments de l’indicateur via les   variables globales , permettant l’automatisation des décisions de tr
PZ ABCD Retracement
PZ TRADING SLU
4 (5)
Identify precise entry and exit points with AB=CD patterns This indicator finds AB=CD retracement patterns. The AB=CD Retracement pattern is a 4-point price structure where the initial price segment is partially retraced and followed by an equidistant move from the completion of the pullback, and is the basic foundation for all harmonic patterns. [ Installation Guide | Update Guide | Troubleshooting | FAQ | All Products   ] Customizable pattern sizes Customizable AC and BD ratios Customizable b
Trend Lines PRO
Roman Podpora
5 (1)
TREND LINES PRO     Cet indicateur permet de comprendre les véritables changements de direction du marché. Il révèle les renversements de tendance et les points de retour des principaux acteurs. Tu vois     Lignes BOS     Détection des changements de tendance et des niveaux clés sur des unités de temps supérieures, sans paramètres complexes ni interférences inutiles. Les signaux restent affichés sur le graphique même après la fermeture de la bougie. VERSION MT 5    -     Révèle son potentiel max
The Propfolio Master Suite is the ultimate all-in-one analytical workstation for professional traders. Combining the power of the Beat The Market Maker (BTMM) methodology, Smart Money Concepts (SND/Liquidity), and Advanced Volume Profile, this suite replaces multiple different indicators with one optimized engine. Monitor up to 14 pairs simultaneously from a single chart, instantly identify market cycles, and seamlessly map institutional footprints with the click of a button. The Command Center
Legacy of Gann
Pavel Zamoshnikov
4.83 (12)
The indicator very accurately determines the levels of the possible end of the trend and profit fixing. The method of determining levels is based on the ideas of W.D.Gann, using an algorithm developed by his follower Kirill Borovsky. Extremely high reliability of reaching levels (according to K. Borovsky  - 80-90%) Indispensable for any trading strategy – every trader needs to determine the exit point from the market! Precisely determines targets on any timeframes and any instruments (forex, met
RFI levels PRO
Roman Podpora
5 (1)
L'indicateur montre avec précision les points de retournement et les zones de retour des prix où le       Acteurs majeurs   . Vous repérez les nouvelles tendances et prenez des décisions avec une précision maximale, en gardant le contrôle de chaque transaction. VERSION MT5     -     Révèle son potentiel maximal lorsqu'il est combiné à l'indicateur   TREND LINES PRO Ce que l'indicateur montre : Structures et niveaux d'inversion avec activation au début d'une nouvelle tendance. Affichage des nive
ACTUELLEMENT 40% DE RÉDUCTION ! ! La meilleure solution pour tout débutant ou Expert Trader ! Cet indicateur est un outil de trading unique, de haute qualité et abordable car nous avons incorporé un certain nombre de caractéristiques exclusives et une formule secrète. Avec seulement UN graphique, il donne des alertes pour les 28 paires de devises. Imaginez comment votre trading s'améliorera parce que vous serez capable de repérer le point de déclenchement exact d'une nouvelle tendance ou d'un
Plus de l'auteur
Volumatic VIDyA MT5
Duc Hoan Nguyen
5 (2)
Special offer : ALL TOOLS , just $35 each! New tools   will be   $30   for the   first week   or the   first 3 purchases !  Trading Tools Channel on MQL5 : Join my MQL5 channel to update the latest news from me Volumatic VIDYA (Variable Index Dynamic Average) est un indicateur avancé conçu pour suivre les tendances et analyser la pression d'achat et de vente à chaque phase d'une tendance. En utilisant la Moyenne Dynamique à Indice Variable (Variable Index Dynamic Average) comme technique centra
Special offer : ALL TOOLS , just $35 each! New tools   will be   $30   for the   first week   or the   first 3 purchases !  Trading Tools Channel on MQL5 : Join my MQL5 channel to update the latest news from me L'indicateur Supertrend Fakeout est une version améliorée de l'indicateur classique Supertrend , conçu pour fournir des signaux de tendance plus fiables. En intégrant des fonctionnalités avancées telles que Fakeout Index Limit et Fakeout ATR Mult , cet indicateur aide à filtrer les faux
FREE
Special offer : ALL TOOLS , just $35 each! New tools   will be   $30   for the   first week   or the   first 3 purchases !  Trading Tools Channel on MQL5 : Join my MQL5 channel to update the latest news from me Nous vous présentons le SuperTrend ATR Multiplier with Scanner for MT5 – un outil puissant et polyvalent conçu pour vous aider à anticiper les tendances du marché, avec des fonctionnalités personnalisables et des alertes en temps réel. Basé sur la logique éprouvée du SuperTrend de Kivanc
FREE
Special offer : ALL TOOLS , just $35 each! New tools   will be   $30   for the   first week   or the   first 3 purchases !  Trading Tools Channel on MQL5 : Join my MQL5 channel to update the latest news from me Maximisez votre avantage commercial avec Follow Line MT5 avec Scanner, un indicateur avancé basé sur la volatilité conçu pour les traders sérieux. Cet outil combine la puissance des Bandes de Bollinger avec des paramètres personnalisables, offrant des informations précises sur les mouvem
FREE
Special offer : ALL TOOLS , just $35 each! New tools   will be   $30   for the   first week   or the   first 3 purchases !  Trading Tools Channel on MQL5 : Join my MQL5 channel to update the latest news from me L'Indicateur de Modèle de Renversement en Trois Barres offre un outil puissant pour les traders, identifiant et mettant en évidence automatiquement les modèles de renversement en trois barres directement sur le graphique des prix. Cet indicateur est une ressource précieuse pour détecter
OA SnR Power MT5
Duc Hoan Nguyen
5 (3)
Special offer : ALL TOOLS , just $35 each! New tools   will be   $30   for the   first week   or the   first 3 purchases !  Trading Tools Channel on MQL5 : Join my MQL5 channel to update the latest news from me Vue d’ensemble OA SnR Power est un outil puissant conçu pour aider les traders à identifier et évaluer la force des niveaux de support et de résistance. En intégrant des facteurs clés tels que le volume de trading, la fréquence des rebonds et le nombre de retests, cet indicateur offre u
FREE
Special offer : ALL TOOLS , just $35 each! New tools   will be   $30   for the   first week   or the   first 3 purchases !  Trading Tools Channel on MQL5 : Join my MQL5 channel to update the latest news from me Dans le paysage actuel du trading financier, où la volatilité est importante, l’identification précise des niveaux de support et de résistance est cruciale pour permettre aux traders de prendre des décisions éclairées. Predictive Ranges Scanner Multi-TF est un outil avancé conçu pour aid
Special offer : ALL TOOLS , just $35 each! New tools   will be   $30   for the   first week   or the   first 3 purchases !  Trading Tools Channel on MQL5 : Join my MQL5 channel to update the latest news from me Trendlines with Breaks Scanner est un outil de trading de pointe conçu pour aider les traders à identifier les tendances critiques et à détecter les cassures en temps réel. Grâce à des lignes de tendance générées automatiquement basées sur des points pivots, cet indicateur permet aux tra
Supertrend Fakeout MT4
Duc Hoan Nguyen
4.2 (5)
Special offer : ALL TOOLS , just $35 each! New tools   will be   $30   for the   first week   or the   first 3 purchases !  Trading Tools Channel on MQL5 : Join my MQL5 channel to update the latest news from me L'indicateur Supertrend Fakeout est une version améliorée de l'indicateur classique Supertrend , conçu pour fournir des signaux de tendance plus fiables. En intégrant des fonctionnalités avancées telles que Fakeout Index Limit et Fakeout ATR Mult , cet indicateur aide à filtrer les faux
FREE
Special offer : ALL TOOLS , just $35 each! New tools   will be   $30   for the   first week   or the   first 3 purchases !  Trading Tools Channel on MQL5 : Join my MQL5 channel to update the latest news from me L’indicateur Liquidity Pools est un outil avancé qui identifie et marque les zones de liquidité potentielles sur le graphique en analysant les zones de hauts et bas avec des touches fréquentes de mèches, le nombre de revisites et le volume échangé dans chaque zone. Cet outil offre aux tr
Special offer : ALL TOOLS , just $35 each! New tools   will be   $30   for the   first week   or the   first 3 purchases !  Trading Tools Channel on MQL5 : Join my MQL5 channel to update the latest news from me L'indicateur Zero Lag MA Trend Levels avec Scanner combine la moyenne mobile à zéro décalage (ZLMA) avec une moyenne mobile exponentielle standard (EMA), offrant aux traders une vue complète de la dynamique du marché et des niveaux de prix clés. De plus, les fonctions de scanner et d'ale
Offre spéciale : ALL TOOLS , seulement 35 $ chacun ! New tools   will be   $30   for the   first week   or the   first 3 purchases !  Trading Tools Channel on MQL5 : Join my MQL5 channel to update the latest news from me Dans un environnement de trading volatile, un outil d’analyse puissant et intuitif peut vous aider à saisir rapidement les opportunités. Fibonacci Trend Scanner intègre non seulement les fonctionnalités traditionnelles de l’indicateur Fibonacci et SuperTrend, mais étend égaleme
Special offer : ALL TOOLS , just $35 each! New tools   will be   $30   for the   first week   or the   first 3 purchases !  Trading Tools Channel on MQL5 : Join my MQL5 channel to update the latest news from me Dans le paysage en constante évolution du trading financier, identifier et analyser avec précision les niveaux de support et de résistance est essentiel pour prendre des décisions d'investissement éclairées. SnR Retest and Break Multi-Timeframe est un indicateur de support et de résistan
Special offer : ALL TOOLS , just $35 each! New tools   will be   $30   for the   first week   or the   first 3 purchases !  Trading Tools Channel on MQL5 : Join my MQL5 channel to update the latest news from me Kalman Trend Levels est un indicateur avancé de suivi de tendance qui exploite la technologie de pointe des filtres de Kalman pour fournir aux traders des signaux analytiques puissants. Conçu pour être précis et adaptable, cet outil identifie non seulement des zones critiques de support
Special offer : ALL TOOLS , just $35 each! New tools   will be   $30   for the   first week   or the   first 3 purchases !  Trading Tools Channel on MQL5 : Join my MQL5 channel to update the latest news from me Le Fibonacci Confluence Toolkit Multi-Timeframe est un outil avancé d'analyse technique conçu pour les traders professionnels, aidant à identifier les zones potentielles de renversement des prix en combinant des signaux et des modèles clés du marché. Avec des capacités d'affichage multi-
RSI Divergence MT5 Scanner
Duc Hoan Nguyen
3.33 (3)
Special offer : ALL TOOLS , just $35 each! New tools   will be   $30   for the   first week   or the   first 3 purchases !  Trading Tools Channel on MQL5 : Join my MQL5 channel to update the latest news from me Sur les marchés financiers dynamiques, identifier les signaux de renversement de tendance est essentiel pour un trading efficace. Le RSI Divergence Scanner est conçu pour vous aider à détecter avec précision et efficacité les signaux de divergence RSI sur diverses paires de devises et di
FREE
Special offer : ALL TOOLS , just $35 each! New tools   will be   $30   for the   first week   or the   first 3 purchases !  Trading Tools Channel on MQL5 : Join my MQL5 channel to update the latest news from me L'indicateur Volumetric Order Blocks Multi Timeframe est un outil puissant conçu pour les traders cherchant à obtenir des informations approfondies sur le comportement du marché en identifiant les zones clés de prix où les participants importants accumulent des ordres. Ces zones, connues
Special offer : ALL TOOLS , just $35 each! New tools   will be   $30   for the   first week   or the   first 3 purchases !  Trading Tools Channel on MQL5 : Join my MQL5 channel to update the latest news from me Maximisez votre avantage commercial avec Follow Line avec Scanner, un indicateur avancé basé sur la volatilité conçu pour les traders sérieux. Cet outil combine la puissance des Bandes de Bollinger avec des paramètres personnalisables, offrant des informations précises sur les mouvements
FREE
Special offer : ALL TOOLS , just $35 each! New tools   will be   $30   for the   first week   or the   first 3 purchases !  Trading Tools Channel on MQL5 : Join my MQL5 channel to update the latest news from me Nous vous présentons le SuperTrend by Kivanc Ozbilgic with Scanner – un outil puissant et polyvalent conçu pour vous aider à anticiper les tendances du marché, avec des fonctionnalités personnalisables et des alertes en temps réel.  Vous pouvez ajuster la méthode de calcul de l' ATR entr
FREE
AI Channels MT4
Duc Hoan Nguyen
5 (1)
Special offer : ALL TOOLS , just $35 each! New tools   will be   $30   for the   first week   or the   first 3 purchases !  Trading Tools Channel on MQL5 : Join my MQL5 channel to update the latest news from me L’indicateur AI Channels utilise le clustering K-means mobile , une technique puissante d’apprentissage automatique en analyse de regroupement, pour fournir des informations en temps réel sur les tendances de prix sous-jacentes. Cet indicateur crée des canaux adaptatifs basés sur les don
FREE
AI Channels MT5
Duc Hoan Nguyen
5 (1)
Special offer : ALL TOOLS , just $35 each! New tools   will be   $30   for the   first week   or the   first 3 purchases !  Trading Tools Channel on MQL5 : Join my MQL5 channel to update the latest news from me L’indicateur AI Channels utilise le clustering K-means mobile , une technique puissante d’apprentissage automatique en analyse de regroupement, pour fournir des informations en temps réel sur les tendances de prix sous-jacentes. Cet indicateur crée des canaux adaptatifs basés sur les don
FREE
Special offer : ALL TOOLS , just $35 each! New tools   will be   $30   for the   first week   or the   first 3 purchases !  Trading Tools Channel on MQL5 : Join my MQL5 channel to update the latest news from me Sur les marchés financiers dynamiques, identifier les signaux de renversement de tendance est essentiel pour un trading efficace. Le RSI Divergence Scanner est conçu pour vous aider à détecter avec précision et efficacité les signaux de divergence RSI sur diverses paires de devises et di
FREE
Volumatic VIDyA MT4
Duc Hoan Nguyen
4.5 (4)
Special offer : ALL TOOLS , just $35 each! New tools   will be   $30   for the   first week   or the   first 3 purchases !  Trading Tools Channel on MQL5 : Join my MQL5 channel to update the latest news from me Volumatic VIDYA (Variable Index Dynamic Average) est un indicateur avancé conçu pour suivre les tendances et analyser la pression d'achat et de vente à chaque phase d'une tendance. En utilisant la Moyenne Dynamique à Indice Variable (Variable Index Dynamic Average) comme technique centra
Special offer : ALL TOOLS , just $35 each! New tools   will be   $30   for the   first week   or the   first 3 purchases !  Trading Tools Channel on MQL5 : Join my MQL5 channel to update the latest news from me Vue d’ensemble OA SnR Power est un outil puissant conçu pour aider les traders à identifier et évaluer la force des niveaux de support et de résistance. En intégrant des facteurs clés tels que le volume de trading, la fréquence des rebonds et le nombre de retests, cet indicateur offre u
FREE
Special offer : ALL TOOLS , just $35 each! New tools   will be   $30   for the   first week   or the   first 3 purchases !  Trading Tools Channel on MQL5 : Join my MQL5 channel to update the latest news from me Nous vous présentons le RSI Kernel Optimized with Scanner, un outil révolutionnaire qui redéfinit l'analyse RSI traditionnelle en intégrant l'algorithme puissant de l'estimation de densité par noyau (KDE). Cet indicateur avancé fournit non seulement des informations en temps réel sur les
Special offer : ALL TOOLS , just $35 each! New tools   will be   $30   for the   first week   or the   first 3 purchases !  Trading Tools Channel on MQL5 : Join my MQL5 channel to update the latest news from me L'indicateur Volumetric Order Blocks Multi Timeframe est un outil puissant conçu pour les traders cherchant à obtenir des informations approfondies sur le comportement du marché en identifiant les zones clés de prix où les participants importants accumulent des ordres. Ces zones, connues
Special offer : ALL TOOLS , just $35 each! New tools   will be   $30   for the   first week   or the   first 3 purchases !  Trading Tools Channel on MQL5 : Join my MQL5 channel to update the latest news from me Commençons par les fonctionnalités exceptionnelles : L' EA est équipé d'un FILTRE D'ACTUALITÉS et d'un FILTRE RSI. Faible risque (certaines paires de devises ont un DrawDown de < 10 %, voire 5 %). Cet EA n'utilise aucune fonction de martingale ou de grille. L'EA peut afficher des zones v
Special offer : ALL TOOLS , just $35 each! New tools   will be   $30   for the   first week   or the   first 3 purchases !  Trading Tools Channel on MQL5 : Join my MQL5 channel to update the latest news from me L'Indicateur de Modèle de Renversement en Trois Barres offre un outil puissant pour les traders, identifiant et mettant en évidence automatiquement les modèles de renversement en trois barres directement sur le graphique des prix. Cet indicateur est une ressource précieuse pour détecter
SMC System MT4
Duc Hoan Nguyen
4.5 (2)
Special offer : ALL TOOLS , just $35 each! New tools   will be   $30   for the   first week   or the   first 3 purchases !  Trading Tools Channel on MQL5 : Join my MQL5 channel to update the latest news from me SMC est une approche de trading qui aide les traders à identifier les zones de liquidité, les positions des ordres institutionnels et les points de retournement clés du marché. En utilisant les principes du SMC, les traders peuvent naviguer plus efficacement sur le marché, trouvant les m
Special offer : ALL TOOLS , just $35 each! New tools   will be   $30   for the   first week   or the   first 3 purchases !  Trading Tools Channel on MQL5 : Join my MQL5 channel to update the latest news from me L'indicateur Zero Lag MA Trend Levels MT5 avec Scanner combine la moyenne mobile à zéro décalage (ZLMA) avec une moyenne mobile exponentielle standard (EMA), offrant aux traders une vue complète de la dynamique du marché et des niveaux de prix clés. De plus, les fonctions de scanner et d
Filtrer:
Aucun avis
Répondre à l'avis