MP Squeeze Momentum for MT4
- Indicateurs
- Version: 1.0

MP Squeeze Momentum is a volatility and momentum indicator derivated of "TTM Squeeze" volatility indicator introduced by John Carter. It capitalizes on the tendency for price to break out strongly after consolidating in a tight range.
Introduction:
The volatility component of MP Squeeze Momentum measures price compression using Bollinger Bands and Keltner Channels. If the Bollinger Bands are completely enclosed within the Keltner Channels, that indicates a period of very low volatility. This state is known as the squeeze. When the Bollinger Bands expand and move back outside of the Keltner Channel, the squeeze is said to have released: volatility increases and prices are likely to break out of that tight range.
This Indicator has two versions which can be selected by user:
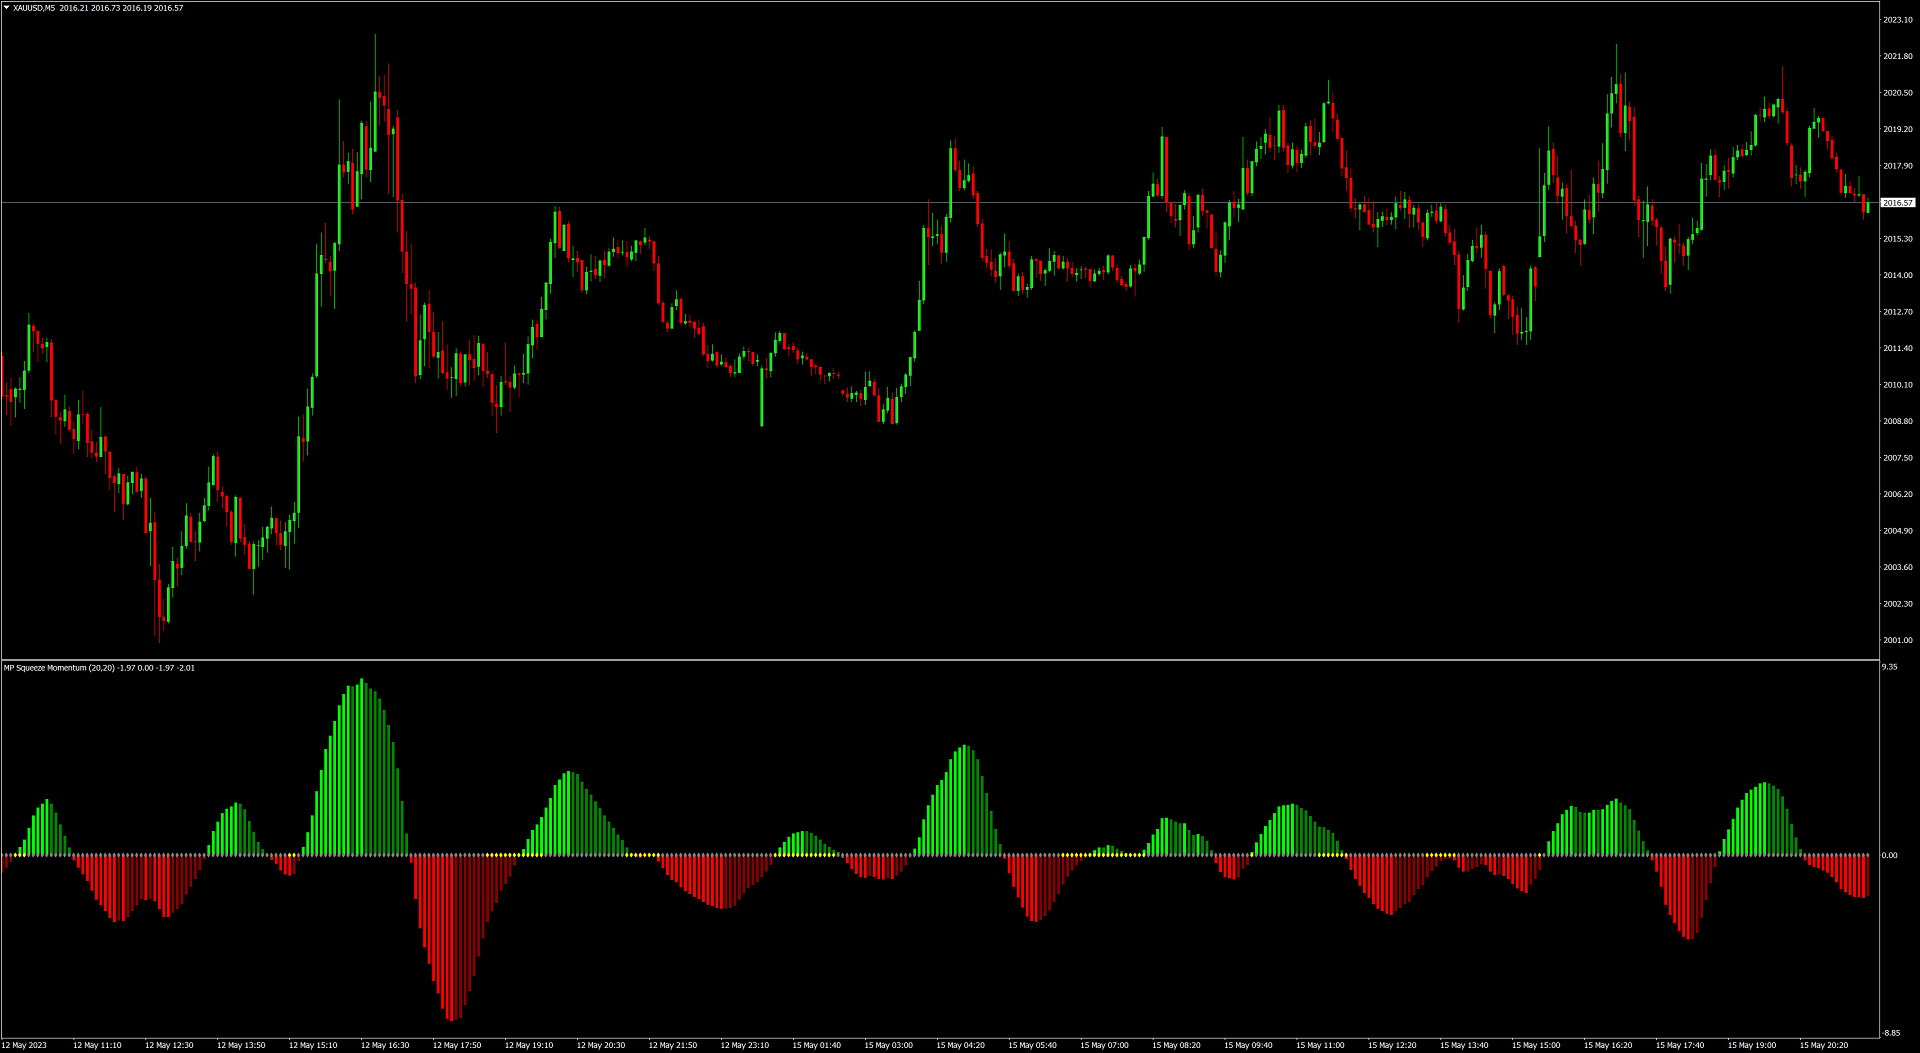
- Histogram
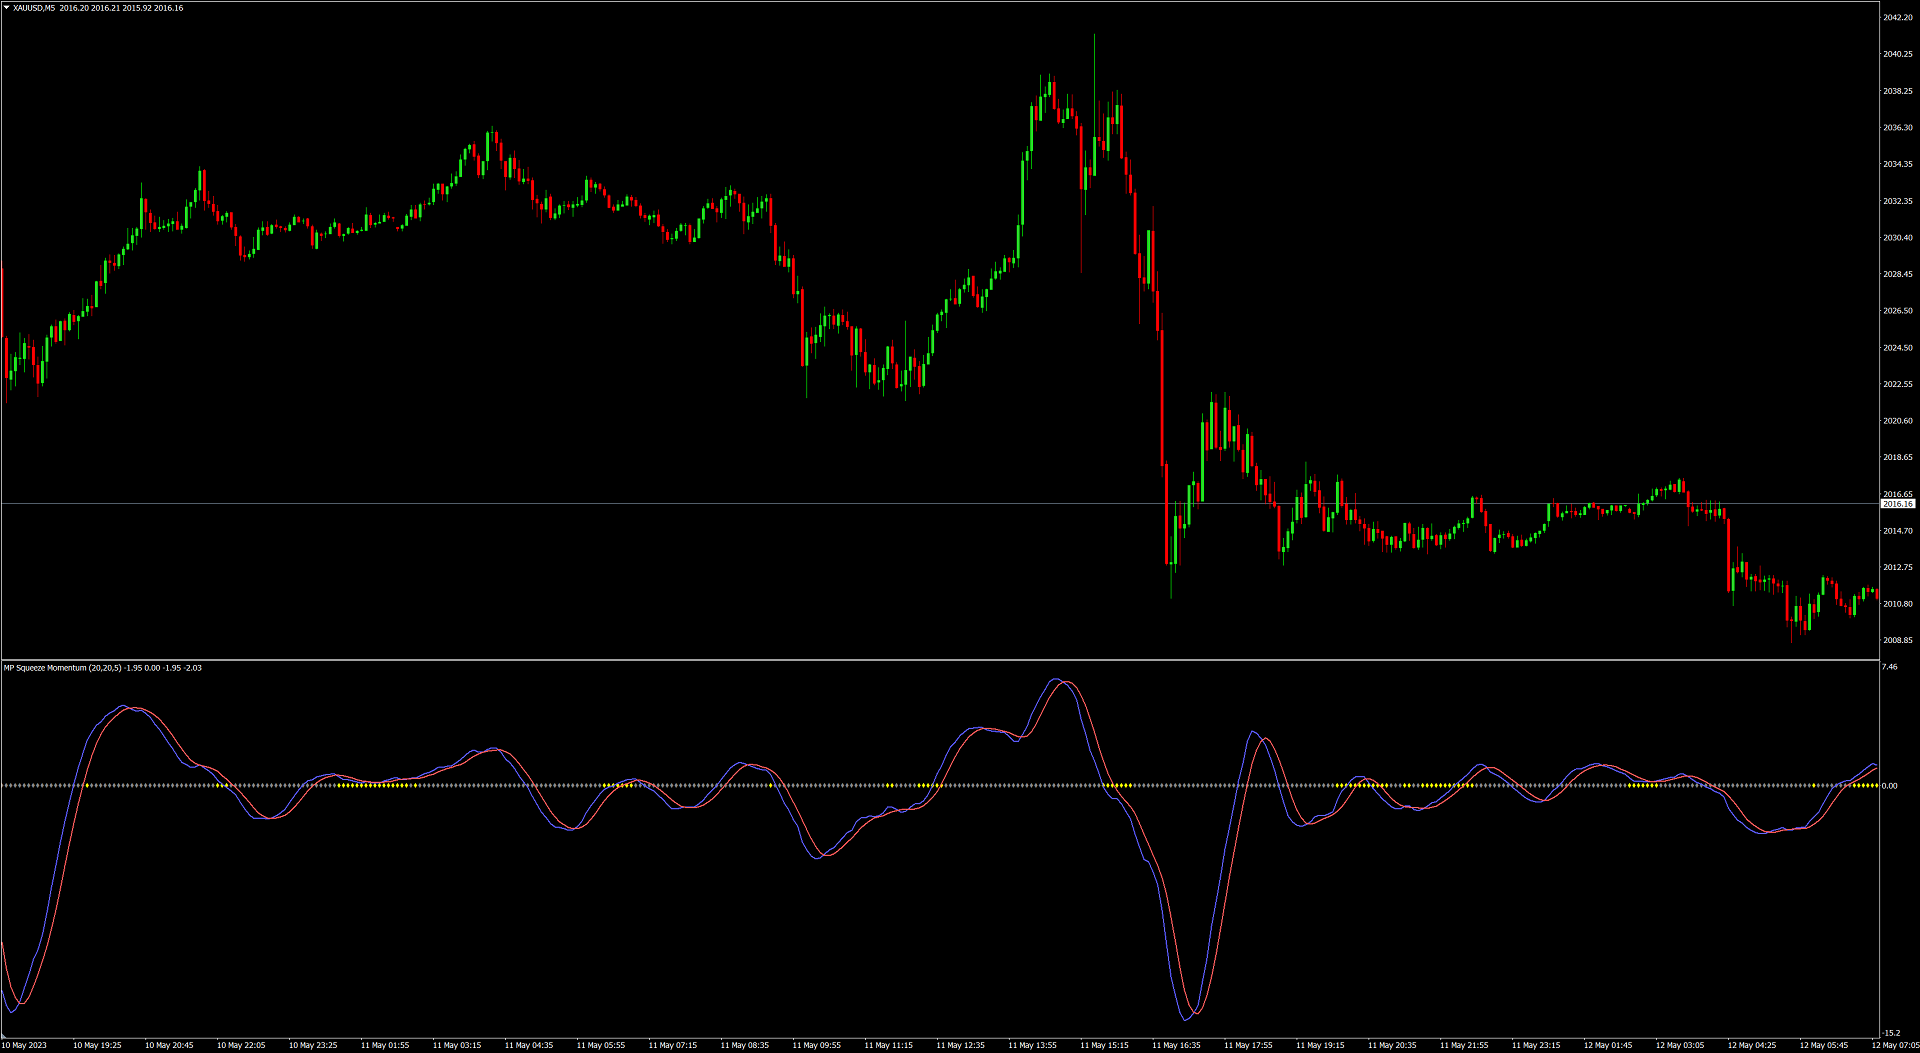
- Line Graph
In the first version a momentum oscillator is used to show the expected direction of the move when the squeeze fires. This histogram oscillates around the zero line; increasing momentum above the zero line indicates an opportunity to purchase long, while momentum falling below the zero line can indicate a shorting opportunity.
The second version Indicator includes line graph of the main indicator instead of using a Histogram and a second Signal line (5 bars SMA of the original line) to provide visual BUY/SELL signals.
Squeeze On/Off Dots:
The on/off state of the squeeze is shown with small dots on the zero line of the indicator: yellow dots indicate that the squeeze is on. This signifies low volatility, market preparing itself for an explosive move (up or down). Gray dots show "Squeeze release".
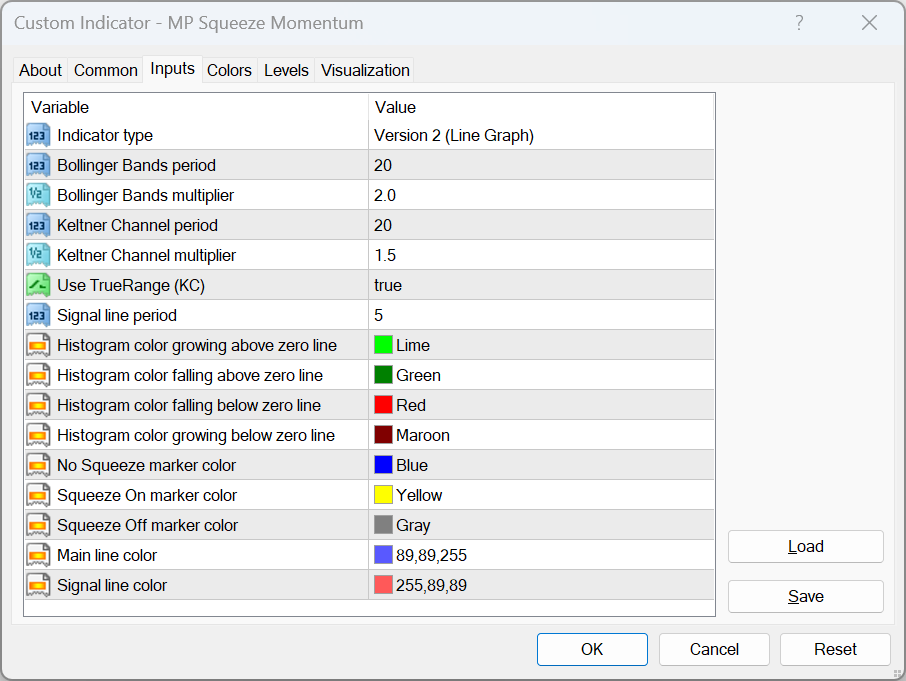
Settings:
- Indicator type (Histogram/Line Graph)
- Bollinger Bands period
- Bollinger Bands multiplier
- Keltner Channel period
- Keltner Channel multiplier
- Use TrueRange (KC)
- Signal line period
- Histogram color growing above zero line
- Histogram color falling above zero line
- Histogram color falling below zero line
- Histogram color growing below zero line
- No Squeeze marker color
- Squeeze On marker color
- Squeeze Off marker color
- Main line color
- Signal line color
Usage:
In Histogram version:
Wait till the first gray after a yellow dot, and take a position in the direction of the momentum (for example, if momentum value is above zero, go long). Exit the position when the momentum changes (increase or decrease signified by a color change).
In Line Graph version:
BUY when main blue line crosses ABOVE the red signal line,SELL when blue line crosses BELOW the red signal line.
#Tags: Squeeze Momentum, Squeeze Momentum Indicator, Squeeze Momentum Oscillator, Volatility Indicator, Momentum Indicator, Volatility, Momentum, Buy Signal, Sell Signal, Bollinger Bands, Keltner Channel
___________________________________________________________________________________
Disclaimer:
Do NOT trade or invest based upon the analysis presented on this channel. Always do your own research and due diligence before investing or trading. I’ll never tell you what to do with your capital, trades or investments. I’ll also never recommend for you to buy, sell, long or short any asset, commodity, security, derivative or cryptocurrency related instrument as it's extremely HIGH RISK! You should always consult with a professional/licensed financial adviser before trading or investing in any type of assets.


初めまして このインジ大変気に入りました。 このインジに手を加えてテストEA作ってみたいのですが1万円で売ってください。 個人用なので転売とかは絶対しないので安心してください