Fibolopes Z
- Indicadores
- Versión: 4.8
- Actualizado: 23 mayo 2020
- Activaciones: 5

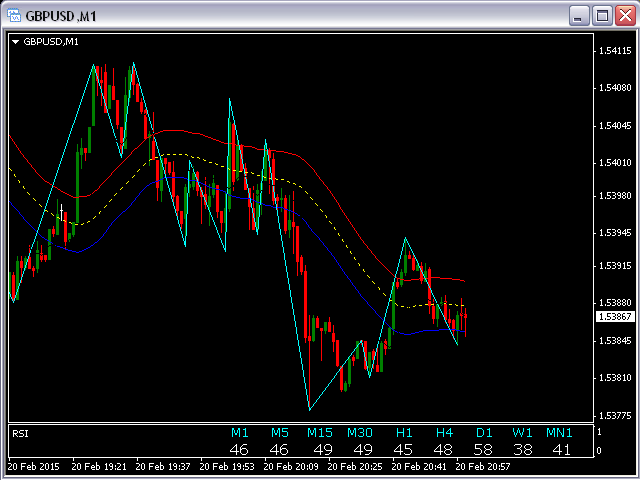
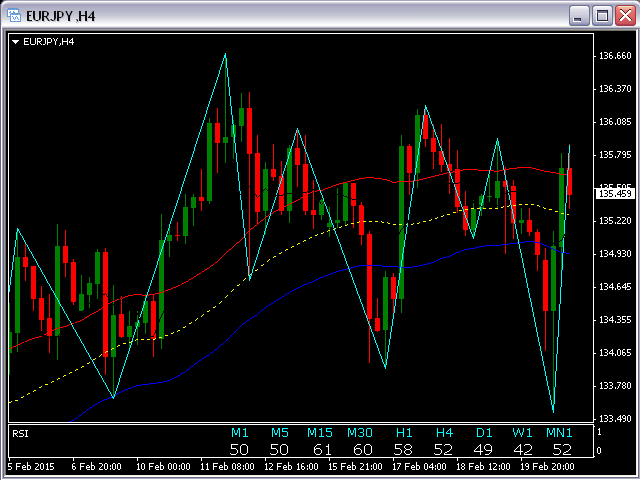
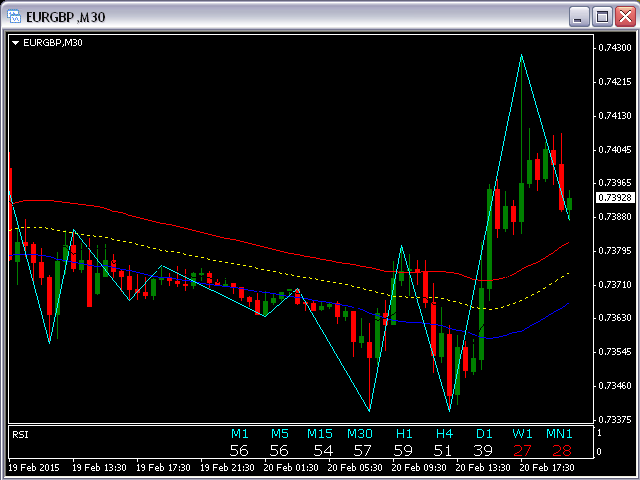
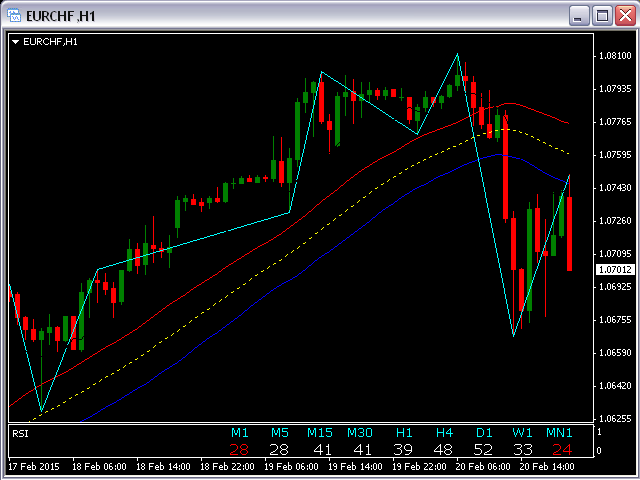
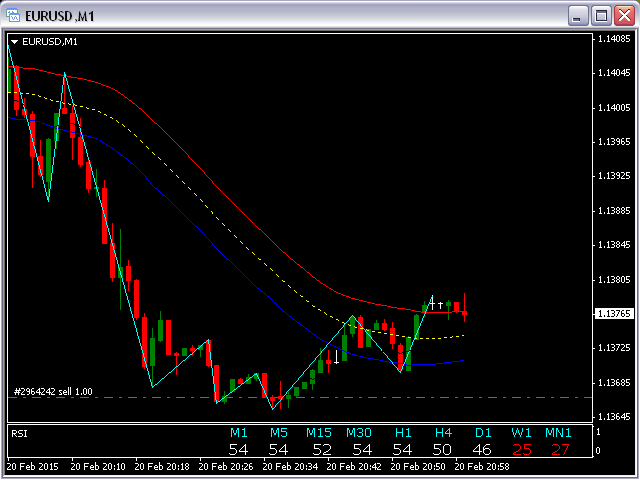
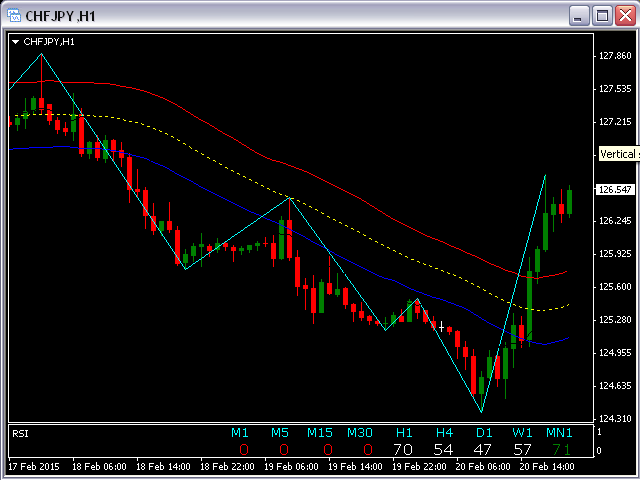
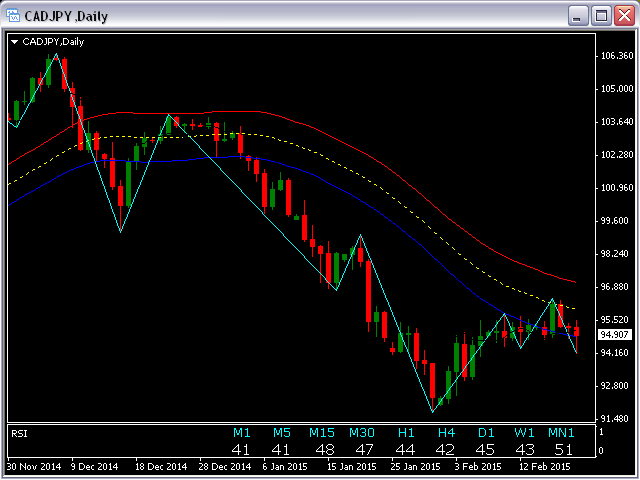
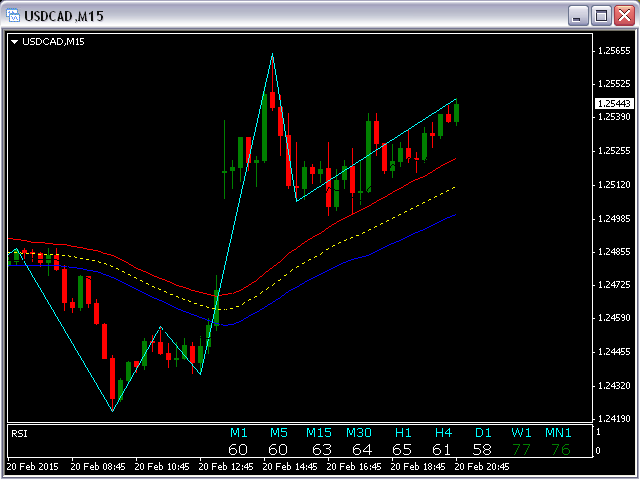
Fibolopes (convertido de Envelopes) Indicador se basa en la secuencia de Fibonacci.
El parámetro de entrada FiboNumPeriod es responsable del número en la secuencia entera (0, 1, 1, 2, 3, 5. 8 13, 34, 55, 89...)
El indicador calculará la línea de puntos Amarilla Principal y 2 bandas como una +/- Desviación a ella.
Este indicador está calculando un ZigZag (línea Aqua) que se combinan con Fibolopes juntos forman un sistema de señales para Abrir (Z cruce Fibolopes) una nueva posición y Cerrar (Z cruce Fibolopes en dirección opuesta) una posición existente.