Equidistant channel Window
- Indicadores
- Versión: 1.0
- Activaciones: 5

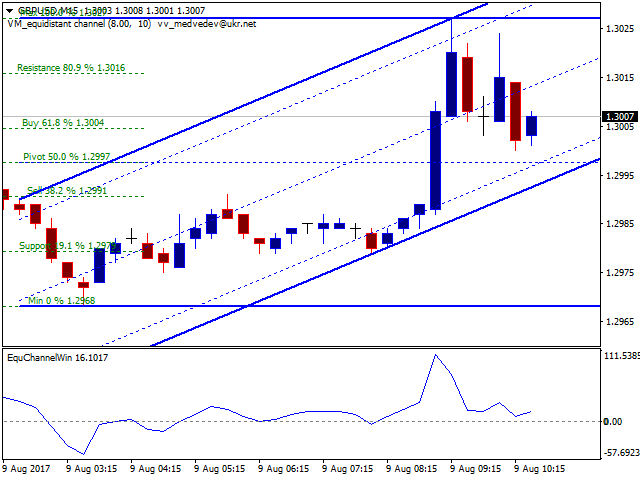
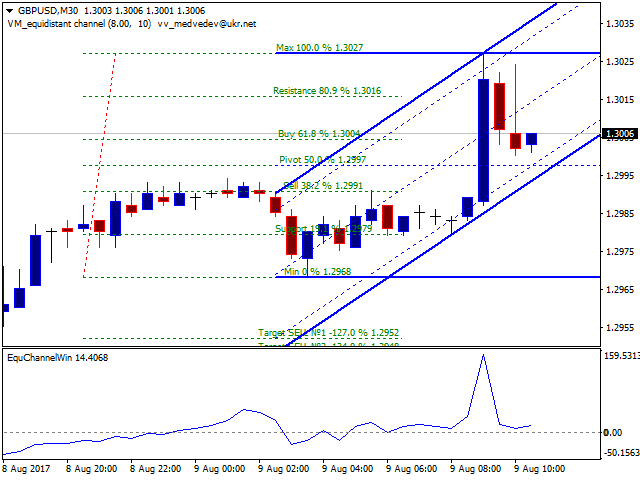
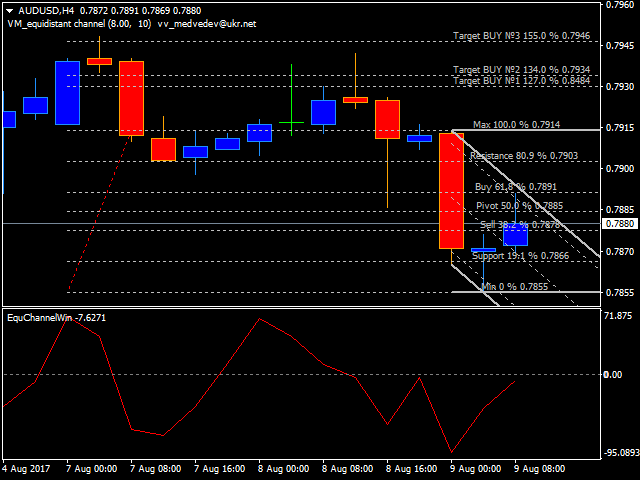
Este indicador es la continuación lógica del conocido indicador de canal equidistante: https://www.mql5.com/en/market/product/8723. El objetivo principal del indicador es la visualización de los niveles de precios relativos al canal paralelo utilizando los niveles de Fibo Bobokus en una ventana separada y el historial de precios. Esto a menudo permite pronosticar el movimiento futuro del precio con un grado suficientemente alto de probabilidad. La ecuación de cálculo de los niveles Fibo es la siguiente:
FiboLevel = (50-(100*((Close[i]-CL)/delta_HLC)))*-1;
Close[i] - nivel de precio de cierre de la barra actual;
CL - nivel inferior del canal;
delta_HLC - diferencia entre los niveles superior e inferior del canal.
Parámetros
- Período de cálculo del indicador en horas - período de cálculo del indicador en horas;
- Rango de la señal en % de la anchura del canal - nivel de la señal en % de la anchura del canal. El nivel de señal es una línea discontinua trazada paralelamente a la principal con las proporciones especificadas;
- espectro decolor - conjunto de colores para trazar los canales;
- color RES_SUP - color del canal paralelo;
- color CANAL - color del canal principal;
- grosor de línea - ancho de línea del canal;
- width1 - ancho de línea del canal paralelo
- width2 - anchura de la línea del canal principal;
- Niveles Fibo en el canal - activar/desactivar los niveles Fibo Bobokus;
- Desplazamiento a la izquierdade la visualización de los niveles fibo - desplazamiento a la izquierda para visualizar los niveles Fibo Bobokus;
- color_fibo - color de los niveles Fibo Bobokus.


El usuario no ha dejado ningún comentario para su valoración