ICT Unicorn Model for MT4
- Indicadores
-
Minh Truong Pham
 Hello, my name is Pham and I am a programmer and trader! At here, I create amazing forex indicators and expert advisors for Metatrader.
I will try:
+ Provide best tools base on my 5 years experience as a trader and 10 years as a programmer. - Versión: 1.7
- Actualizado: 11 octubre 2024
- Activaciones: 5
El indicador ICT Unicorn Modeldestaca la presencia de patrones "unicornio" en el gráfico del usuario, que se deriva de las conferencias de"The Inner Circle Trader" (ICT).
Los patrones detectados van seguidos de objetivos con una distancia controlada por el usuario.
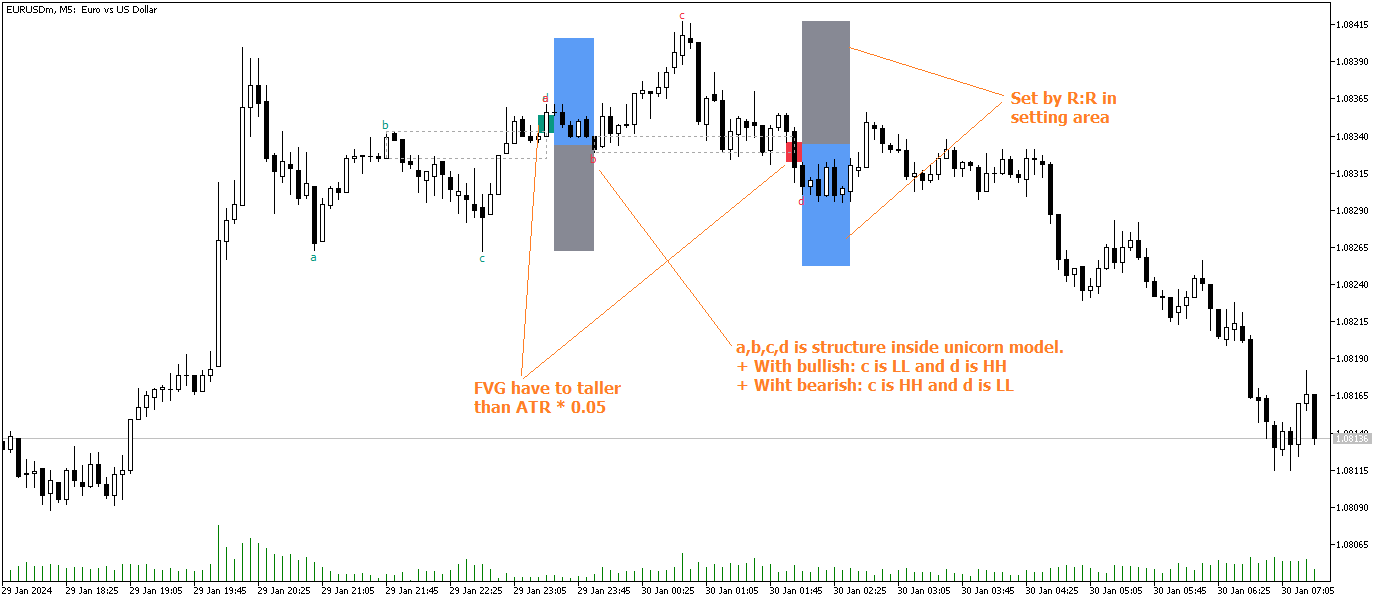
🔶 USO (imagen 2)
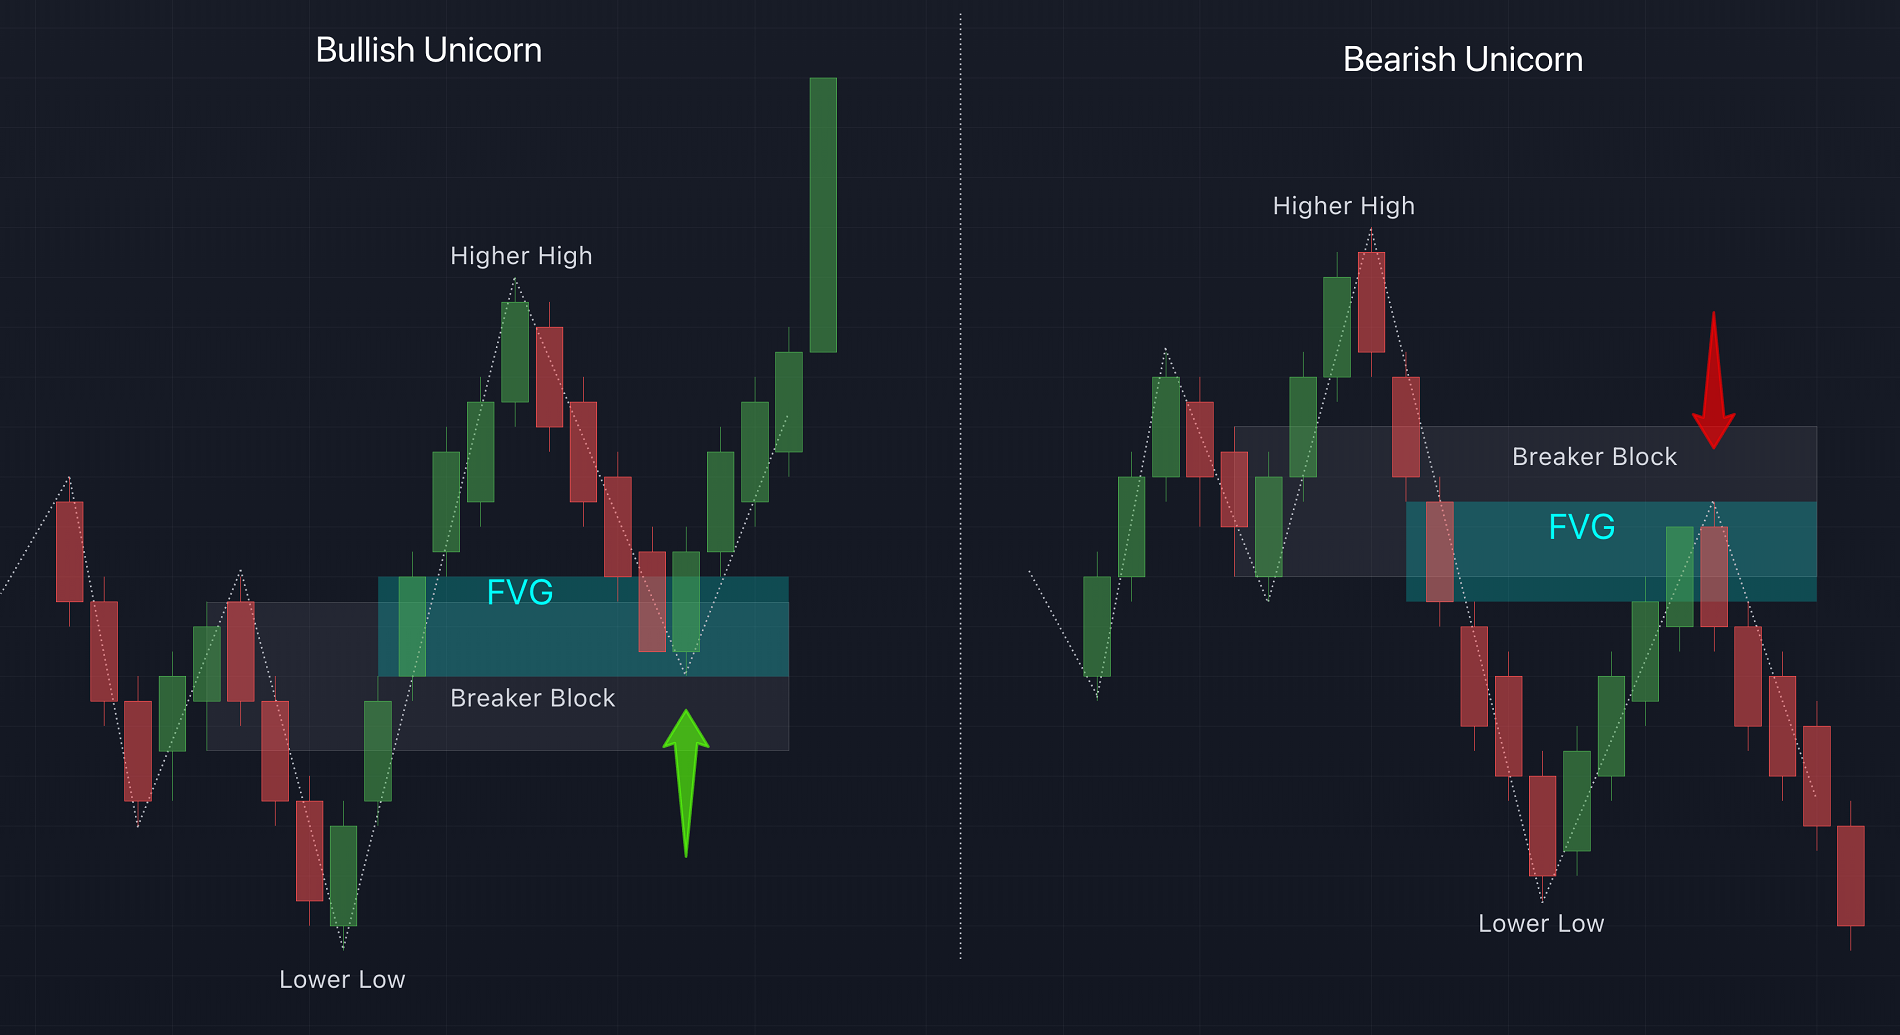
UnPatrón Unicornio Alcista consiste en:
- Un mínimo inferior (LL), seguido de un máximo superior (HH)
- Una Brecha de Valor Justo (FVG), superpuesta al Bloque de Ruptura establecido
- Un retesteo exitoso del FVG que confirma el patrón.
- Un Máximo Superior (HH), seguido de un Mínimo Inferior (LL)
- Una Brecha de Valor Justo (FVG), superpuesta al Bloque de Ruptura establecido.
- Un retesteo exitoso del FVG que confirma el patrón.
La detección del patrón depende de las oscilaciones detectadas, que pueden controlarse mediante el ajuste Swing. El uso de valores más altos de este ajuste devolverá bloques de interruptores de mayor duración.
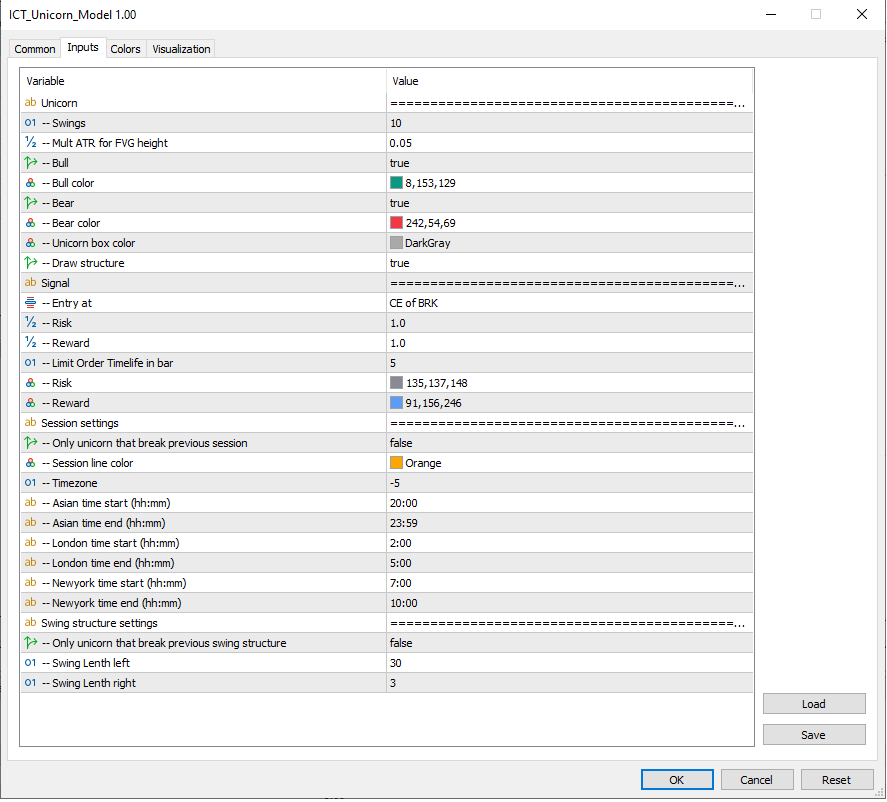
🔶 AJUSTES🔹 Unicorn
- Oscilaciones: Esto establece la longitud de las oscilaciones, utilizadas para la detección subyacentede Patrones ZigZag yUnicornio.
- Mult ATR para altura FVG: FVG se considera válido cuando su altura es mayor que el ATR multiplicado por este valor. Por defecto es 0.05.
- Alcista: Habilita/deshabilita los patrones alcistas, y establece el color de la caja FVG .
- Bajista: Habilita/deshabilita los patrones bajistas, y establece el color de la caja FVG.
- Dibujar estructura: Esta opción permite marcar el punto de pivote dentro del modelo como a,b,c,d: Con el modelo alcista, c es LL y d es HH; Con el modelo bajista, c es HH y d es LL
🔹 S eñal
- Entrada en: Elija cómo entrada incluyen:
- CE de BRK: 50% del bloque rompedor.
- Borde de BRK: entrada en la parte superior del bloque de ruptura con modelo alcista y viceversa
- CE de FVG: 50% del gap del valor razonable
- Borde de FVG: entrada en la parte superior del gap de valor razonable con modelo alcista y viceversa
- Rish/Reward y su configuración de color.
- Limit order timelife (in bar): establece el número de barras que la caja de riesgo y recompensa mantendrá dibujada.
Configuración de la sesión
- Sólo modelo que rompe sesión anterior: Cuando es true, solo nos importa que el modelo alcista tenga C menor que el mínimo de la sesión anterior y viceversa. Por ejemplo, esperamos hasta el cierre asiático y sólo nos interesa el modelo alcista que rompa el mínimo asiático.
- Otros ajustes incluyen: Zona horaria, hora de la sesión y color
🔹 Configuración de la Estructura de Swing
- Sólo modelo que rompe la estructura de oscilación anterior: Cuando es true, solo nos importa que modelo alcista tenga C inferior al mínimo del swing anterior y vice versal.
- Longitud del swing: incluye longitud izquierda y derecha.
🔶 ALERTAS
- Cuando modelo unicornio detectado
- Cuando el modelo fue invalidado por el tiempo (Depende de laconfiguración de timelife de la orden Limit)
- Cuando señal de compra/venta (entrada cruzada de precios)
Puede configurar la notificación con alerta, correo electrónico, MT5 aplicación móvil o telegrama.
🔶 BUFFER
Para facilitar la creación de EA basado en este indicador, añadimos buffer como sigue:
0: buff_buy_entry
1: buff_buy_stoploss
2: buff_buy_take profit
//---
3: buff_sell_ent
4: buff_sell_sl
5: buff_sell_tp
Valor por defecto =0. Cuando se tiene señal de unicornio, la vela tendrá valor de buffer como precio.
Notas:
Recuerde que el patrón anterior no ocurre a menudo, por lo que es normal que la primera vez que lo ejecute, no vea ningún cambio en el gráfico en la vista actual. Eso significa que no hay ningún patrón en la vista actual, no que el indicador no esté funcionando.
+ Puede comprobar los patrones anteriores abriendo la herramienta "Lista de objetos" de MT terminator (utilice la combinación de teclas Ctl+B), haga clic en "Listar todos" para mostrar todos los objetos. Haga clic en un objeto con el prefijo que haya establecido o el predeterminado es "un". Por último, haga clic en el botón "Mostrar" y verá el patrón en el gráfico.
+ Otra forma es que puede ejecutar un backtest para ver la eficacia del indicador.
CÓMO CONSTRUIR UN SISTEMA DE EXPLORACIÓN DE SEÑALES:
Para utilizar este indicador de manera efectiva, construya un sistema de escaneo de señales de la siguiente manera:
+ Con 1 símbolo, abra cada marco temporal que le interese en cada gráfico diferente.
+ Con cada gráfico abierto, adjunte varios indicadores, cada uno de ellos para una configuración diferente (por lo general, las diferentes configuraciones del período de pivote proporcionarán modelos tanto a corto como a largo plazo).
+ Establezca un prefijo fácil de recordar. Por ejemplo, "m1_p3" significa que el indicador es responsable de la exploración en el gráfico M1 con período de pivote = 3.
Por lo tanto, usted ha construido un sistema de exploración. Siempre que haya una señal, el indicador le avisará a través del sistema de notificaciones. Usted tiene muchas opciones diferentes de notificación, tales como a través de MT Alert, a través de correo electrónico, o MT5 aplicación móvil
Preguntas Frecuentes
¿Por qué no aparece nada en el gráfico cuando cargo el indicador?
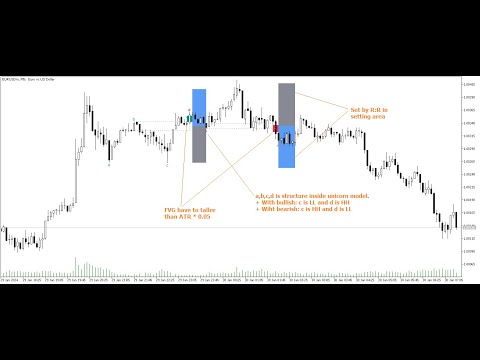
https://www.youtube.com/watch?v=hW-KHHvUCWI
¿Cómo puedo crear un sistema de escaneo de señales con este indicador?