SFT Trendmeister
- Indicadores
-
Artem Kuzmin
 ALL PRODUCTS ▶️ https://www.mql5.com/ru/users/zombiezorrofx/seller
🔥 Maximum commission discounts:
💠 Binance 35% (trading bypassing sanctions) - Versión: 1.0
- Activaciones: 5
Indicador de tendencia de la señal.
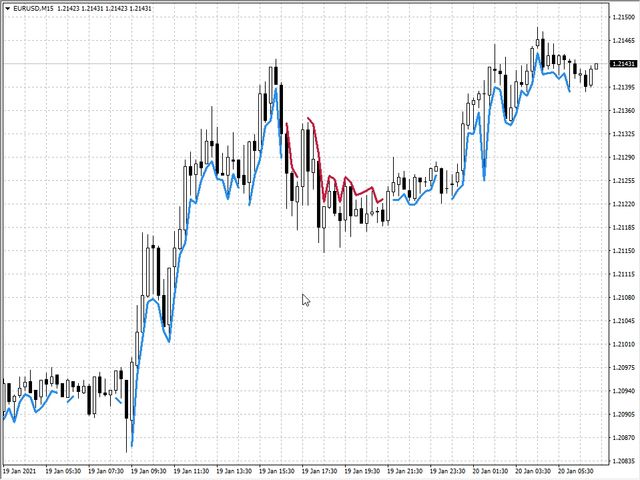
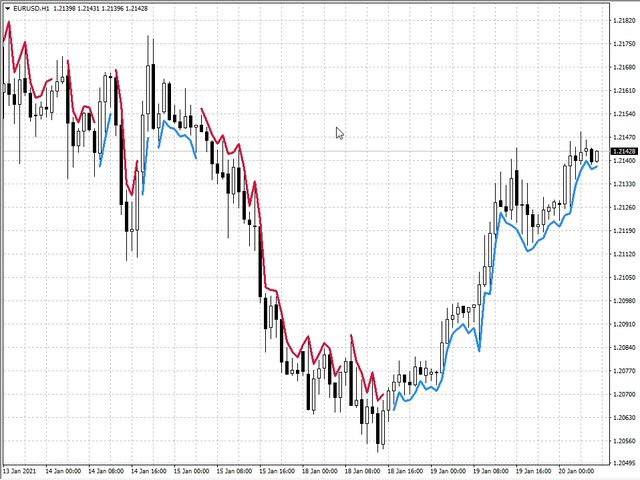
Detecta la dirección de la tendencia y se colorea en consecuencia.
Incorpora alertas sonoras y visuales cuando cambian las tendencias.
Puede enviar notificaciones a su teléfono o correo electrónico.
Permite operar en Tendencia y Contratendencia.
Funciona en todos los plazos, todos los pares de divisas, metales, índices y criptomonedas.
Se puede utilizar con opciones binarias.
Características distintivas
- Sin redibujado;
- Ajustes sencillos y claros;
- Cuatro tipos de alertas;
- Funciona en todos los plazos y con todas las herramientas de negociación;
- Adecuado para operar con divisas, índices, metales, opciones y criptodivisas (Bitcoin, Litecoin, Ethereum, etc.);
- Adecuado para el trading manual y para su uso en la creación de robots de trading (Expert Advisors);
Ajustes del indicador
- Periodo Trendmeister - periodo de cálculo del indicador;
- Profundidad del gráfico - profundidad de visualización del indicador en el gráfico;
- Sonido de alerta - sólo notificaciones sonoras;
- Mensaje deAlerta - muestra mensajes en la pantalla y confirmación sonora de la señal;
- Alert Email - envía señales al correo, instrucciones para configurar el terminalaquí;
- Alert Mobile - envía al teléfono, a través del terminal móvil instalado, instrucciones de configuraciónaquí;
Recomendaciones para operar
- Cuando aparezca una línea roja, abra Vender o Poner (para opciones)
- Cuando aparezca la línea azul, abra Comprar o Comprar (para opciones)
- La dirección de la operación debe ser en la dirección de la tendencia en el marco de tiempo superior.
- Salga de una operación en una señal inversa y en la desaparición de una línea, o en SL y TP establecidos.
- Cuando se utiliza el SL y TP, es aconsejable establecer el SL para el extremo más cercano, TP = 1...2 SL.
- Bien recomendado es utilizar en combinación con el indicador libre SFT Bullet Arrow
- Otras variantes también son posibles, en el proceso de negociación usted será capaz de elaborar la táctica más conveniente para usted.
Para obtener más información y una revisión más detallada de las técnicas de negociación con este indicador, haga clic aquí:
Le deseamos un trading estable y rentable y le agradecemos que utilice nuestro software.
Si le gusta, háganos un favor y compártalo con sus amigos.
Si no quiere perderse nuevos lanzamientos de software útil para el trading - añádase como amigo: SURE FOREX TRADING