Currencies Strength Meters
- Indicadores
- Versión: 1.22
- Actualizado: 4 agosto 2020
- Activaciones: 5

Medidores de resistencia de divisas
:::: ¡¡Esta programado para trabajar en cualquier ventana de Chat M5 !!
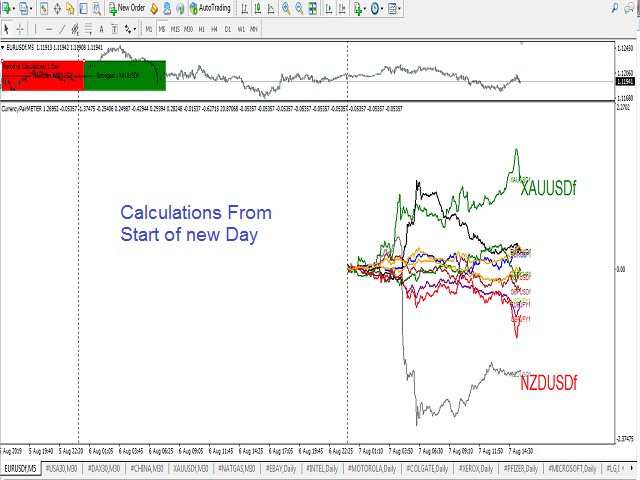
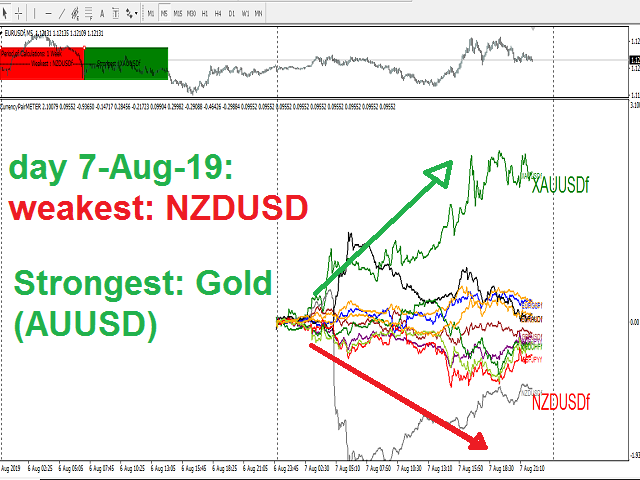
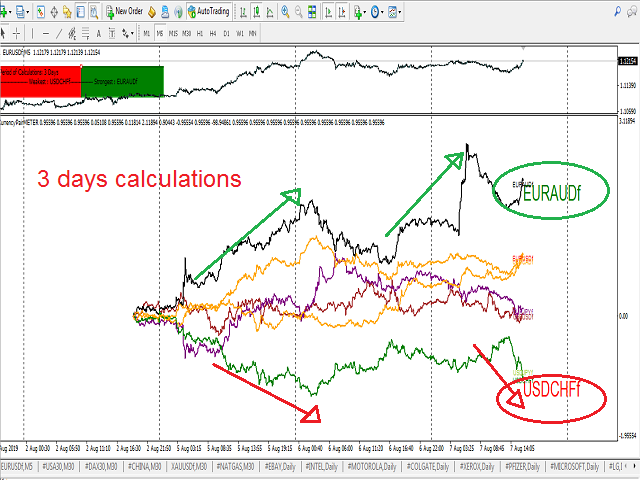
Se utiliza para determinar los pares de divisas más fuertes y los pares más débiles
también detecta el pico de desviación de la fuerza de las divisas
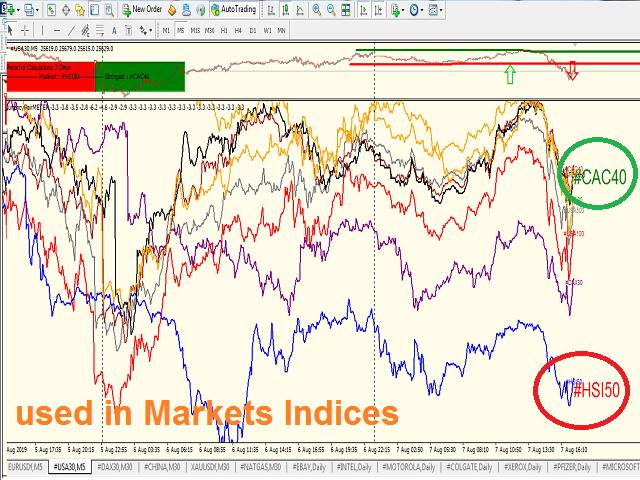
¡¡PUEDE SER UTILIZADO PARA ÍNDICES Y ACCIONES TAMBIÉN !!
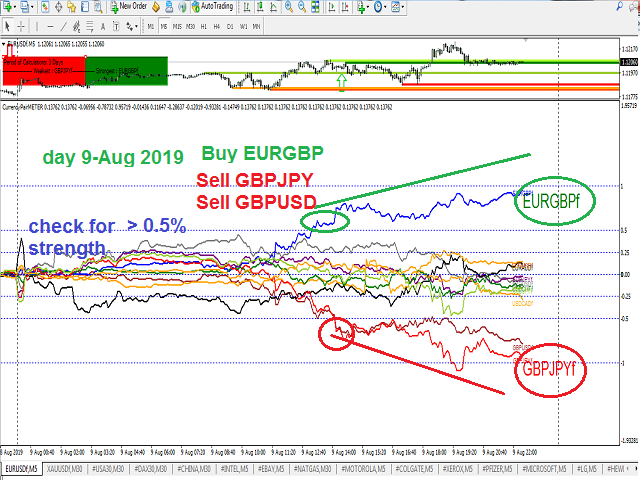
Estrategia uno: Se puede utilizar para COMPRAR el par más fuerte y VENDER el más débil.
Estrategia dos: Se puede utilizar a diario para cubrir la compra del par más fuerte con un alto % (por ejemplo: +1%) y la compra del par más débil con un % más bajo (por ejemplo: -0,7%) lo mismo con la venta.
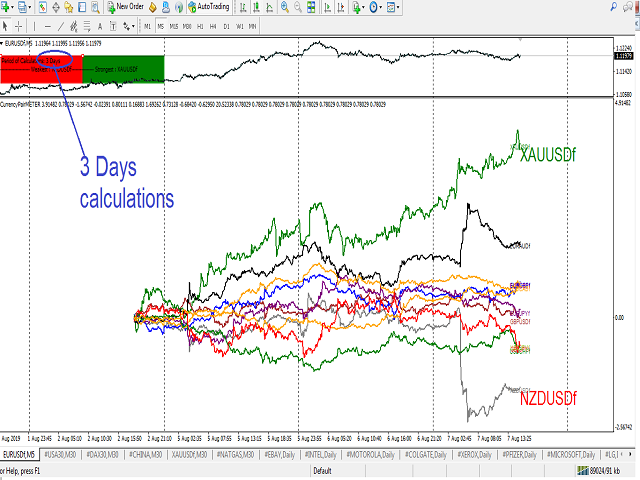
Estrategia tres: en cálculos de 3 días o más: puede detectar las líneas de fuerza de las divisas que se cruzan.
NOTA IMPORTANTE: Este es un indicador multi-monedas mql4 : por lo que no puede ser probado en el módulo probador de estrategia a menos que haya descargado todas las monedas seleccionadas historial de datos
puede combinar hasta 20 pares de divisas
Puede hacer clic en cualquier símbolo en el gráfico para abrir su gráfico para colocar órdenes
El cálculo de la fuerza funciona: desde el comienzo de un día, 1 día, 2 días---> 1 semana
Funciona en cualquier ventana de M5 Chat