Master Hedging Indicator 2Symbols
- Indicadores
- Versión: 1.58
- Actualizado: 17 julio 2020
- Activaciones: 5

Indicador de línea HEDGING MASTER
Compara las líneas de potencia/fuerza de dos símbolos introducidos por el usuario y crea una línea SMOOTHED que indica el grado de desviación de los 2 símbolos
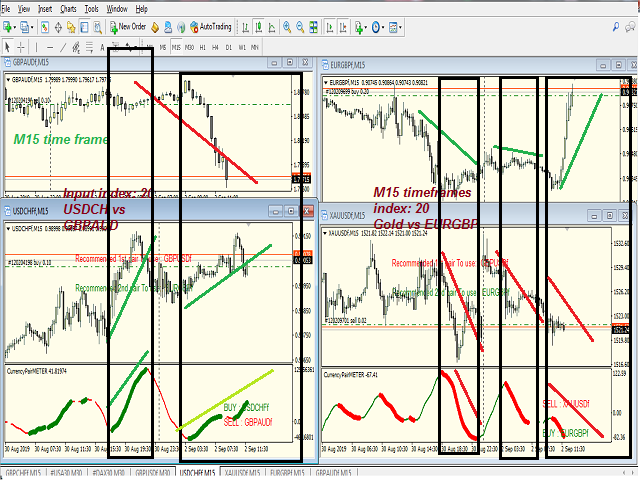
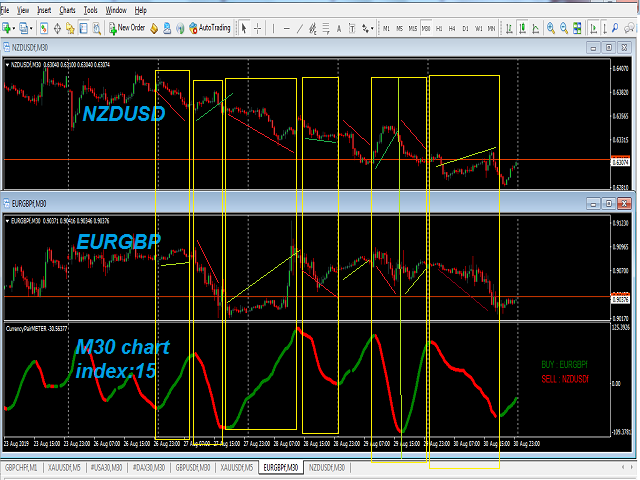
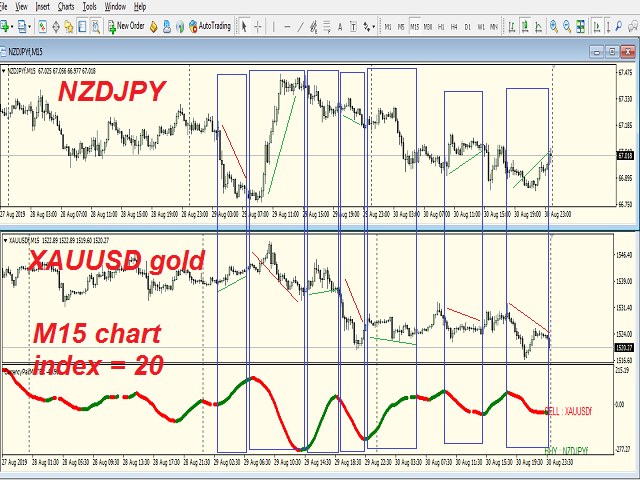
Estrategia#1- SIGA LA LÍNEA GRUESA DEL INDICADOR cuando CRUZE O NIVELE A LA BAJA --- ¡¡¡ COMERCIE EN LA LÍNEA GRUESA DEL INDICADOR (TENDENCIA FAVORABLE) !!!
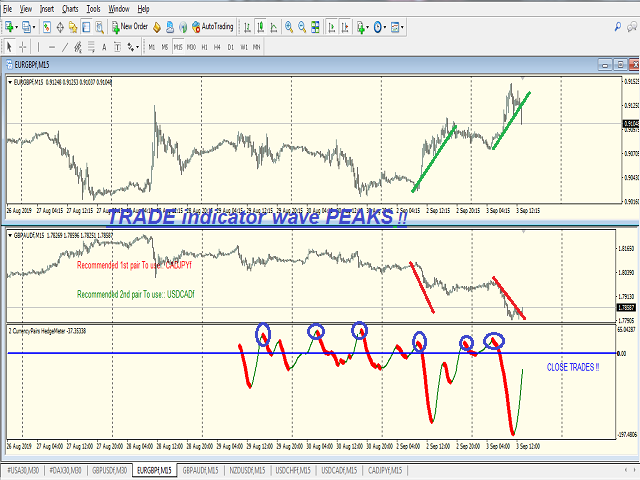
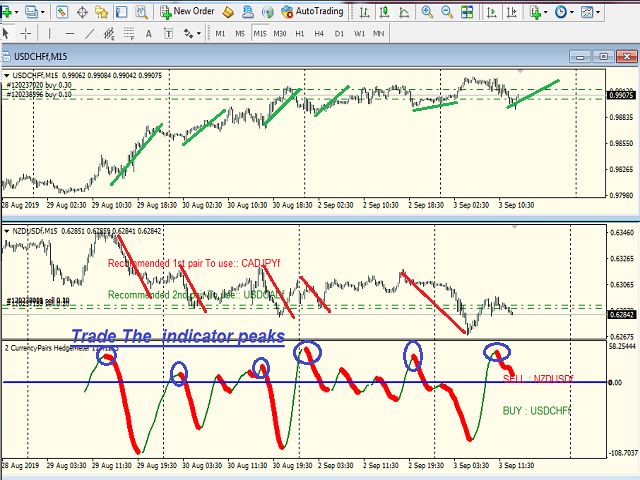
Estrategia#2- COMERCIAR CON LOS PICOS DEL INDICADOR (¡¡¡SIGA LOS NIVELES PICOS DE INVERSIÓN DEL INDICADOR)!!!
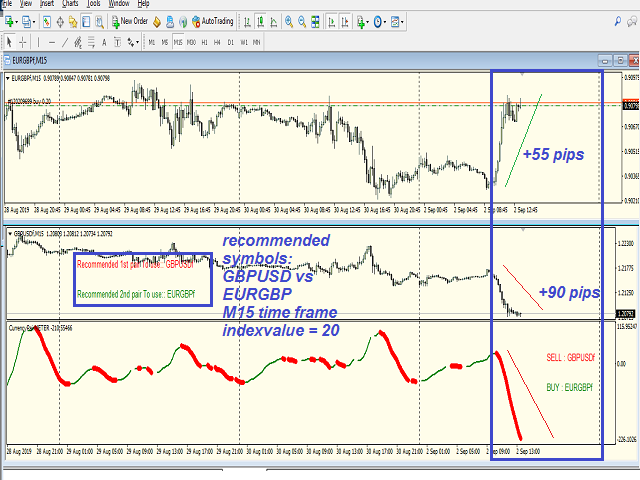
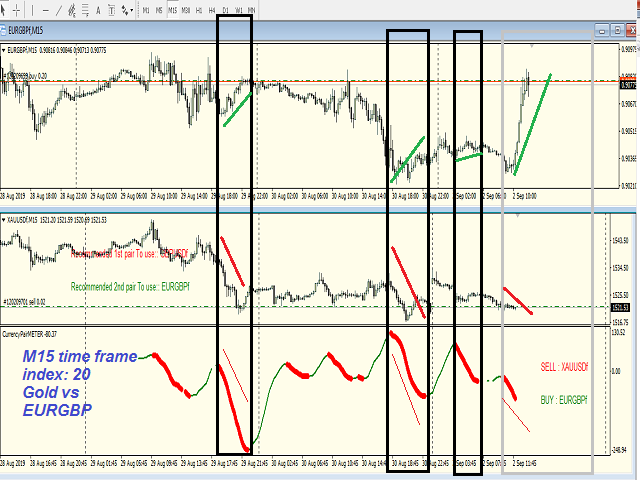
que la entrada - el índice de cálculo ( 10/20/30....)
- el indicador Punto de inicio de trazado (historial del indicador trazado en barras)
- los dos símbolos a comparar ( introduzca cuidadosamente sus Símbolos ya que el formato puede diferir entre diferentes brokers)
- lista de símbolos utilizados para generar una propuesta de dos pares de divisas desviadas a utilizar en la cobertura como sus 2 símbolos de entrada para obtener mejores resultados de cobertura
Funciona en cualquier marco temporal
:::: introduzca cuidadosamente sus Símbolos ya que el formato puede diferir entre diferentes brokers
las etiquetas de los 2 pares de divisas propuestos aparecen en la ventana del gráfico principal para utilizarlos en su conjunto de entradas
SIGA LA LÍNEA GRUESA DEL INDICADOR --- ¡¡OPERA EN LA LÍNEA GRUESA DEL INDICADOR!!
si la línea del INDICADOR baja (LÍNEA GRUESA ROJA : CON LA TENDENCIA && La línea cruza el nivel 0 ) indica que el Símbolo2 está tomando poder sobre el símbolo1 ==> VENDER SÍMBOLO1 + COMPRAR SÍMBOLO2
si la línea del INDICADOR sube (LÍNEA DELGADA VERDE : CONTRA LA TENDENCIA ) ==> CERRAR VENDER SÍMBOLO1 y CERRAR COMPRAR SÍMBOLO2
si la línea del INDICADOR sube (VERDE GRUESO CON LA TENDENCIA && La línea cruza el nivel 0 ) indica que el Símbolo1 está tomando poder sobre el símbolo2==> COMPRAR SÍMBOLO1 + VENDER SÍMBOLO2
si la línea del INDICADOR baja (LINEA DELGADA ROJA : CONTRA LA TENDENCIA ) ==> CERRAR COMPRAR SÍMBOLO1 y CERRAR VENDER SÍMBOLO2
::::I no recomiendo trabajar en línea delgada (Contra la TENDENCIA)
O PICOS DE INDICADORES DE COMERCIO :
- Encuentre los niveles máximos en las ondas del indicador y opere en la reversión Símbolo1 vs Símbolo2 (ejemplo mostrado en las capturas de pantalla adjuntas)
Estrategia #3: Comercio diario en líneas gruesas :
A- La línea gruesa roja (verde) aparece después de la línea fina verde (roja) : Alerta activada para Vender (comprar) Símbolo1 y Comprar (vender)Símbolo2
B - durante el día aparece otra línea gruesa roja (verde) después de la línea fina verde (roja) : Alerta activada para Vender (comprar) Símbolo1 y Comprar (vender) Símbolo2 -Añadir nuevas posiciones del mismo lote
C - Al final del día : Compruebe si el total de las posiciones son rentables ( puede establecer su beneficio en relación a su margen utilizado ) : Cierre sus posiciones por hoy
D-Al final del día: Compruebe si el total de las posiciones no son rentables (puede fijar su beneficio en función del margen utilizado):
Repita los pasos A-D para el día siguiente
F- Si las líneas gruesas se invierten a Verde (rojo) : comience a añadir 2 nuevas posiciones en diferentes direcciones (Comprar (vender) Símbolo1 y Vender (comprar) Símbolo2) y cierre dos posiciones de la tendencia anterior
y repita A-F
ALERTAS para cruzar el nivel 0 o pico de inversión se proporcionan
¡¡PRUEBE LA DEMO ANTES DE COMPRAR !!