Wedge Breakage Signaling
- Indicadores
- Versión: 4.10
- Actualizado: 29 diciembre 2020
- Activaciones: 5

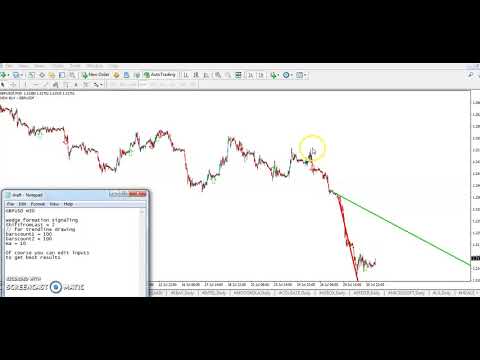
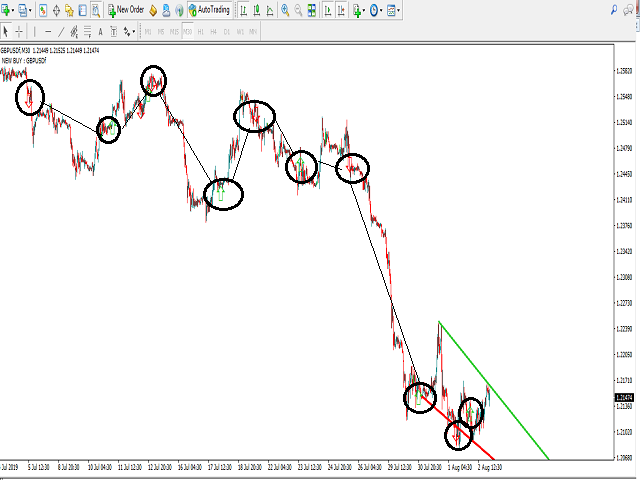
Redibujado automático de los niveles de soportes y resistencias de tendencia y posible formación de patrón de cuña
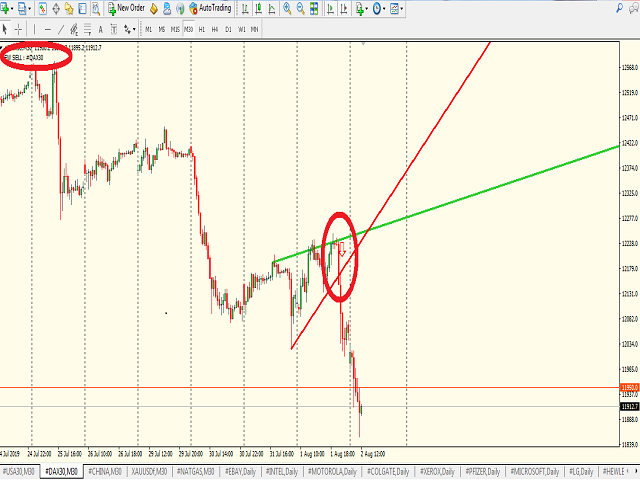
para indicar la ruptura de la Cuña ascendente (señal de VENTA)
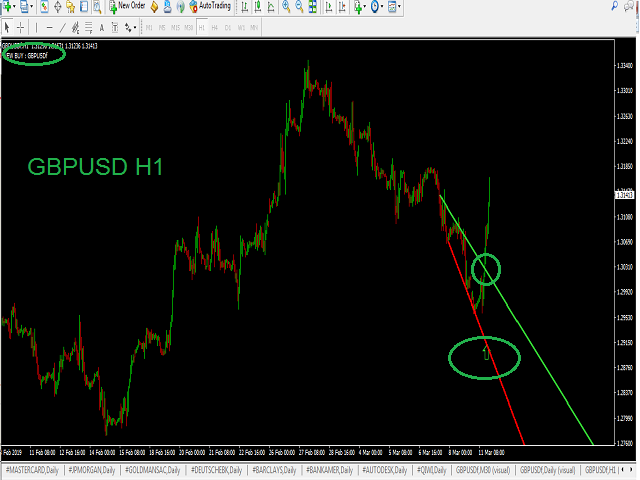
o ruptura de la Cuña descendente (señal de COMPRA)
Indicador muy simple e inteligente
¡¡¡ALERTAS Y NOTIFICACIONES MÓVILES disponibles !!!
puede editar las barras de cálculo de las barras cuentan para la formación de las líneas de tendencia y el desplazamiento inicial del precio actual
Valores más pequeños para las entradas de barras / desplazamiento cuando se utilizan marcos de tiempo más altos (D1-H4) y los valores más altos inversos para marcos de tiempo más bajos (M30-M5)
También se muestra un comentario en la esquina del gráfico indicando las posibilidades de Venta/Compra y
una flecha arriba/abajo en caso de oportunidades de mercado bajista/alcista
también desactivar/activar comentarios
indicando los números de recuento hasta el volumen de garrapatas para redibujar con la vela actual en caso de que usted está utilizando alto marco H1 o superior y la necesidad de volver a dibujar rápido
MI CONFIGURACIÓN FAVORITA:
D1: Bars shift= 1; Trend bars count x = 2;Trend bars count y = 4; Trend Moving Average = 5;
H1: Desplazamiento de barras = 13; recuento de barras de tendencia x = 25; recuento de barras de tendencia y = 40; media móvil de tendencia = 50;
M30: Desplazamiento de barras = 25; recuento de barras de tendencia x = 50; recuento de barras de tendencia y = 75; media móvil de tendencia = 100;
M5: Desplazamiento de barras = 200; recuento de barras de tendencia x = 300; recuento de barras de tendencia y = 450; media móvil de tendencia = 600;