Moving Support Resistance Levels
- Indicadores
- Versión: 1.20
- Actualizado: 13 febrero 2020
- Activaciones: 5

Simple 3 Apoyos móviles y niveles de resistencia
(Su opinión / comentario y retroalimentación es importante !! Gracias)
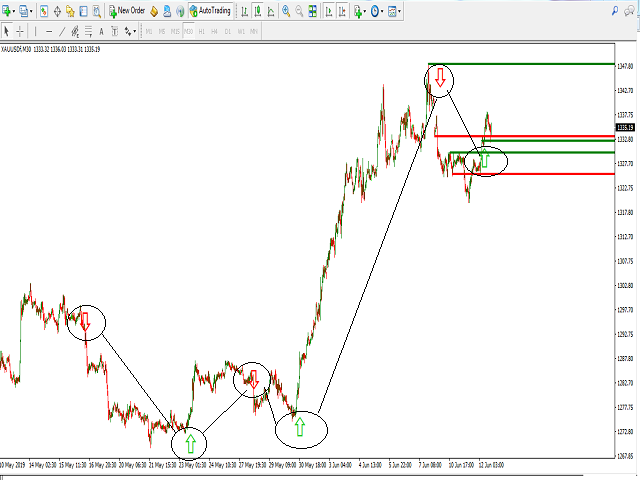
Posibilidades de señal UP y Down creadas al cruzar los múltiples niveles de soporte/resistencia
soporta todos los marcos de tiempo
Entradas ajustadas para el área cubierta para generar los niveles y los desplazamientos necesarios para cubrir 3 áreas soportes /resistencias niveles
por ejemplo, puede utilizar los parámetros principales en los marcos temporales M30:
extern int ShiftFromStart=20;
extern int barsCount=20;
extern int sequenceShifts=50;
input int TrendMovingPeriod =50;
ARRIBA ABAJO Se colocan flechas para posibles posibilidades de COMPRA/VENTA
El usuario no ha dejado ningún comentario para su valoración