Currencies Strongest Weakest
- Indicadores
- Versión: 3.1
- Actualizado: 22 enero 2020
- Activaciones: 5

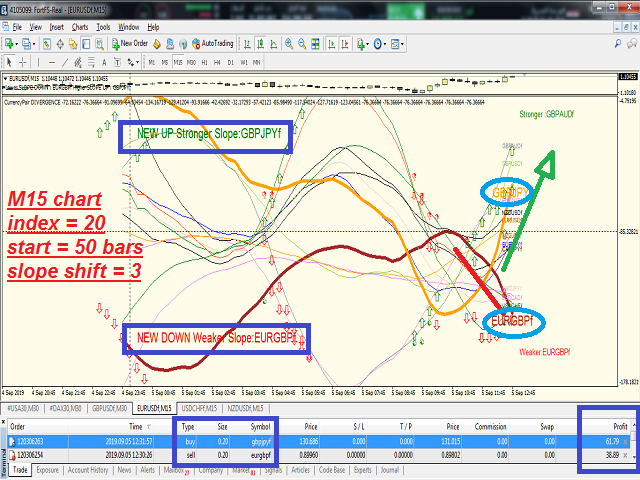
Traza líneas de Fuerza / Poder de la Volatilidad de la TENDENCIA de las Divisas:
- Detecta los 2 pares altamente TRENDED Volatil ( serán las Líneas Negras )
- Un indicador muy útil
- Dibuja líneas suaves para un máximo de 20 pares de divisas que representan la fuerza de la volatilidad y el poder
- En primer lugar, indica los pares de dirección de tendencia más potentes: más fuerte / más débil
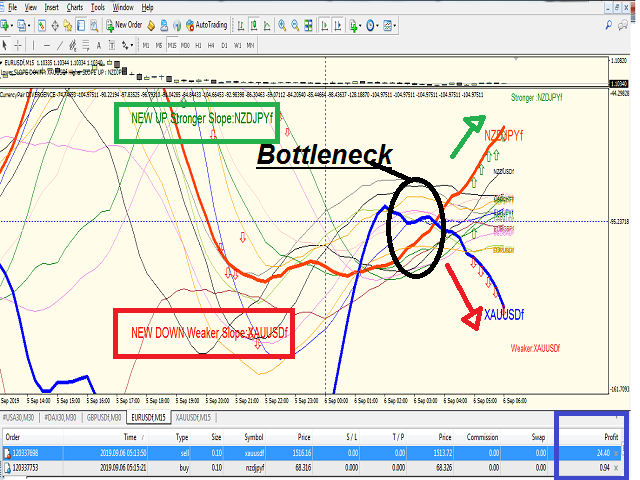
- FUNCIÓN PRINCIPAL: indica la línea más volátil de la tendencia alcista y la línea más volátil de la tendencia bajista .
que podría ayudar a la decisión de comprar los pares más volátiles ARRIBA/ABAJO
1-NUEVA ESTRATEGIA PRINCIPAL:
COMPRAR el par con (cuando se aleje del nivel medio discontinuo hacia arriba o lo cruce hacia arriba): (etiqueta indicada en el gráfico) y con flechas verdes hacia arriba hasta que aparezca un pulgar rojo o espere a que la línea se enfríe hacia abajo y vuelva al nivel medio discontinuo .
VENDER el par de líneas de fuerza volátil ABAJO (cuando salga hacia abajo del nivel medio discontinuo O lo cruce hacia abajo) : (etiqueta indicada en el gráfico) y con flechas rojas descendentes hasta que aparezca un pulgar verde o espere a que la línea se enfríe a la baja y vuelva al nivel medio discontinuo
2-Segunda ESTRATEGIA:
COMPRAR el par más fuerte
VENDER el par más débil
3- Manejo de dinero que uso con la Estrategia 1 y 2 : (Muy importante)
En los mercados asiáticos tiempo: uso 1% de margen para nuevas Señales de Compra/Venta
En los Mercados Europeos: use 3% de margen para nuevas Señales de Compra/Venta
En los mercados de EE.UU. tiempo: uso 9% del margen para nuevas Señales de Compra/Venta
Al final del día: Recomiendo cerrar todas las posiciones abiertas para comenzar un nuevo día.
***Trabaja en cualquier marco de tiempo pero recomiendo desde M15 M30 H1 .... (los marcos más bajos necesitan un mayor índice de valores de cálculo)
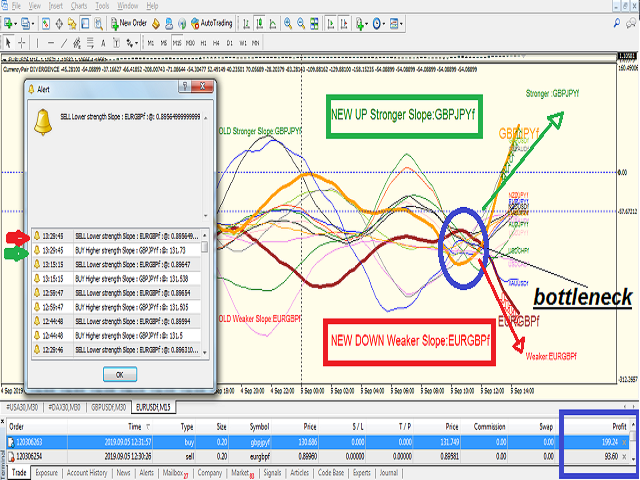
ALERTAS :: recibir mensajes de alerta sobre nuevos pares altamente desviados en volatilidad
Haga clic en la etiqueta del símbolo para abrir su gráfico para el comercio
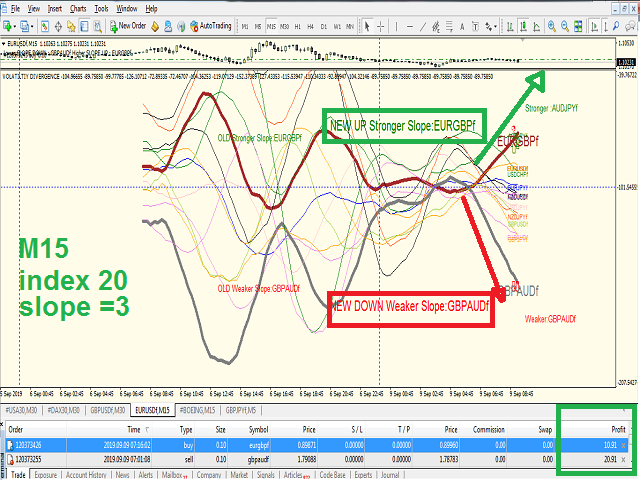
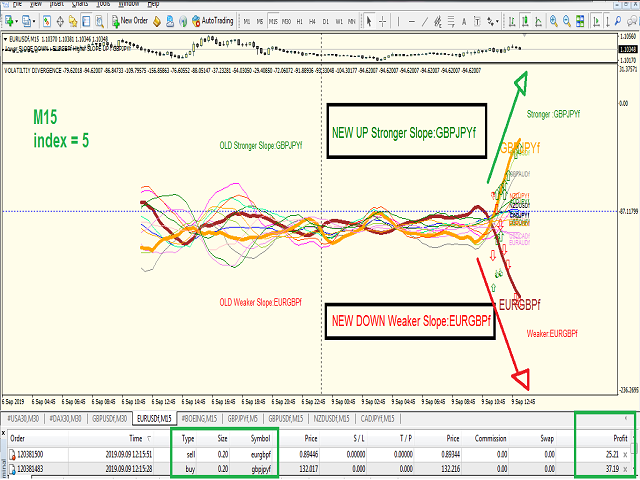
las entradas MAin: ( Yo uso M15 marco de tiempo para cualquiera de sus símbolos seleccionados)
1-Index de cálculos : 10/15/20/25/50/.... ( Yo uso en: M15 time frame : 20) ( Yo uso en: M30 time frame : 10)
2-Punto de inicio de dibujo : 100 - 200 ... bares (Yo uso: 100 para la sobrecarga del procesador más bajo)
3-Desplazamiento de la pendiente : 2,3,4,5.... ( utilizo: 2/3 para una detección rápida de las nuevas líneas desviadas)
4- Opción de alerta : true /false
5- hasta 20 símbolos de entrada ( Para mí trabajo con 4 símbolos sólo : eurusd , gbpusd , usdcad, usdchf )
**Asegúrese de descargar los datos de los símbolos M1 a D1 para todos los símbolos de entrada antes de instalar.
**Asegúrese de que los símbolos de entrada son correctos (ya que los símbolos difieren de un broker a otro y de una cuenta a otra).
**¡Asegúrese de probar antes de purshase !