Trend Lines Signal
- Indicadores
- Versión: 1.2
- Activaciones: 5

Este indicador proporciona señales de compra/venta basadas en cálculos sobre el marco superior (tendencia) y el marco inferior (señales de entrada).
* Usted debe seleccionar el marco superior e inferior para los cálculos del indicador.
* Puede seleccionar los colores de la línea de tendencia como prefiera.
* Active o desactive las alertas.
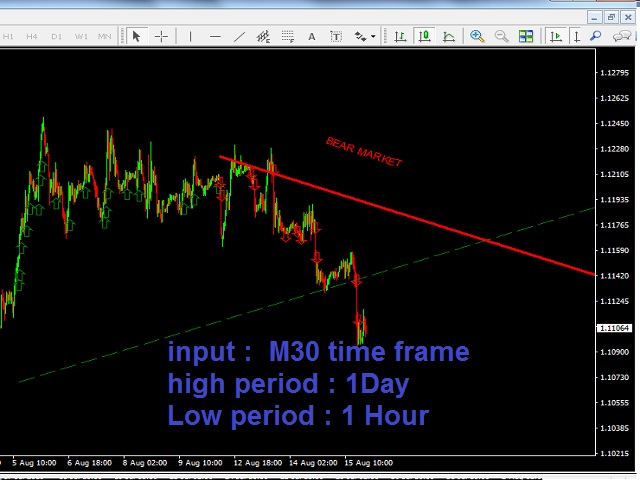
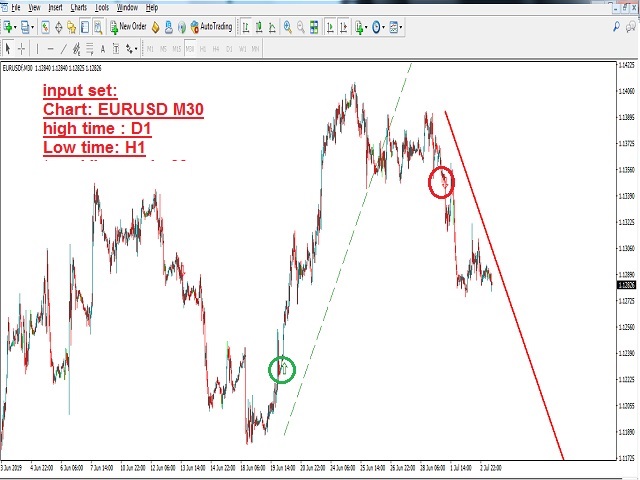
Las líneas de tendencia ARRIBA/ABAJO se dibujan cuando se detecta una tendencia
Espere a que las flechas pequeñas para la entrada :
*Normalmente una flecha hacia ARRIBA en una tendencia hacia ARRIBA es una señal de COMPRA:
---Cierre la posición de COMPRA SI aparece una señal de tendencia inversa ABAJO O cuando la línea de tendencia ascendente cruza a la baja
*Normalmente una flecha hacia ABAJO en una tendencia hacia ABAJO es una señal de VENTA:
---Cierre la posición de VENTA SI aparece una señal de tendencia inversa ascendente.O cuando la línea de tendencia ABAJO cruza hacia arriba
mis parámetros de entrada propuestos :
M30 Chart ::::: High time frame : D1 Low time frame : H1
M1 Chart ::::: High time frame : H1 Low time frame : M5