Price Predictor
- Indicadores
- Versión: 1.24
- Actualizado: 9 julio 2020
- Activaciones: 5

Pronosticador de precios es un indicador que muestra con precisión los retrocesos de precios teniendo en cuenta un marco de tiempo superior y un marco de tiempo inferior patrones de velas cálculos
es ideal para scalping y swing trading.
Las flechas de compra y venta se muestran en el gráfico como señales de entrada.
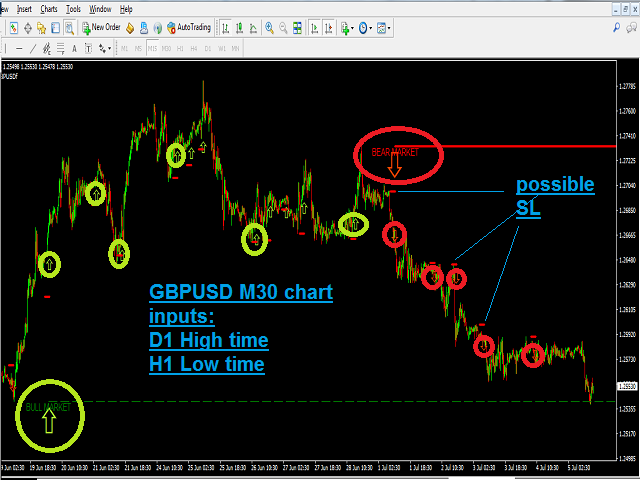
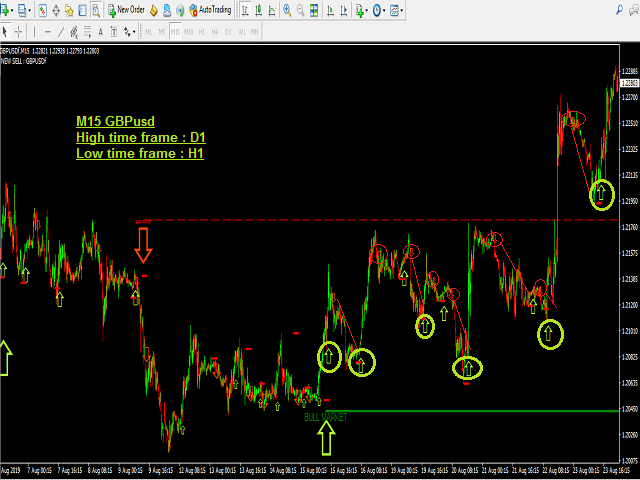
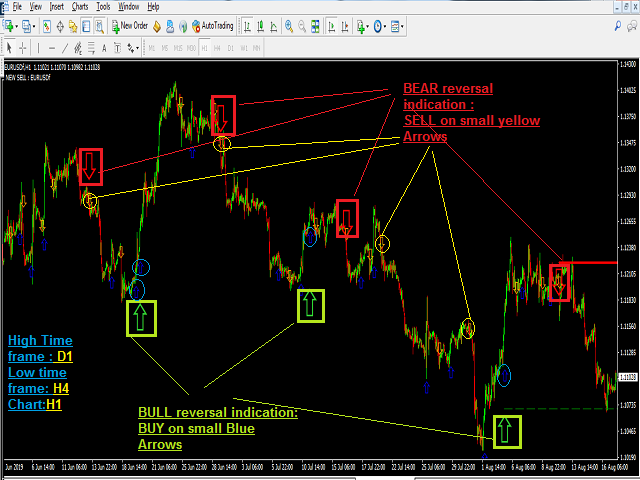
Las flechas GRANDES indican la tendencia - Las flechas PEQUEÑAS señalan una operación (COMPRA/VENTA)
- Una flecha verde GRANDE hacia ARRIBA con una línea verde de soporte indica un mercado alcista: espere la señal de compra.
- Una flecha verde PEQUEÑA hacia arriba después de una flecha verde GRANDE es una señal de::: COMPRA
- Una flecha roja GRANDE hacia ABAJO con una línea roja de resistencia indica un mercado bajista: espere la señal de venta.
- Una flecha roja BAJA PEQUEÑA después de una flecha roja GRANDE es una señal de::: VENTA
Puede cerrar su operación :
**Compra: esperando una flecha pequeña o grande hacia abajo
**Vender: esperando una flecha pequeña o grande hacia arriba
** O usted puede tomar frofit después de ciertos pips como usted hace su estrategia
El indicador de predicción de precios:
= Funciona en cualquier marco de tiempo ( Es mejor hacer que funcione en el marco de tiempo inferior seleccionado o el siguiente marco de tiempo inferior al seleccionado)
= Funciona en cualquier par de Mt4
= Ideal para Scalping
= Ideal para Swing Trading
= Alertas de Entrada
=Gran herramienta para principiantes y profesionales
Usted tiene que seleccionar dos marcos de tiempo como entradas:
- un marco de tiempo superior para indicación de tendencia
- y un marco de tiempo inferior para la señal de compra/venta/cierre
como ejemplo :
en cualquier par de divisas gráfico M15/M5 : use D1/H4 como marco de tiempo superior y H1/H4 como marco de tiempo inferior
!!! nota importante :::
¡¡¡El indicador no retrocede cuando se instala por primera vez en el gráfico
una vez instalado espere a que se dibujen nuevos patrones y señales
descargue la versión demo y utilice el probador de estrategias para probar en el historial antiguo antes de alquilar !!!


El usuario no ha dejado ningún comentario para su valoración